. 2024 Nov;26(11):1832-1844.
doi: 10.1038/s41556-024-01521-9. Epub 2024 Oct 2.

Recording morphogen signals reveals mechanisms underlying gastruloid symmetry breaking

Affiliations

Recording morphogen signals reveals mechanisms underlying gastruloid symmetry breaking

Harold M McNamara et al. Nat Cell Biol. 2024 Nov.

Abstract

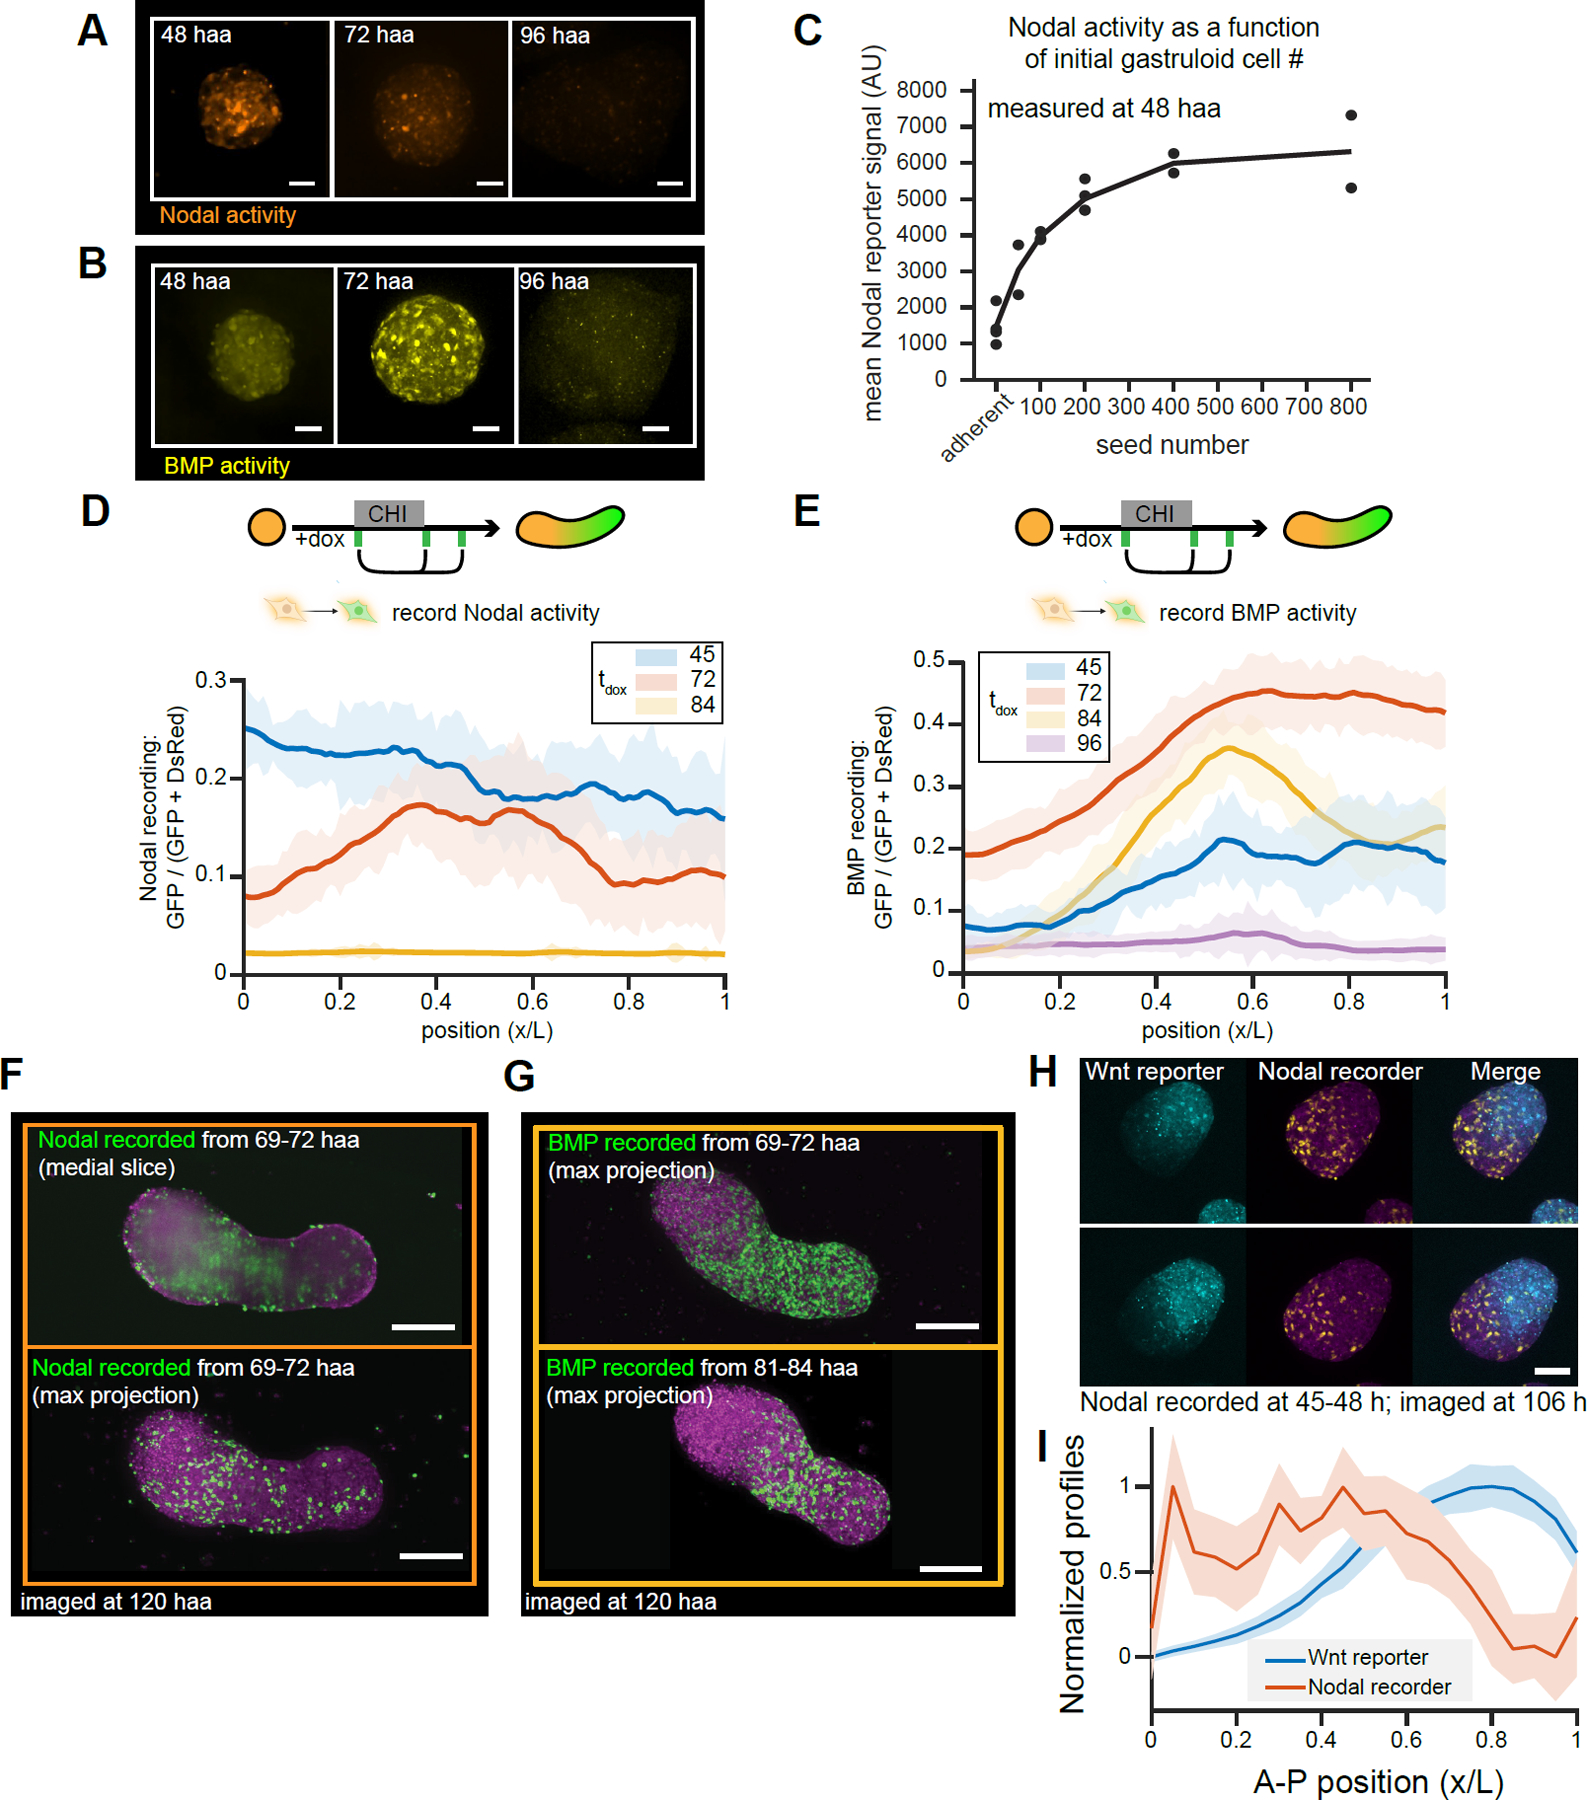
Aggregates of stem cells can break symmetry and self-organize into embryo-like structures with complex morphologies and gene expression patterns. Mechanisms including reaction-diffusion Turing patterns and cell sorting have been proposed to explain symmetry breaking but distinguishing between these candidate mechanisms of self-organization requires identifying which early asymmetries evolve into subsequent tissue patterns and cell fates. Here we use synthetic 'signal-recording' gene circuits to trace the evolution of signalling patterns in gastruloids, three-dimensional stem cell aggregates that form an anterior-posterior axis and structures resembling the mammalian primitive streak and tailbud. We find that cell sorting rearranges patchy domains of Wnt activity into a single pole that defines the gastruloid anterior-posterior axis. We also trace the emergence of Wnt domains to earlier heterogeneity in Nodal activity even before Wnt activity is detectable. Our study defines a mechanism through which aggregates of stem cells can form a patterning axis even in the absence of external spatial cues.


Conflict of interest statement

Competing interests J.E.T. is a scientific advisor for Prolific Machines and Nereid Therapeutics. B.A. is an advisory board member with options for Arbor Biotechnologies and Tessera Therapeutics, and holds equity in Celsius Therapeutics. H.M.M. is a cofounder and scientific advisor for C16 Biosciences. The remaining authors declare no conflicts of interest.

Figures

Extended Data Figure 1.
Extended Data Figure 1.. Benchmarking the Wnt reporter during gastruloid development.
(A) Characterization of off-kinetics of destabilized iRFP reporter of Wnt activity (PTCF/LEF-iRFP-PEST). Shaded region indicates mean +/− standard deviation. (B) Experimental protocol for gastruloid growth with ‘LIF only’ seed culture media. (C) Patterns of Wnt activity in gastruloids grown according to protocol in Extended Data Fig. 1B. Wnt activity is heterogeneous both immediately before (t = 48 h) and immediately after (t = 72) CHIR treatment. Scale bar = 200 µm. (D) Representative data illustrating how single cells were gated for analysis from flow cytometry data (see Methods). (E) Definition of threshold to define Wnt-active versus Wnt-inactive cell populations (Fig. 1F) based on separation of activity distributions before (t=48 haa) and after (t=72 haa) CHIR stimulation. (F) Schematic of quantification of ΔCOM polarization metric (Fig. 1G). (G) Representative images of Wnt activity patterns at different timepoints during polarization. Maximum intensity projections are shown. Scale bar = 200 μm.
Extended Data Figure 2.
Extended Data Figure 2.. Characterizing signal-recorder gene circuits.
(A) Recording efficiency in Wnt-Recorder cells depends on doxycycline concentration (2i+LIF medium, 24 h recording window). (B) Recording efficiency in Wnt-Recorder cells depends on the concentration of recombinant Wnt3a ligand (200 ng/mL doxycycline, 24 h recording window). Shaded regions in (A-B) indicate mean +/− standard deviation (3 biological replicates per condition). (C) Flow cytometry histograms corresponding to recorder-ligand crosstalk measurement in Figure 2E. Recording windows were 6 h for Wnt Recorder and Nodal Recorder, and 3 h for BMP recorder. All ligand concentrations (including dox) were 200 ng/mL. (D) BMP-Recorder labeling is sensitive to BMP inhibition with LDN-193189.
Extended Data Figure 3.
Extended Data Figure 3.. Measuring positional information in signal-recorded gastruloids.
(A) Illustration of image processing pipeline. Maximum intensity projections of gastruloids are segmented, skeletonized, and then binned to assign an A-P coordinate to each pixel (Methods). (B) Left: Example quantification of average A-P profiles of both GFP and DsRed expression within a single gastruloid (tdox = 114 h, tf = 144 h). Pixel intensities were separately normalized relative to maximum image intensities in each channel. Right: relative fraction of GFP labeling across the A-P axis within the same gastruloid (Methods). (C) Overlay of relative fraction of GFP labeling in individual gastruloids for the same recording condition, along with the mean profile for this condition. (D) Simultaneous measurement of the final Wnt activity pattern and recorded Wnt activity signal within the same gastruloid. Maximum intensity projection is shown. Scale bar = 200 μm. (E) Kymograph of the data presented in Figure 3B to visualize different Wnt dynamics corresponding to different spatial positions. Following the emergence of an anterior domain at tdox = 96 h, Wnt signaling becomes progressively more restricted to the posterior domain. (F) Integrated Wnt signaling activity between t = 96 and t = 134 h shows a linear ‘temporal gradient’ associated with A-P fate. Shaded regions indicate mean +/− standard deviation as a function of A-P position.
Extended Data Figure 4.
Extended Data Figure 4.. Single-cell sequencing of 120 haa Wnt-recorded gastruloids.
(A) Comparison of gene expression between Leiden clusters identified in gastruloids at tseq = 120 h and annotated cell types from a reference atlas gene expression during mouse gastrulation. Size of dots indicates the number of shared marker genes; color indicates the binomial likelihood of having at least this many marker genes if compared to a random choice of marker genes (Methods). (B) Single-cell expression levels of reference genes associated with gastrulation and axial morphogenesis. (C) Illustration of reference gene organization across the anterior-posterior axis during axial elongation and somitogenesis. The organization of reference gene expression (Extended Data Fig. 4B) aligns with inferred histories of Wnt activity (Fig. 3C) (D) Final Wnt activity distribution across cells as measured by PTCF/LEF-rtTA expression. (E) Left, Left-center: individual cells in data set separated according to Wnt-recording condition. Right-center, right: embedding density of cells according to Wnt-recording condition. (F) Relative contributions of GFP-positive and GFP-negative cells to different Leiden clusters, normalized according to total cells recovered in both conditions (Methods).
Extended Data Figure 5.
Extended Data Figure 5.. Exploring Gastruloid reaggregation.
(A) Computer simulation of signal-recording and dissociation/reaggregation experiment in the case of a reaction-diffusion Turing patterning circuit without cell rearrangements. Cell states are labeled according to signaling activity during an intermediate state, then cells locations are randomly shuffled (simulating dissociation), and continued to evolve according to the same reaction-diffusion equations. (B) Quantification of final A-P profiles of recording simulations under reaction-diffusion assumptions, averaged over n=100 independent trials. Because a ‘new’ pole forms following reaggregation, recorded cells remain evenly distributed across the A-P axis. (C) Representative imaging of cell-sorting polarization following bulk reaggregation. n = 20 of 48 samples recovered show a single pole of Wnt-recorded cells (left). n = 28 of 48 show at least two poles of Wnt activity (right). Smaller ‘satellite’ clusters were not quantified. Maximum intensity projections are shown. Scale bar = 100 μm. (D) Quantification of A-P axis length for reaggregated samples by flow cytometric sorting vs “bulk” reaggregation by pipetting cells into wells. Error bars indicate mean +/− standard deviation. (E) Analysis of differential motility in polarized gastruloids. Left, Middle images: beginning and endpoint images of interval used to calculate motility. Right: average motility map, calculated using particle image velocimetry (PIV) on the nuclear iRFP channel. Motility was calculated for each frame, and then averaged to generate average motility maps (Methods). (F) A-P motility profiles for each of three biological replicates, calculated by averaging motility maps along the A-P axis. (G) Overall average A-P motility profile for all samples analyzed. Shaded area represents mean +/− standard deviation at each A-P position.
Extended Data Figure 6.
Extended Data Figure 6.. Gene expression patterns in 96 haa Wnt-reporter gastruloids.
(A) Comparison of gene expression between Leiden clusters identified in gastruloids at tseq = 96 h and annotated cell types from a reference atlas gene expression during mouse gastrulation (Methods). Size of dots indicates the number of shared marker genes; color indicates the binomial likelihood of having at least this many marker genes if compared to a random choice of marker genes (methods). (B) Expression of signaling-associated genes within the scRNAseq dataset at tseq = 96 h. (C) Expression of retinoic acid biosynthesis enzyme Aldh1a2 in the Wnt-inactive cell population. Maximum intensity projections show, scale bar = 50 µm. (D-E) Positive feedback is required to maintain Wnt activity following cessation of CHIR treatment at 72 haa. (D) Flow cytometry measurements of single cell Wnt activity levels in dissociated gastruloids at 96 haa. Treatment with the inhibitor of Wnt secretion IWP-2 from 72 haa-onwards converts majority of cells to the Wnt-off population. (E) Imaging of Wnt activity patterns of intact gastruloids at 96 haa, with and without IWP-2 treatment. Maximum intensity projections are shown. Scale bar = 50 µm.
Extended Data Figure 7.
Extended Data Figure 7.. Role of cell adhesion in gastruloid self-organization.
(A) Single-cell differential expression of additional genes associated with cell-cell adhesion at 96 haa. (B) Doxycycline-dependent expression of Cdh1 within the iCdh1 cell line. Maximum intensity projections shown, scale bar = 10 µm. (C) Doxycycline-dependent expression of Pcdh19 with the iPcdh19 cell line. Maximum intensity projections shown, scale bar = 10 µm. Clones were chosen for similar expression levels upon induction. (D-E) Average radial concentrations of cell lines in mosaic spheroids with and without doxycycline treatment (related to Fig. 6H). N=84 spheroids measured (Table S3). Shaded regions indicate mean +/− standard deviation. (F) Representative images of iCdh1/iPcdh19 mosaic spheroids. Maximum intensity projections shown, scale bar = 100 µm. (G) Histogram of polarization alignment in fused gastruloids generated by fusing two wildtype spheroids, with and without doxycycline. (H) Quantification of average polarization alignment of fused spheroids in different conditions (related to Fig. 6L, Extended Data Fig. 7G). N = 58 gastruloids total (Table S3). Conditions compared via two-sided t-Test. P-values: p=0.54, p = 0.00012. There asterisks (***) indicate p<0.001.
Extended Data Figure 8.
Extended Data Figure 8.. Recording Nodal/BMP signaling during gastruloid self-organization.
(A) Measurement of Nodal activity (PAR8-mCherry-PEST) at different timepoints during gastruloid development=. Maximum intensity projections are shown, scale bar = 50 µm. (B) Measurement BMP activity (PIBRE4-mCherry-PEST) at different timepoints during gastruloid development. Maximum intensity projections are shown, scale bar = 50 µm.. Scale bars = 50 µm. (C) Nodal activity levels in 48 haa gastruloids as a function of initial aggregate size. Nodal activity at 48 haa requires aggregation, and monotonically increases with aggregate size. Adherent cells were measured after 48 haa in equivalent media (N2B27) for comparison. (D) Recordings of early Nodal activity traced to tF = 120 haa. (E) Recordings of early BMP activity traced to tF = 120 haa. Shaded regions for C-D indicate standard deviation as a function of A-P position. N = 116 gastruloids measured total (Table S3). (F) Representative image of spatial distribution of cell fates with recorded Nodal activity from 69–72 haa, imaged at 120 haa. Top: medial slice. Bottom: Maximum intensity projection. Scale bar = 200 µm. (G) Representative images of cell fates with recorded BMP activity from 69–72 haa (top) and from 81–84 haa (bottom). Scale bar = = 200 µm. Maximum intensity projections are shown for both recording timepoints. (H) Simultaneous recording of early Nodal activity (recorded from 45–48 haa) and reporting of later instantaneous Wnt activity (imaged at 106 haa) in the same gastruloid using an engineered clonal cell line. Maximum intensity projections of three separate representative gastruloids are shown. Scale bar = 100 um. (I) Spatial distribution of early Nodal activity (recorded from 45–48 haa) traced to tf = 120 haa, plotted alongside final Wnt activity. Normalized profiles are shown for comparison. Shaded region represents mean +/− standard error of the mean for Nodal recording, and mean +/− standard deviation for Wnt reporting. (I). Nodal recording data from (H), plotted without normalization. Recording density varies approximately twofold along the A-P axis. N = 15 gastruloids measured.
Extended Data Figure 9.
Extended Data Figure 9.. Perturbing Nodal/BMP signaling during gastruloid self-organization.
(A) Flow cytometry measurements of single-cell Wnt activity levels with and without Activin A pretreatment, measured at t = 72 h. (B) Flow cytometry measurements of single-cell Wnt activity levels with and without BMP4 pretreatment, measured at t = 72 h (left) and t = 96 h (right). (C) Dynamics of Nodal activity during gastruloid development, measured by flow cytometry of pooled and dissociated gastruloids. Substantial Nodal activity is detectable from 36–60, preceding CHIR stimulation at 48 and subsequently decaying to negligible levels by 72 h. (D) Nodal signaling levels in adherent cells treated for 48 h with different concentrations of recombinant Activin A (in N2B27). Dotted line is the mean gastruloid Nodal activity level at 48 haa under standard conditions (i.e., initial aggregate of n=200 cells) plotted for comparison. (E) Effect of a transient ActA treatment (100 ng/mL, applied from 45–48 haa) on Wnt activity levels at 96. Transient ActA treatment continues to cause an enrichment in Wnt-off cells at 96 haa, even when duration of treatment is reduced. (F) Co-treatment of adherent Wnt reporter cells with BMP4 affects responses to Wnt3a treatment. Whereas moderate BMP4 (25 ng/mL) treatment facilitated the Wnt response (middle), higher BMP4 (125 ng/mL) treatment suppressed the Wnt response.
Extended Data Figure 10.
Extended Data Figure 10.. Phenotypic consequences of Nodal perturbation.
Figure S10. (A-B). Quantification of anteroposterior morphology. (A) Gastruloid morphologies were segmented, binned according to nearest A-P axis coordinate (methods, Extended Data Fig. 3), and then divided into anterior and posterior compartments based on the midline of the A-P axis (i.e., without reference to Wnt activity). (B) Comparison of difference in area between anterior and posterior compartments under different Activin treatment conditions (i.e., for samples analyzed in Fig 7G–H). 100 ng/mL Activin A treatment causes a morphological enlargement of the anterior compartment. N = 42 gastruloids measured (Table S3). Statistical comparisons made via two-sided t-Test; two asterisks (**) indicate p≤0.01. P-values were: control and 10 ng/mL Activin, p = 0.84; control and 100 ng/mL Activin, p=0.010; 10 ng/mL Activin and 100 ng/mL Activin, p = 0.0091. (C) Recording in the Nodal Recording cells is abolished with treatment with the Nodal inhibitor SB-431542. Activity was recorded for 3 h in 100 ng/mL doxycycline. (D) Endogenous early Nodal activity in gastruloids is abolished by Nodal inhibition from 24–48 haa. (Left) Nodal activity was recorded from 45–48 haa, with 100 ng/mL doxycycline, and measured at 68 haa. (Right) Early Nodal inhibition (from 24–48 haa) also abolished the formation of Wnt activity patches during symmetry breaking at 96 haa.
Figure 1:
Figure 1:. Gastruloids self-organize a polarized posterior domain of Wnt activity.
(A) In the mouse embryo, gastrulation is initiated by extraembryonic sources of BMP and Wnt ligands in the posterior epiblast. Nodal activity marks the anterior-most aspect of the resultant primitive streak (i.e., the ‘node’). Extraembryonic inhibitors of Wnt and Nodal signaling pattern the anterior epiblast. (B) The gastruloid self-organizes a posterior domain of Wnt activity without any extrinsic spatial cues. Representative image from 6 similar gastruloids measured at 120 haa. Scale bar = 200 µm. (C) Protocol to observe evolution of Wnt symmetry breaking from a uniform initial condition. mESC cultures were maintained in 2i+LIF culture media until immediately before gastruloid formation to suppress pre-existing heterogeneity in Wnt activity. (D) Dynamics of Wnt activity patterns during symmetry breaking, as measured by expression of a destabilized iRFP downstream of Wnt-sensitive TCF/LEF enhancer sites. Samples were fixed at variable timepoints and imaged to measure spatial distributions of Wnt signaling during polarization. Images represent at least 5 similar gastruloids measured at each timepoint. Scale bars = 200 µm. (E) Single-cell Wnt activity levels were measured by flow cytometry. Histograms of Wnt activity indicate an initially uniform response to Wnt activation with CHIR at 72 h, followed by a bimodal response. (F) Quantification of the proportion of cells which are Wnt active over time. A Wnt-inactive population is first detectable at t = 90 hours. (G) Quantification of heterogeneity and polarization in spatial patterns of Wnt activity during gastruloid morphogenesis (n = 76 gastruloids measured, see Table S3). Heterogeneity is reported as a normalized standard deviation, and polarization is reported as a normalized distance between the center of mass (COM) of Wnt activity and morphological images. Quantification indicates an onset of heterogeneity at t = 90 haa (consistent with flow cytometry), followed by polarization at t = 108 haa. Shaded regions indicate mean +/− standard deviation as a function of time post-seeding.
Figure 2:
Figure 2:. Tracing signaling activity in embryonic stem cells using signal-recorder gene circuits.
(A) Illustration of signal tracing strategy. In order to identify which early asymmetries direct self-organization, one would ideally permanently label early cell states so that they can be traced to final cell fates. Intrinsic cues which break symmetry should predict future patterning positions and/or transcriptional cell types. (B) Schematic of recording circuit. An upstream transcription factor (rtTA) requires both signaling activity and small-molecule addition to drive recombinase expression, which in turn irreversibly changes the fluorophore in a ‘recording’ locus. (C) Characterization of a clonal Wnt recording cell line’s fidelity. 24 h incubation with both Wnt-activating CHIR (3 µM) and listening window-defining doxycycline (2 µg/mL) achieves complete GFP labeling (left, bottom). Treatment with either CHIR or doxycycline alone has no detectable labeling (left, top). A 1 h recording window is sufficient to achieve efficient labeling (right). (D) Characterization of switching kinetics of Wnt recorders in response to media changes. A 1 h doxycycline treatment was applied at variable lag times (Δt = tdox − t0) following a media change. Shaded region indicates mean value +/− standard deviation across three biological replicates per condition. Recorder performance approached steady-state media performance by Δt = 6 h. (E) Crosstalk assessment for 3 separate clonal lines recording Wnt, Activin/Nodal, and BMP pathway activity. All recording windows utilized 100 ng/mL doxycycline and 200 ng/mL morphogen concentration. Baseline conditions report labeling with only doxycycline in basal media (N2B27). Pseudocolors indicate relative proportion of cells labeled with GFP expression. Recording windows were 6 h for Wnt and Nodal recorders and 3 h for the BMP recorder to account for differences in sensitivity.
Figure 3:
Figure 3:. Recorded Wnt signaling histories identify critical time window for specifying cells’ future positions and fates.
(A) (top) Dynamics of early Wnt activity patterns during symmetry breaking. (bottom) Tracing these early Wnt activity to final anterior-posterior patterning fates with a Wnt recording circuit. Wnt activity was recorded with doxycycline treatment at variable tdox early in the culture protocol, and then gastruloids were further grown to a fixation time of tf = 134 haa. Images represent at least 5 similar gastruloids measured at each timepoint. Scale bars = 200 µm. (B) Quantification of anterior-posterior (A-P) axial patterns of Wnt recorder labeling at different timepoints throughout gastruloid morphogenesis at 6 h temporal resolution (n = 110 gastruloids measured, see Table S3). Shaded regions indicate mean +/− standard deviation as a function of A-P position. Wnt activity first predicts a clear separation between anterior and posterior fates for tdox = 96 haa (green curve). (C) Wnt activity at 96 haa also predicts transcriptional cell fates. Left: cell types identified by Leiden clustering of single cell transcriptomes at tseq = 120 haa. Right: relative composition of Leiden clusters according to Wnt activity recorded at tdox = 96 haa. Wnt activity is broadly distributed throughout most clusters, but excluded substantially from the somite, endoderm, and endothelial clusters (see also Methods).
Figure 4:
Figure 4:. Gastruloid polarization is driven by cell sorting.
(A) Experimental design to test polarization mechanism. Wnt activity is recorded in intact gastruloids at 96 haa, and samples are then dissociated and reaggregated to test for reorganization of anteroposterior patterns. (B) Representative images showing Wnt activity prior to dissociation (left), and sorted positions of Wnt-recorded cells following reaggregation by either whole-gastruloid reaggregation (middle) or flow cytometer reaggregation (right) (Methods). Images represent over 20 similar gastruloids from each condition. Maximum intensity projections are shown, scale bars = 100 µm. (C) Relative distribution of GFP labeling along the A-P axis following reaggregation reveals anteroposterior sorting, with similar spatial profiles under both methods despite different aggregate sizes (ED Fig. 5D) (n = 54 gastruloids measured, see Table S3). Shaded regions indicate mean +/− standard deviation as a function of A-P position. (D) Still images from Movie S1 illustrating dynamics of cellular rearrangements during the early stages of Wnt polarization. Stills represent 5 similar gastruloids measured. Maximum intensity projections are shown, scale bar = 50 µm. (E) Still images from Movie S3 illustrating dynamics of cellular rearrangements during later stages Wnt polarization. These rearrangements sort cells from patchy expression domains into a globally polarized signaling axis. Stills represent 2 similar gastruloids measured. Maximum intensity projections are shown, scale bar = 50 µm.
Figure 5:
Figure 5:. Sustained Wnt activity does not directly coordinate gastruloid cell-sorting.
(A) Wnt activity at t = 96 haa is organized into ‘patchy’ patterns of local correlated domains lacking global polarization. Image represents 23 similar gastruloids measured. Maximum intensity projection is shown, scale bar = 100 µm. (B) scRNAseq analysis of gastruloids collected at tseq = 96 haa. Left: Leiden clustering identified 2 transcriptionally divergent cell types. Right: Wnt activity (as measured by PTCF/LEF-rtTA expression) was highly concentrated within cluster 2 (‘Wnt active’) and excluded from cluster 1 (‘Wnt inactive’). (C) Volcano plot reveals genes which are differentially expressed between the two Leiden clusters. (D) Representative results from signal recording and reaggregation experiments performed in the presence of the Wnt secretion inhibitor IWP-2. Images represent over 20 similar gastruloids measured in each condition. Maximum intensity projections are shown, scale bar = 100 µm. (E) Average anterior-posterior profiles of final instantaneous Wnt activity (top), and of recorded Wnt activity prior to dissociation (bottom). Although IWP-2 eliminates the pattern of maintained Wnt activity, prior recordings of Wnt signaling continue to predict final A-P cell positions. (n = 49 total gastruloids measured; shaded region indicates mean +/− standard deviation).
Figure 6:
Figure 6:. Differential cadherin expression mediates changes in tissue mechanics and cell sorting in stem cell aggregates and gastruloids.
(A) Illustration of cadherin-mediated cell sorting. Differential cadherin expression causes different cell-cell adhesion affinities, which in turn mediates multicellular phase separation in fluid tissues. (B) Differential expression of cadherins between Wnt-high and Wnt-low gastruloid cells at 96 haa. Images represent 8 similar gastruloids measured for each stain. Maximum intensity projections are shown. Scale bar = 50 µm. (C) Validation of iPcdh19 cell line. Images represents at least 5 similar cell clusters in each condition. Maximum intensity projections are shown, scale bar = 10 µm. (D) Schematic of contact angle assay to measure differential interfacial tension between mESC spheroids. (E) iPcdh19 spheroids show dox-dependent increases in interfacial tension with either wildtype or iCdh1 spheroids (n=77 constructs analyzed). For all bar graphs, error bars indicate mean +/− standard deviation. Statistical comparisons via two-sided t-Test. Asterisks *, **, ***, **** indicate p≤0.05, p≤0.01, p≤0.001, p≤0.0001 respectively. Here, p-values (left-to-right): p=0.51, p=0.010, p=5.5×10⁻⁶, p=7.4×10⁻⁴ (F) Illustration of mosaic spheroid assay to test sufficiency of cadherin expression to drive cell-sorting. Spheroids were aggregated from n=200 cells, comprising 100 cells each from two cell lines with different fluorescent labels. (G) Representative images of mosaic spheroids after 24 hours of aggregation. Medial slices are shown to highlight radial structure. Images represent 17 and 25 spheroids measured with and without doxycycline, respectively. Scale bar = 50 µm. (H) Quantification of radial polarization as a measure of cell sorting reveals that iPcdh19 cells show doxycycline-dependent sorting from both wildtype and iCdh1 cells. (n = 153 spheroids analyzed). p-values (left-to-right): p=0.88, p=0.058, 2.2×10⁻⁷, p=5.5×10⁻⁶, p=0.00074. (I) Testing for influence of iPcdh19 induction on gastruloid symmetry breaking. Clonal spheroids were aggregated for 48 h, fused and then CHIR-stimulated from 48–72 haa, and imaged at 93 haa. (J) Representative images of fused wildtype/iPcdh19 gastruloids at 93 haa. Maximum intensity projections are shown. Scale bar = 50 µm. (n = 58 gastruloids analyzed, see Table S3) (K) Quantification of aspect ratio in gastruloid demonstrates doxycycline-dependent elongation in wildtype+iPCdh19 fusion constructs. p-values (left-to-right): p=0.66, p=0.00033. (L) Doxycycline dependent alignment of the Brachyury polarization and fusion vectors in wildtype+iPCdh19 fusion constructs.
Figure 7:
Figure 7:. Early heterogeneity in TGFb signaling modulates the duration of Wnt signaling to define anterior and posterior tissue domains.
(A) Illustration of hypothesis: heterogeneity in Wnt states at t = 96 haa may arise from earlier heterogeneity in other morphogen signaling pathways (Fig. 1A–B). (B) Gastruloids show spontaneous signaling activity in both the Nodal and BMP pathways at t = 48 haa. Images represent 7 similar Nodal reporter gastruloids and 11 similar BMP reporter gastruloids. Maximum intensity projections are shown, Scale bar = 100 µm. (C) Early Nodal or BMP activity was recorded immediately prior to the stimulation of Wnt activity with CHIR (3 h recording window from t = 45–48 haa; 200 ng/mL dox). Representative images of final distribution (tf = 120 h) of Nodal/BMP recorded cells. Images represent 10 Nodal recorder gastruloids, and 12 BMP reporter gastruloids. Maximum intensity projections are shown. Scale bar = 200 µm. (D) Quantification Nodal- and BMP-recorded cells in C Shaded regions indicate mean +/− standard deviation. (E-F) Treatment with exogenous Activin A modulates the proportions Wnt ‘on’ and ‘off’ signaling states at t = 96 haa (n = 3 pooled biological replicates per condition, each replicate comprising at least 60 pooled gastruloids). (G) Representative images of gastruloids in which Wnt activity was recorded at t = 96–97.5 h and imaged at t = 120 h, with and without Activin A pretreatment from t = 24 to 72 haa (n = 42 gastruloids total measured). Maximum intensity projections are shown, Scale bar = 200 µm. (H) Quantification of Wnt recording patterns demonstrates that Activin A pretreatment expands the Wnt-inactive anterior region (n = 42 gastruloids measured). Shaded regions indicate standard deviation as a function of A-P position. See also ED Fig. 10A–B) (I) Illustration of proposed model of gastruloid symmetry breaking. Early Nodal/BMP activity modulates the later response of cells to a uniform CHIR stimulus, yielding a heterogenous Wnt pattern. The heterogeneity then sorts to form a single pole of Wnt activity that defines the anterior-posterior axis and drives subsequent axial elongation.

Update of

References

    1. Bardot ES & Hadjantonakis A-K Mouse gastrulation: coordination of tissue patterning, specification and diversification of cell fate. Mech Dev 163, 103617 (2020). - PMC - PubMed
    1. Gregor T, Wieschaus EF, McGregor AP, Bialek W & Tank DW Stability and Nuclear Dynamics of the Bicoid Morphogen Gradient. Cell 130, 141–152 (2007). - PMC - PubMed
    1. Lord ND, Carte AN, Abitua PB & Schier AF The pattern of nodal morphogen signaling is shaped by co-receptor expression. eLife 10, e54894 (2021). - PMC - PubMed
    1. Turner DA et al. Anteroposterior polarity and elongation in the absence of extra-embryonic tissues and of spatially localised signalling in gastruloids: mammalian embryonic organoids. Development 144, 3894–3906 (2017). - PMC - PubMed
    1. Beccari L et al. Multi-axial self-organization properties of mouse embryonic stem cells into gastruloids. Nature 562, 272–276 (2018). - PubMed

Methods-only References

    1. Thielicke W & Sonntag R Particle Image Velocimetry for MATLAB: Accuracy and enhanced algorithms in PIVlab. Journal of Open Research Software 9, (2021).

LinkOut - more resources