. 2024 Oct;634(8036):1150-1159.
doi: 10.1038/s41586-024-07972-2. Epub 2024 Oct 2.

CRISPR-Cas9 screens reveal regulators of ageing in neural stem cells

Affiliations

CRISPR-Cas9 screens reveal regulators of ageing in neural stem cells

Tyson J Ruetz et al. Nature. 2024 Oct.

Abstract

Ageing impairs the ability of neural stem cells (NSCs) to transition from quiescence to proliferation in the adult mammalian brain. Functional decline of NSCs results in the decreased production of new neurons and defective regeneration following injury during ageing1-4. Several genetic interventions have been found to ameliorate old brain function5-8, but systematic functional testing of genes in old NSCs-and more generally in old cells-has not been done. Here we develop in vitro and in vivo high-throughput CRISPR-Cas9 screening platforms to systematically uncover gene knockouts that boost NSC activation in old mice. Our genome-wide screens in primary cultures of young and old NSCs uncovered more than 300 gene knockouts that specifically restore the activation of old NSCs. The top gene knockouts are involved in cilium organization and glucose import. We also establish a scalable CRISPR-Cas9 screening platform in vivo, which identified 24 gene knockouts that boost NSC activation and the production of new neurons in old brains. Notably, the knockout of Slc2a4, which encodes the GLUT4 glucose transporter, is a top intervention that improves the function of old NSCs. Glucose uptake increases in NSCs during ageing, and transient glucose starvation restores the ability of old NSCs to activate. Thus, an increase in glucose uptake may contribute to the decline in NSC activation with age. Our work provides scalable platforms to systematically identify genetic interventions that boost the function of old NSCs, including in vivo, with important implications for countering regenerative decline during ageing.


Conflict of interest statement

T.J.R. is a co-founder of ReneuBio. M.C.B. has outside interest in DEM Biopharma and Stylus Medicine. A.B. is a member of the scientific advisory board of Calico.

Figures

Fig. 1
Fig. 1. A genome-wide screen identifies 300 gene knockouts that boost old NSC activation.
a, Screen design. Three independent genome-wide screens used primary NSC cultures, each from six pooled young (3–4 months old) or six pooled old (18–21 months old) Cas9 mice (three males, three females). b, Example Ki67 FACS of NSCs from young and old Cas9 mice. c, Quantification (FACS) of NSC activation efficiency at day 4. Mean ± s.e.m. of Ki67+ cell percentage (normalized to young) for n = 6 (young) and n = 10 (old) NSC cultures, each from six pooled Cas9 mice (three males, three females), over three experiments. Each dot represents one NSC culture. Two-tailed Mann–Whitney test. d, PCA of gene scores of each screen (day 14). e, NSC activation efficiency quantification (FACS). Mean ± s.e.m. of percentage of Ki67+ cells for n = 4 (young control), n = 4 (old control), n = 4 (old top 10) NSC cultures, each from six pooled Cas9 mice (three males, three females), over two experiments. Each dot represents one NSC culture. Control, 100 control sgRNAs; top 10, sgRNAs targeting the top 10 genes from screens 1 and 2 (day 4 or 14, FDR < 0.1). Two tailed Mann–Whitney test. NS, not significant. f,g, Example results (screen 2) for young (f) and old NSCs (g) at day 4, showing gene scores as a function of effect size. Each dot represents one gene. Coloured dots indicate top gene knockouts (FDR < 0.1 in at least two out of three screens, day 4 or day 14) that boost (purple) or impede (green) NSC activation in an age-dependent manner or boost activation regardless of age (grey). h, Heatmap showing gene scores for top gene knockouts that boost young or old NSC activation. i, Venn diagram of gene knockouts that boost young or old NSC activation in at least two out of three screens (FDR < 0.1). j, Quantification of old NSC activation efficiency (FACS) (individual validation). Mean ± s.e.m. of percentage of Ki67+ cells (normalized to control) for n = 8 NSC cultures (each condition), each from two pooled old Cas9 mice (one male and one female), over two experiments. Each dot represents one NSC culture. Top 10 genes, 5 sgRNAs per gene. Two-tailed Wilcoxon signed rank test. P values in source data. km, Selected GO terms associated with genes knockouts that boost young (k), young and old (l) or old (m) NSC activation in at least two out of three screens (FDR < 0.1) using EnrichR. One-sided Fisher’s exact test. Source Data
Fig. 2
Fig. 2. In vivo screening platform for rapid testing of gene knockout effects on NSC activation.
a, In vivo screen platform in old mice. Old (20–22 months) Cas9 mice were injected with lentivirus expressing sgRNAs into the lateral ventricles (in proximity to the SVZ NSC niche). Five weeks after injection, genomic DNA was collected from the olfactory bulb (OB), and sgRNAs were sequenced to determine enrichment or depletion. b, Immunofluorescence images of SVZ niche sections from old (21 months) Cas9 mice, 48 h after injection of lentiviruses expressing mCherry and 100 control sgRNAs. One experiment. mCherry (lentivirus-infected cells, red), GFAP (NSCs and astrocytes, magenta), Ki67 (proliferative cells, green), DAPI (nuclei, blue). Right, high-magnification images. Scale bars, 100 µm (left); 10 µm (right). c,d, Normalized sgRNA counts of the top 10 gene pool (50 sgRNAs) and control (100 sgRNAs) libraries in various brain regions, 1 day (c) or 5 weeks (d) after virus injection. Top 10 gene pool, gene knockouts that boosted old NSC activation in in vitro screens 1 and 2. sgRNA counts were normalized to total counts between brain regions to account for sequencing depth variance. e, CasTLE gene scores for 50 gene knockouts tested in groups of 10 in old (19–22 months) female Cas9 mice, analysing for enrichment or depletion in the OB. Each sgRNA library of 10 genes was injected into n = 4 old Cas9 mice, n = 1 mouse for 1 day after injection SVZ sequencing of starting sgRNA pool, and n = 3 mice for 5 weeks after injection sequencing of OB sgRNAs. OB sgRNA enrichment computed with CasTLE and comparing with the 24-h SVZ sequenced sample. Mean ± s.e.m. of CasTLE score in n = 3 mice. Each dot represents the gene score from one mouse. Asterisks indicate gene hits with a 95% confidence interval that did not contain 0 by CasTLE analysis. Colour indicates screen number. f,g, Relative enrichment and frequency of each sgRNA targeting Slc2a4 (purple), Vmn1r107 (green) or control (grey) sgRNA pool in the OB. Hashed line: CasTLE-computed relative enrichment effect size for sgRNAs of interest relative to control sgRNA pool. Vertical dashed lines indicate relative enrichment of the five sgRNAs targeting Slc2a4 or Vmn1r107.
Fig. 3
Fig. 3. Slc2a4 knockout in the SVZ NSC niche boosts neurogenesis in old mice.
a,b, Immunofluorescence images of SVZ niche sections from old (21 months) female (a) or OB sections from old (22 months) male (b) Cas9 mice 5 weeks after injection of lentivirus expressing Scl2a4 sgRNAs into the lateral ventricles (LVs). One experiment. mCherry (lentivirus-infected cells, red), GLUT4 (green), DAPI (blue). Dashed rectangles highlight examples of mCherry-infected cells. Insets, zoomed-in images. c,d, Quantification of GLUT4 mean fluorescence intensity in the SVZ (c) and the OB (d). Mean ± s.e.m. of GLUT4 fluorescence intensity for n = 285 mCherry and n = 285 mCherry+GFAP+ cells (c) and n = 1,333 mCherry and n = 897 mCherry+ cells (d) in 1 old (22 month) Cas9 male mouse injected with Slc2a4 sgRNAs. Each dot represents one cell. Two-tailed Mann–Whitney test. e,f, z stack confocal (e) and immunofluorescence (f) images of OB sections from old (20 months) male Cas9 mice 5 weeks after injection of lentivirus expressing control or Slc2a4 sgRNAs into the LVs. Mice were injected with EdU once per week for 4 weeks, starting 1 week after virus injection. One experiment. e, NeuN (mature neurons, green), mCherry (lentivirus-infected cells, red), GFAP (astrocytes, blue), Dcx (neuroblasts, magenta). Arrowheads indicate lentivirus-infected NeuN+ cells. z stack positions indicated on the bottom right. f, EdU (newborn cells, green), mCherry (lentivirus-infected cells, magenta), NeuN (mature neurons, red), DAPI (blue). Arrows indicate lentivirus-infected NeuN+ cells. Right, zoomed-in images. g, Newborn neuron quantification in the OB. Mean ± s.e.m. of newborn neurons (NeuN+mCherry+EdU+) average number over total EdU+ cell number from 3 OB sections (normalized to control) for n = 6 (control), n = 6 (Slc2a4), n = 3 (Vnm1r107) old (18–21 months) male Cas9 mice, over 3 experiments. Each dot represents one mouse. Two-tailed Mann–Whitney test. h, Immunofluorescence images of SVZ sections from old (21 months) male Cas9 mice 5 weeks after injection of lentivirus expressing Slc2a4 sgRNAs into the LVs. One experiment. Ki67 (green), GFAP (magenta), S100a6 (red), DAPI (blue). qNSCs (qN; GFAP+S100a6+Ki67), aNSCs (aN; GFAP+S00a6+Ki67+), neuroblasts (Nb; GFAPKi67+), astrocytes (As; GFAP+S100a6). i, Quantification of qNSC, aNSC, neuroblast and astrocyte number in the SVZ. Mean ± s.e.m. of average cell number from about 8 SVZ sections for n = 8 (control) and n = 8 (Slc2a4) old (18–21 months) male Cas9 mice, over 3 experiments. Each dot represents one mouse. Two-tailed Mann–Whitney test. j, Immunofluorescence images of GLUT4 levels in SVZ sections from young (3–4 months) and old (18–21 months) male Cas9 mice. One experiment. GLUT4 (red), Ki67 (green), GFAP (magenta), DAPI (blue). qNSC and astrocytes (GFAP+Ki67), aNSCs (GFAP+Ki67+), neuroblasts (GFAPKi67+), other cells (GFAPKi67). Right, zoomed-in images. k, Quantification of GLUT4 mean fluorescence intensity in the SVZ niche. Cell types as in j. Mean ± s.e.m. of GLUT4 mean fluorescence intensity for n = 7 (young) and n = 7 (old) male Cas9 mice, over 2 experiments. Each dot represents one mouse. Two tailed Mann–Whitney test. Scale bars, 50 µm (a,b,e,f (middle and right), j) or 100 µm (f (left), h). Source Data
Fig. 4
Fig. 4. Old NSCs exhibit high glucose uptake that can be targeted to improve activation.
a, Glucose uptake pathway. b, Heatmap plotting glucose and insulin pathway median gene scores from genome-wide in vitro screens (day 4). Gene knockouts that boost (green) or impede (red) NSC activation. c, Immunofluorescence image of GLUT4 staining in cultured qNSCs and aNSCs from young (3–4 months) and old (18–21 months) Cas9 mice (mixed sex). GLUT4 (red), DAPI (blue). One experiment. Scale bar, 10 µm. d,e, Quantification of GLUT4 (d) and STX4A (e) mean fluorescence. Mean ± s.e.m. of mean fluorescence for n = 4 (young qNSCs, old qNSCs, young aNSCs) and n = 3 (old aNSCs) cultures, each from six pooled Cas9 mice (three males, three females). One experiment. Each dot represents one NSC culture. Two-tailed Mann–Whitney test. f, Schematic (top) and quantification (bottom) of bioluminescent glucose uptake in primary qNSCs and aNSCs from young and old mice. Mean ± s.e.m. of results for n = 6 (young qNSCs, aNSCs) and n = 8 (old qNSCs, aNSCs) cultures, each from six pooled Cas9 mice (three males, three females), over two experiments. Each dot represents one NSC culture. Two-tailed Mann–Whitney test. g, ECAR and OCR in qNSCs from young and old mice. qNSCs infected with control or Slc2a4 sgRNAs lentiviruses. ECAR, mean ± s.d. of results for n = 16 (young and old, control), n = 12 (young, Slc2a4) and n = 15 (young, Slc2a4) NSC cultures, each from two pooled mice (one male, one female), over two experiments. OCR, mean ± s.d. of results for n = 9 (young, control), n = 15 (young and old, Slc2a4) and n = 12 (old, control) NSC cultures, each from two pooled Cas9 mice (one male, one female), over two experiments. Each dot represents one NSC culture. One-tailed Wilcoxon signed-rank test (within age groups), one-tailed Mann–Whitney test (across age groups). h, Schematic (top) and quantification (bottom) of bioluminescent glucose uptake in primary qNSC cultures from old mice. qNSCs infected with Slc2a4 or control sgRNAs lentiviruses, or uninfected, were assessed for glucose uptake at day 4 or day 8. Mean ± s.d. of results for n = 3 (uninfected), n = 4 (day 4) and n = 5 (day 8) NSC cultures, each from six pooled Cas9 mice (three males, three females), over two experiments. Each dot represents one NSC culture. Two-tailed Mann–Whitney test. i, Schematic (top) and quantification (bottom) of NSC activation efficiency for young and old qNSCs (FACS). qNSCs infected with control or Slc2a4 sgRNAs lentiviruses were placed in quiescence medium with (grey) or without (pink) glucose for 2 days, then in activation medium (with glucose) for 4 days. Mean ± s.d. of Ki67+ cell percentage for n = 6 NSC cultures (each condition), each from six pooled Cas9 mice (three males, three females), over two experiments. Each dot represents one NSC culture. Two-tailed Mann–Whitney test. P values in source data. j, Summary of gene knockout interventions that boost old NSC activation in both in vitro and in vivo screens. The models in a and j were created using BioRender (https://biorender.com). Source Data
Extended Data Fig. 1
Extended Data Fig. 1. Genome-wide screen quality control.
a, b, Normalized count matrices of all sgRNA counts across samples at Day 4 (a) or Day 14 (b). c, Growth curves with number of cells at each passage (p3-p12) for primary cultures of NSCs from young (3-4 months) and old (18–21 months) mice used for the genome-wide screens. Dots represent cell counts for the sample at each passage (x106). Dotted line at 1.4×10⁹ represents the required number of cells for each biological replicate. d-f, Pairwise comparison of CasTLE scores across young screen samples at Day 14. Correlation plots between Screen 1 and Screen 2, Screen 2 and Screen 3; Screen 1 and Screen 3. Spearman ρ is indicated. g-i, Principal Component Analysis (PCA) performed on all gene scores of the three independent screens at Day 4 (g,h) and Day 14 (i): Young 1, 2, 3 (blue) and Old 1, 2, 3 (red), with Principal Components 1 vs. 2 (g) and Principal Components 3 vs. 4 (h,i). j,k, Volcano plots of example screen results (screen 1) at Day 14 for young (j) or old NSCs (k), showing gene scores as a function of effect size. Each dot represents one gene. Labelled dots are top ranking gene knockouts in at least 2 of the 3 independent screens (FDR < 0.1). Selecting genes that intersect screen 1 (day 4 or 14) with screen 2 (day 4 or 14) that boost NSC activation (purple, corresponding to enriched sgRNAs) or impede NSC activation (green, corresponding to depleted sgRNAs) in an age-dependent manner or gene knockouts that boost activation regardless of age (grey, corresponding to enriched sgRNAs). See Supplementary Table 1 for complete list of gene scores. l, Comparison of significantly depleted genes (FDR < 0.1) in genome-wide screen (Day 14) and essential genes identified from Online GEne Essentiality database (OGEE). m, Comparison of significantly depleted genes (FDR < 0.1) in genome-wide screen (Day 14) and essential genes identified from Core Essential Genes 2 (CEG2). n, Validation of gene knockout efficiency at the genomic level. qNSCs were infected with lentivirus expressing sgRNAs targeting individual genes (5 sgRNAs per gene) and genomic DNA was extracted. Percentage of knockout was quantified by sequencing PCR products followed by DECODRv3.0. Top: Experiment 1. Dot plot of the percentage of knockout for n = 2 independent primary NSC cultures, each derived from 2 mice (one young, one old). Connecting line indicates range. Bottom: Experiment 2. Dot plot of the percentage of knockout for n = 1 independent primary NSC culture derived from 1 mouse (young). Each dot represents the percentage knockout for one sgRNA. #: knockout detected by DECODRv3.0, but with low confidence (r2 < 0.6) (see Source Data). No data point: knockout not detected by DECODRv3.0 (see Source Data). Dotted red line: sum of knockout percentages for high confidence and detected knockouts. See Extended Data Fig. 6h–m for genomic knockout examples and knockout efficiency by western blot and FACS for Slc2a4 (GLUT4). Source Data
Extended Data Fig. 2
Extended Data Fig. 2. Example top sgRNAs counts from gene knockouts enriched or depleted in genome-wide screens and Gene Ontology analysis of gene knockouts that impede activation.
a-c, Histograms plotting the relative enrichment and frequency of each sgRNA targeting a gene of interest or the control sgRNA pool (control), comparing the starting sgRNA plasmid library to the screen result. Enriched sgRNAs (purple) and depleted sgRNAs (green). Hashed line indicates the CasTLE computed enrichment effect size for sgRNA targeting the gene of interest and control sgRNA pool. Colored dashes above the x-axis represent each of the sgRNAs targeting the gene of interest and their relative enrichment. d, Venn diagram of all gene knockouts that impede NSC activation in at least 2 of the 3 independent screens (FDR < 0. 1). Selecting genes that intersect screen 1 (Day 4 or 14) with screen 2 (Day 4 or 14) in young (blue) or old NSCs (red). e-g, Gene Ontology (GO) terms associated with gene knockouts that impede young (e) NSC activation, impede activation regardless of age (f), or impede activation of old (g) NSCs. For complete list of GO terms, see Supplementary Table 2. Gene sets selected based on FDR < 0.1 in at least 2 of the 3 independent screens. GO terms assessed using EnrichR focusing on the “cell component”, “molecular function” and “biological process” libraries. P-value calculated by EnrichR using a one-sided Fisher’s exact test.
Extended Data Fig. 3
Extended Data Fig. 3. Efficiency of in vivo lentiviral injection and knockout.
a, Immunofluorescence images of sections of the lateral ventricles and subventricular zones (SVZs), olfactory bulb (OB), midbrain hippocampus and hindbrain cerebellum regions of old (22 months old) female Cas9 mice, 1 week after injection of lentivirus expressing mCherry reporter and sgRNAs. One experiment; representative of 3 independent experiments. mCherry reporter (lentivirus-infected cells, red) and cell nuclei (DAPI, blue). b, Immunofluorescence images of sections of mCherry expression in the olfactory bulb of old (21 months old) female Cas9 mice, 5 weeks after injection of lentivirus expressing mCherry reporter and sgRNAs. One experiment; representative of 3 independent experiments. mCherry reporter (lentivirus-infected cells, red) and cell nuclei (DAPI, blue). c, Zoomed-in immunofluorescence images of sections of olfactory bulb from old (22 months old) female Cas9 mice, 5 weeks after injection of lentivirus expressing sgRNA targeting the EGFP reporter present in Cas9 mice directly into the lateral ventricles. Mice were injected with EdU once per week, starting one week after virus injection, for 4 weeks. mCherry reporter (lentivirus-infected cells, red), EGFP reporter (present in Cas9 mice, green), EdU (newborn cells, magenta) and cell nuclei (DAPI, blue). One experiment; quantification in d. d, Quantification of EGFP mean fluorescent intensity in non-infected (mCherry) and infected (mCherry+) newborn cells (EdU+) in the olfactory bulb, 5 weeks after injection of lentivirus to express sgRNA targeting EGFP into the lateral ventricle. Mean +/−SEM of EGFP fluorescence intensity in EdU+ cells for n = 354 mCherry cells and n = 69 mCherry+ cells from 1 old (22 month) female mouse. Each dot represents one cell. P-value: two-tailed Mann-Whitney test. Source Data
Extended Data Fig. 4
Extended Data Fig. 4. In vivo screen quality control, wild-type controls, example genes, young mouse screen.
a, b, Normalized count matrices of all sgRNA counts across samples at 24 h (a) or 5 weeks (b) post virus injection. c, Olfactory bulb sgRNA enrichment CasTLE analysis results showing gene scores of the Top 10 gene pool, 5 weeks after injection of lentivirus expressing sgRNAs targeted to these genes directly into the lateral ventricles of wild-type (WT) old (20-21 months old) male mice. Gene scores were computed by comparing the olfactory bulb sgRNA counts 5-week post injection and the SVZ sgRNA counts from an independent mouse sequenced 24 h after injection. Each dot represents gene score from an independent mouse. *: gene hits with a 95% confidence interval that did not contain 0 as computed by CasTLE analysis, in at least one of the 2 independent mice. d-g, Histograms plotting the relative enrichment and frequency of each sgRNA targeting a gene of interest or the control sgRNA pool, comparing the starting sgRNA library in the SVZ at 24 h post infection to the olfactory bulb sgRNA counts at 5 weeks post injection. Example top ranked genes. Hashed line indicates the CasTLE computed enrichment effect size for targeted gene and control pool. Colored dashes above the x-axis represent each of the sgRNAs targeting the gene of interest and their relative enrichment. h, CasTLE gene scores for 10 gene knockouts (depleted in young/old in vitro screens) in young (3 months old) female Cas9 mice olfactory bulbs. The library of 10 genes was injected into 1 young Cas9 mouse, which was left for 5 weeks and then the olfactory bulb sgRNAs were sequenced. Olfactory bulb sgRNA enrichment was computed with CasTLE by comparison to the 24-hour SVZ sequenced sample. Dot plot showing mean of CasTLE score in 1 mouse. Each dot represents gene score from one mouse. *: gene hits with a 95% confidence interval that did not contain 0 as computed by CasTLE analysis. i, Comparison between “Published NSC regulators” hits in in vitro and in vivo screens. Mean +/-SD of gene scores for our 3 in vitro screens were plotted for 10 genes among “Published NSC regulators” hits. Each dot represents gene score for one screen. P-values: two-tailed Mann-Whitney test. Bold: gene knockouts that were similar in vitro and in vivo screens. See also Supplementary Table 3.
Extended Data Fig. 5
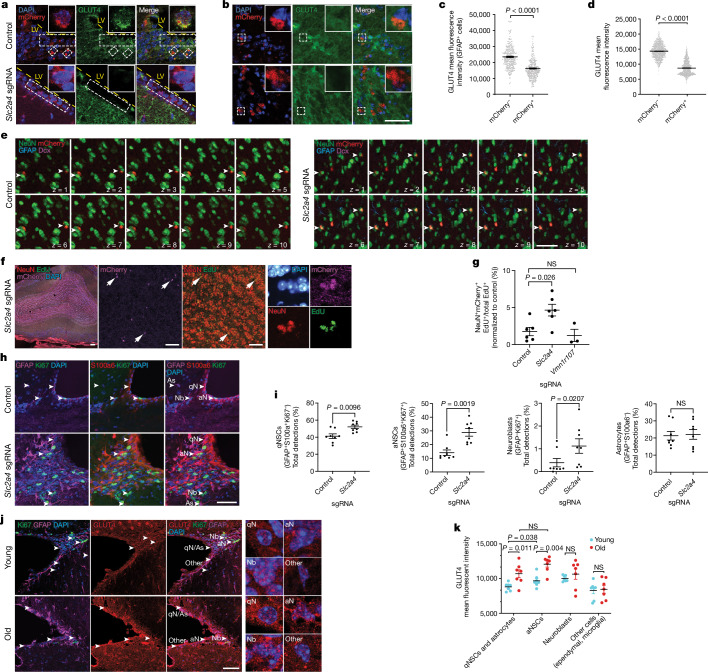
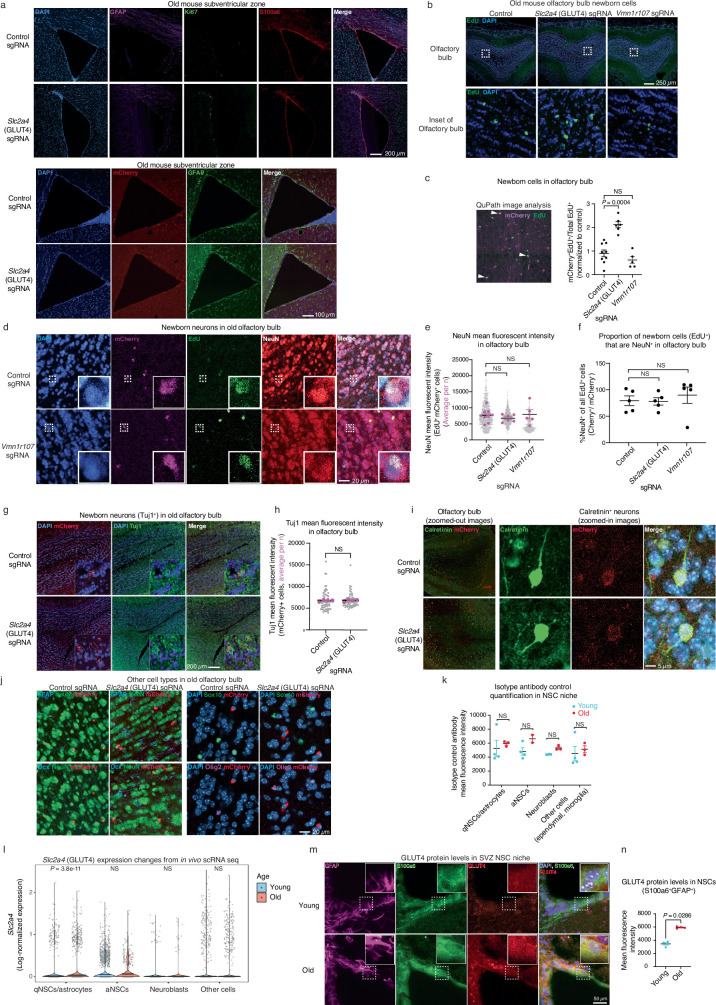
Extended Data Fig. 5. GLUT4 knockout efficiency in vivo, proportion of newborn cells that become neurons, other cell types in the olfactory bulb, and GLUT4 expression with aging.
a, Top panel: immunofluorescence images of SVZ sections from old (22 months old) female Cas9 mice, 5 weeks after injection with lentivirus expressing Slc2a4 (GLUT4) sgRNAs directly into the lateral ventricles. One experiment; representative of 3 independent experiments. DAPI (nuclei, blue), GFAP (qNSCs/astrocytes, magenta), Ki67 (proliferative cells, green), S100a6 (NSCs, red), merge image. Bottom panel: immunofluorescent images of sections of the SVZ from the same mice as in top panel. DAPI (nuclei, blue), mCherry (lentivirus-infected cells, red), and GFAP (qNSCs/astrocytes, green). b, Immunofluorescence images of olfactory bulb (OB) sections from old (~20 months old) male Cas9 mice, 5 weeks after injection of lentivirus expressing control (unannotated genomic regions), Slc2a4 (GLUT4) or Vmn1r107 sgRNAs directly into the lateral ventricles. One experiment; representative of 3 independent experiments. Mice were injected with EdU once per week, starting one week after virus injection, for 4 weeks. EdU (newborn cells, green) and nuclei (DAPI, blue). Zoomed-out images with the dashed white squares representing the insets (top) and zoomed-in images as insets (bottom). c, Example image of mCherry (lentivirus-infected cells, magenta) and EdU (newborn cells, green) staining (left panel) and QuPath image quantification of the average number of EdU+ and mCherry+ cells in the olfactory bulbs, normalized to total EdU+ cells (right panel) in old Cas9 mice (18–23 months old) (right panel). Mean +/- SEM of the average number of cell counts for one mouse, from 3 serial sections taken at 100 µm intervals across the olfactory bulb pair (normalized to average of control), for n = 9 old mice (4 males, 5 females, 20–23 months) for control sgRNAs, n = 6 old mice (3 males, 3 females, 20 – 23 months) for Slc2a4 (GLUT4) sgRNAs, and n = 5 old Cas9 mice (3 males, 2 females, 18–22 months) for Vmn1r107 sgRNAs, over 3 independent experiments. Each dot represents one mouse. P-values: two-tailed Mann-Whitney test. d, Immunofluorescence images of olfactory bulb sections from old (20 months) male Cas9 mouse, 5 weeks after injection of lentivirus expressing control (unannotated genomic regions) or Vmn1r107 sgRNAs directly into the lateral ventricles. One experiment; representative of 3 independent experiments. Mice were injected with EdU once per week, starting one week after virus injection, for 4 weeks. EdU (newborn cells, green), mCherry (lentivirus-infected cells, magenta), NeuN (mature neurons, red), and DAPI (nuclei, blue). Dashed white squares: NeuN+ cells that are infected with lentivirus (expressing one of the sgRNAs). Insets: zoomed-in images. e, QuPath image quantification of NeuN mean fluorescent intensity in infected (mCherry+) newborn cells (EdU+) in the olfactory bulb of old Cas9 mice (18–23 months old) (mix of males and females, see Source Data), 5 weeks after injection of lentivirus expressing control (unannotated genomic regions), Slc2a4 (GLUT4), or Vmn1r107 sgRNAs directly into the lateral ventricles. Mice were injected with EdU once per week, starting one week after virus injection, for 4 weeks. Mean +/- SEM of the average NeuN fluorescence intensity of all enumerated cells in one mouse, from 3 serial sections taken at 100 µm intervals across the olfactory bulb pair, for n = 9 old Cas9 mice (4 males, 5 females, 20–23 months) for control sgRNAs, n = 6 old Cas9 mice (3 males, 3 females, 20–23 months) for Slc2a4 (GLUT4) sgRNAs, and n = 5 old Cas9 mice (3 males, 2 females, 18–22 months) for Vmn1r107 sgRNAs, over 3 independent experiments. Each lavender dot represents one mouse. P-values: two tailed Mann-Whitney test. Each grey dot represents a single cell NeuN fluorescence intensity, showing all cells across all samples for each respective treatment. f, Image quantification of the percentage of newborn cells (EdU+) that are also NeuN+, comparing cells with (mCherry+) or without (mCherry), in control, Slc2a4, or Vmn1r107 sgRNA expression conditions. Mean +/− SEM of the average (%NeuN+) of all cell quantifications from a single mouse for n = 5 old Cas9 mice for each condition, over 3 independent experiments. Each dot represents one mouse. P-values: two-tailed Mann-Whitney test. g, Immunofluorescence images of olfactory bulb sections from old (20 months old) male Cas9 mouse, 5 weeks after injection of lentivirus expressing Slc2a4 (GLUT4) sgRNAs directly into the lateral ventricles. Mice were injected with EdU once per week, starting one week after virus injection, for 4 weeks. mCherry (lentivirus-infected cells, red), Tuj1 (neuron marker, green), and DAPI (nuclei, blue). Insets and white ovals: Tuj1+ cells that are infected with lentivirus (expressing one of the sgRNAs targeting Slc2a4 (GLUT4)). One experiment; representative of 2 independent experiments. h, QuPath image quantification of Tuj1 mean fluorescent intensity in infected (mCherry+) newborn cells (EdU+) in the olfactory bulb of old Cas9 mice (18–21 months old) (mix of males and females), 5 weeks after injection of lentivirus expressing control (unannotated genomic regions), or Slc2a4 (GLUT4) sgRNAs directly into the lateral ventricles. Mean +/− SEM of the average Tuj1 fluorescence intensity of all enumerated cells in one mouse, sections taken at 100 µm intervals across the olfactory bulb pair for n = 4 old Cas9 mice for each condition, over 2 independent experiments. Each lavender dot represents one mouse. P-values: two tailed Mann-Whitney test. Each grey dot represents a single cell Tuj1 fluorescence intensity, showing all cells across all samples for each respective treatment. i, Immunofluorescence images of olfactory bulb sections from old (20 months old) male Cas9 mouse, 5 weeks after injection of lentivirus expressing Slc2a4 (GLUT4) sgRNAs directly into the lateral ventricles. One experiment. Mice were injected with EdU once per week, starting one week after virus injection, for 4 weeks. mCherry (lentivirus-infected cells, red), Calretinin (mature neuron marker, green), and DAPI (nuclei, blue). j, Immunofluorescence images of olfactory bulb sections from old (20 months old) male Cas9 mouse, 5 weeks after injection of lentivirus expressing Slc2a4 (GLUT4) sgRNAs directly into the lateral ventricles. Mice were injected with EdU once per week, starting one week after virus injection, for 4 weeks. Left panels: mCherry (lentivirus-infected cells, red), GFAP (astrocytes, blue, top panels), Dcx (immature neuroblast, blue, bottom panels), NeuN (neurons, green). Right panels: mCherry (lentivirus-infected cells, red), DAPI (nuclei, blue), Sox10 (oligodendrocytes, green, top panels), Olig2 (oligodendrocytes, magenta, lower panels). Note that images are the exact same in the top and lower panels to show the different channels, except for the Slc2a4 (GLUT4) sgRNA condition for Dcx (lower panel), as there were no Dcx+ cells (which are very rare) in the same image. One experiment. k, QuPath image quantification of the mean fluorescence intensity with an isotype antibody control (mouse IgG) in sections from the SVZ neural stem cell niche from 4 young (3-4 months old) and 3 old (18–21 months old) male Cas9 mice (control for Fig. 3k). Cell types were identified as follows: qNSC/astrocyte (GFAP+Ki67), aNSC (GFAP+Ki67+), Neuroblast (GFAPKi67+) and other cells (ependymal, microglia; GFAPKi67). Mean +/− SEM of control average fluorescent intensities of each cell type, as identified above, from each mouse, for n = 4 (young qNSCs/astrocytes, young aNSCs, young other cells), n = 3 (young neuroblasts, old qNSCs/astrocytes, old neuroblasts, old other cells), or n = 2 (old aNSCs) Cas9 mice, over 2 experiments. Each dot represents one mouse. P-values determined by two tailed Mann-Whitney test. l, Violin plots comparing the log-normalized expression of Slc2a4 (GLUT4) transcripts between young (blue) and old (red) in single cell RNA-seq of qNSCs/astrocytes, aNSCs, neuroblasts, and all other cells from the neurogenic niche. P-values determined by two-sided two-sample Welch’s t-test. m, Representative immunofluorescence images of coronal sections of the SVZ neural stem cell niche from young (3-4 months old) and old (18–21 months old) male Cas9 mice. GLUT4 (red), S100a6 (NSC marker, green), GFAP (NSC and astrocyte marker, magenta), and DAPI (nuclei, blue). Dotted squares: regions with NSCs shown in the insets. Insets: zoomed-in images. n, QuPath image quantification of the mean fluorescence intensity of the GLUT4 antibody in S100a6+/GFAP+ cells quantified from sections of the SVZ neural stem cell niche. Mean +/− SEM of the average fluorescent intensities of cells from one mouse, for n = 4 young (3-4 months old) and n = 4 old (18–21 months old) male Cas9 mice, over 2 independent experiments. Each dot represents a mouse. P-values: two tailed Mann-Whitney test. Source Data
Extended Data Fig. 6
Extended Data Fig. 6. Glucose transporter expression during aging, STX4A immunofluorescence in vitro and in vivo, Slc2a4 (GLUT4) knockout efficiency and effects of Slc2a4 (GLUT4) knockout on qNSC activation in the context of glucose restriction.
a, Bar plots showing the log2 fold change in average expression of various Slc2 transcripts expressed in qNSCs/astrocytes from young and old mice in single cell RNA-seq data, where log2 fold changes greater than 0 indicate higher expression in cells of old animals than in young animals. b, Immunofluorescence image of STX4A in primary NSC cultures from young (3-4 months old) or old (18–21 months old) mice. NSCs were plated in quiescence NSC media (qNSCs) for 7 days prior to imaging, and NSCs were plated in activated NSC media (aNSCs) 2 days prior to imaging. STX4A (green) and DAPI (nuclei, blue). One experiment; quantification in Fig. 4e. c, Representative immunofluorescence images of coronal sections from SVZ NSC niche sections from young (3-4 months old) and old (18–21 months old) Cas9 mice. Ki67 (proliferation maker, green), GFAP (NSC and astrocyte marker, magenta), DAPI (nuclei, blue), and STX4A (red). Cell types were identified as follows: qNSC/astrocytes (GFAP+Ki67), aNSCs (GFAP+Ki67+), Neuroblasts (GFAPKi67+), and other cells (ependymal, microglia; GFAPKi67). d, QuPath image quantification of STX4A mean fluorescence in cells of the neural stem cell niche. Cell types were identified as follows: qNSC/astrocyte (GFAP+Ki67), aNSC (GFAP+Ki67+), Neuroblast (GFAPKi67+) and other cells (ependymal, microglia; GFAPKi67). Mean +/− SEM of STX4A mean fluorescence intensity for n = 4 young (~4 months) and n = 4 old (~19 months) Cas9 mice, over 2 independent experiments. Each dot represents one mouse. P-values: two tailed Mann-Whitney test. e, Expression of Scl2a4 (GLUT4) transcripts in young (6–8 weeks old) qNSCs and aNSCs in culture from a published RNA-seq dataset. Mean +/− SD from n = 4 qNSC and aNSC cultures. P-values: two-tailed Mann-Whitney test. f, FACS-based glucose uptake assay with 2NBDG (2-(N-(7-Nitrobenz-2-oxa-1,3-diazol-4-yl)Amino)-2-Deoxyglucose) (Sigma, 72987) on primary NSC cultures (qNSCs and aNSCs) from young (3-4-months-old) or old (18–21-months-old) mice. Mean +/− SEM of FACS results from n = 4 (young and old qNSCs, young aNSCs) and n = 3 (old aNSCs) independent NSC cultures, each from a pool of 6 Cas9 mice, 3 males and 3 females. Each dot represents one independent NSC culture. P-values: two-tailed Mann-Whitney test. g, Violin plots showing the log-normalized expression of all genes in the fatty acid oxidation gene signature across young and old qNSC/astrocyte cells in single cell RNA-seq data. P-value: two-sample Welch’s t-test. h, Top panel: scheme of the Slc2a4 (GLUT4) locus with the location of sgRNAs 1–5. Bottom panel: genomic sequences for Slc2a4 (GLUT4) sgRNAs 1–5 from DECODRv3.0 analysis tool indicating the sgRNA target as well as cut site and indel distribution. i, Guide sequences used for Slc2a4 (GLUT4) sgRNAs 1–5 and the DECODRv3.0 knockout percentage for each sgRNA. j, GLUT4 knockout efficiency in young (3-4 months) qNSC culture by western blot. Western blot analysis of GLUT4 levels in qNSCs infected with control sgRNA (targeting unannotated regions of the genome) or sgRNA targeting Slc2a4 (GLUT4), 10 days after infection by lentivirus and 3 days of selection with puromycin. β-actin is used as a loading control. Data from n = 1 (control sgRNAs) and n = 1 (Slc2a4 (GLUT4) sgRNAs) NSC culture, each derived from one young Cas9 mouse. The western blot was repeated 3 times with similar results. For western blot source data, see Supplementary Fig. 1e. k, Quantification of western blot: GLUT4 intensity, normalized to β-actin intensity. l, GLUT4 knockout efficiency in primary qNSC cultures by FACS. Intracellular FACS analysis of GLUT4 levels in fixed qNSCs treated with control sgRNA or sgRNA targeting Slc2a4 (GLUT4), 10 days after lentivirus infection to express sgRNA. No antibody control panel is on the left. Plots show mCherry+ gated cells, GLUT4 fluorescence. m, Quantification of FACS data, normalized to control. n, Data from Fig. 4i, presented as the boost in qNSC activation ability with Slc2a4 (GLUT4) knockout, with or without glucose starvation. Mean +/− SEM of NSC activation ability of Slc2a4 (GLUT4) knockout relative to control, for n = 6 young (3-4 months) or n = 6 old (18–21 months) independent NSC cultures, each derived from a pool of 6 Cas9 mice (3 males, 3 females), over 2 experiments. Each dot represents one independent NSC culture. P-values: two-tailed Mann-Whitney test. o, Quantification of NSC activation efficiency in cultured NSC from young (3-4 months old) or old (18–21 months old) mice 4 days after transition to aNSC media, as assessed by Ki67 intracellular FACS analysis. NSCs were placed in qNSC media for 4 days. Then the cell media was replaced with qNSC media with or without 2-Deoxy-D-glucose (2-DG) (2 mM) for 48 h, at which point the media was replaced with aNSC media and the cells were allowed to activate for 4 days prior to intracellular FACS analysis with Ki67. Mean +/− SEM of the percentage of Ki67+ cells for n = 4 (young) or n = 4 (old) independent NSC cultures, each derived from a pool of 2 Cas9 mice (1 male, 1 female). Each dot represents one independent NSC culture. P-values: two-tailed Mann-Whitney test. Source Data

References

    1. Gage, F. H. & Temple, S. Neural stem cells: generating and regenerating the brain. Neuron80, 588–601 (2013). - PubMed
    1. Silva-Vargas, V., Crouch, E. E. & Doetsch, F. Adult neural stem cells and their niche: a dynamic duo during homeostasis, regeneration, and aging. Curr. Opin. Neurobiol.23, 935–942 (2013). - PubMed
    1. Navarro Negredo, P., Yeo, R. W. & Brunet, A. Aging and rejuvenation of neural stem cells and their niches. Cell Stem Cell27, 202–223 (2020). - PMC - PubMed
    1. Bond, A. M., Ming, G. L. & Song, H. Adult mammalian neural stem cells and neurogenesis: five decades later. Cell Stem Cell17, 385–395 (2015). - PMC - PubMed
    1. Yousef, H. et al. Age-associated increase in BMP signaling inhibits hippocampal neurogenesis. Stem Cells33, 1577–1588 (2015). - PMC - PubMed

MeSH terms