. 2024 Oct;634(8035):929-935.
doi: 10.1038/s41586-024-07952-6. Epub 2024 Oct 2.

Tuft cells act as regenerative stem cells in the human intestine

Affiliations

Tuft cells act as regenerative stem cells in the human intestine

Lulu Huang et al. Nature. 2024 Oct.

Abstract

In mice, intestinal tuft cells have been described as a long-lived, postmitotic cell type. Two distinct subsets have been identified: tuft-1 and tuft-2 (ref. 1). By combining analysis of primary human intestinal resection material and intestinal organoids, we identify four distinct human tuft cell states, two of which overlap with their murine counterparts. We show that tuft cell development depends on the presence of Wnt ligands, and that tuft cell numbers rapidly increase on interleukin-4 (IL-4) and IL-13 exposure, as reported previously in mice2-4. This occurs through proliferation of pre-existing tuft cells, rather than through increased de novo generation from stem cells. Indeed, proliferative tuft cells occur in vivo both in fetal and in adult human intestine. Single mature proliferating tuft cells can form organoids that contain all intestinal epithelial cell types. Unlike stem and progenitor cells, human tuft cells survive irradiation damage and retain the ability to generate all other epithelial cell types. Accordingly, organoids engineered to lack tuft cells fail to recover from radiation-induced damage. Thus, tuft cells represent a damage-induced reserve intestinal stem cell pool in humans.


Conflict of interest statement

H.C. is the head of Pharma Research and Early Development at Roche, Basel and holds several patents related to organoids technology. His full disclosure is availble at www.uu.nl/staff/JCClevers/Additional. The other authors declare no competing interests.

Figures

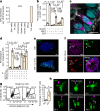
Fig. 1
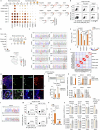
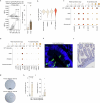
Fig. 1. Wnt and IL-4 drive tuft cell differentiation and proliferation.
a, AVIL expression in a scRNA-seq dataset of human adult small intestinal tissue. n = 15,184 single epithelial cells. b, Flow cytometric quantification of the AVIL-Clover+ cell percentage of DAPI cells cultured in differentiation regimens. Each dot is a well. n = 3 wells per condition. Results are representative of three independent experiments (Supplementary Fig. 1b). c, Differentiated human ileum AVIL-Clover organoids counterstained with phalloidin (F-actin). Three independent experiments were performed on two donors with similar results. d, Flow cytometric quantification of AVIL+ cell frequency in AVIL-Clover reporter organoids, differentiated with indicated recombinant proteins. Values are normalized to human tuft cell differentiation medium levels. Each dot represents one well. n = 4 wells per condition. Results are representative of four individual donors (Supplementary Fig. 1c). e, Fluorescence images of AVIL-Clover organoids differentiated with or without IL-4/IL-13. n = 3 independent experiments. f, Costaining of AVIL, Ki67 and phalloidin in human ileum tissue. n = 3 donors (Extended Data Fig. 2k). Arrows and dashed lines indicate cells showing AVIL-Ki67 overlap. g, Representative flow cytometry (left) and quantification (right) of the S/G2/M fraction in KIT or KIT+ cells in ileum FUCCI reporter organoids differentiated with IL-4/IL-13. Each dot is a well. n = 4 wells per condition (pooled from three independent experiments). h, Live-cell imaging snapshots of continuous divisions of AVIL+ cells in AVIL-Clover organoids differentiated with IL-4/IL-13 (Supplementary Video 4). n = 2 donors (Extended Data Fig. 3m and Supplementary Video 5). a,b,d,g, Data are presented as mean values (a) or as mean values ± standard error (b,d,g). b,d,g, P values are derived from false discovery rate (FDR)-adjusted one-tailed Student’s t-test against the base or diff medium (b,d) or two-tailed Student’s t-test (g). Scale bars, 10 µm (c,f,h), 50 µm (e). TA cells, transit-amplifying cells; R1, R-spondin1 conditioned medium; Diff, human tuft cell differentiation medium. Source Data
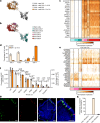
Fig. 2
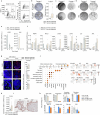
Fig. 2. IL-4 signalling shifts the balance in tuft cell states.
a,b, MetaCell 2D projection of 953 ileum organoid-derived single cells. Cells are coloured by their gating and medium condition (a) or by annotation to cell subsets (b). c, Gene-expression profiles of tuft cell-specific core genes shared by all tuft cell clusters across epithelial subsets. ac, n = 953 single cells. d, Distribution of the four tuft cell states in ileum-derived organoids with or without IL-4/IL-13. e, Gene-expression profiles of tuft cell state-specific genes. d,e, n = 573 single tuft cells. f, Flow cytometry quantification of AVIL+ cell frequency in organoid mutant lines of selected transcription factors (homozygous knock-outs). Organoids were differentiated for 11 days (or 6 days with IL-4/IL-13). Each dot is one well. n = 11 (WT Diff), 6 (SOX9−/− Diff), 4 (SPIB−/−/HOXB8−/−/POU2F3−/− Diff + IL-4/13) and 3 (rest) wells. Results are representative of three independent experiments (Supplementary Fig. 2a). P values are derived from FDR-adjusted two-tailed Student’s t-test against the WT levels. g,h, Representative fluorescence image (g) and quantification (h) of AVIL-Clover organoids costained for POU2F3. g, n = 3 donors (Supplementary Fig. 2b and Supplementary Videos 6–8). Scale bars, 40 µm. h, n = 993 positive cells from 17 organoids pooled from three donors. d,f,h, Data are presented as binomial estimation of the mean ± 95% confidence intervals (d) or as mean values ± standard error (f,h). Source Data
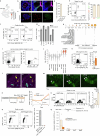
Fig. 3
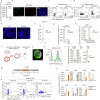
Fig. 3. Single tuft cells give rise to organoids containing all epithelial lineages.
a, Organoid outgrowth of single S/G2/M-phase KIT and KIT+ cells sorted from ileum FUCCI reporter organoids, cultured in standard human intestinal expansion medium. n = 3 independent experiments. b,c, MetaCell 2D projection of 10,311 single cells isolated from passage 1 KIT or KIT+ cell-derived organoids, differentiated with or without IL-4/IL-13. Cells are coloured by cell-type annotation (b) or by medium condition and organoid founder cell (c). d, AVIL lineage-tracing strategy in human organoids. e, Images of AVIL lineage-tracing organoids, derived from sorted AVIL-tdT+iRFP+ cells (as in Extended Data Fig. 7m,n, day 0). f, Representative images of intestinal epithelial lineages markers in differentiated traced organoids. e,f, n = 3 independent experiments with similar results. Scale bars, 100 µm (a,e), 20 µm (f). tdTom, tdTomato.
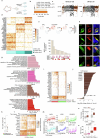
Fig. 4
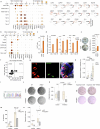
Fig. 4. IL-4 signalling enhances the regenerative response in tuft cells.
a, Area of organoids cultured in human intestinal expansion medium following passaging at different time points. Shown is one of three independent experiments; n = 51 (d0 WT), 50 (d0 KO), 47 (d3 WT), 51 (d3 KO), 35 (d5 WT) and 50 (d5 KO) individual organoids. b, Schematic (top) of experimental set-up and quantification (bottom) of organoid numbers after mechanical damage. Each dot is a well. n = 4 wells per condition. Results are representative of three independent experiments on two donors (Supplementary Fig. 4a). cf, Schematic (c), representative images (d), quantification of organoid numbers (e) and organoid areas (f) from organoids following irradiation and passaging. Experiments were performed on three donors (Supplementary Fig. 4b–d). e, Each dot is one well. n = 8 wells per condition. f, n = 17 organoids per condition. gi, Schematic (g), representative images (h) and quantification (i) of AVIL lineage-tracing organoids after irradiation. i, Results are pooled from three independent experiments, n = 68 (day 1) or 76 (day 9) organoids. a,f,i, Boxplots show data from the 25th to 75th percentiles and whiskers extending to the minimum and maximum within 1.5× inter-quartile range, with dots marking outliers. b,e, Data are presented as mean values ± standard error. a,b,e,f,i, P values are derived from two-tailed Student’s t-test (a,f,i) or two-tailed Mann–Whitney test (b,e). Scale bars, 2 mm (d) and 20 µm (h). a.u., arbitrary units. Source Data
Extended Data Fig. 1
Extended Data Fig. 1. Flow cytometry gating strategies and quantifications of AVIL+ cells.
a, Representative images of AVIL expression in human adult intestinal tissues. n = 3 donors. b, Schematics of generating human AVIL-Clover reporter intestinal organoids and Sanger sequencing results. n = 4 donors (Supplementary Fig. 1a). c, Schematics of the experimental set-up for Fig. 1b and (d)–(f). Organoids were cultured in standard human intestinal expansion medium for 4 days, then exposed to various differentiation regimens. d, Gating strategy for flow cytometric analysis and sorting of AVIL-Clover reporter organoids. e, Flow cytometric plots of the percentage of AVIL-Clover+ cells out of DAPI- cells, n = 3 independent experiments (Supplementary Fig. 1b). f, Quantification of DAPI- live cells in ileum organoids. Each dot is a well. n = 3 wells per condition. Results are representative of 3 independent experiments (Supplementary Fig. 1d). g, Fluorescence images of AVIL-Clover reporter activity with AVIL antibody staining. n = 4 donors with similar results. h, Phalloidin staining in differentiated human small intestinal AVIL-Clover organoids. 3 independent experiments were performed on 2 donors with similar results. i, Transmission electron microscopy of tuft cells in differentiated human small intestinal organoids. n = 2 donors (Supplementary Fig. 1e). j, qPCR quantification of tuft cell genes in sorted AVIL+ and AVIL cells from differentiated AVIL-Clover reporter organoids. Each dot is one donor, n = 3 donors. k, GNAT3 expression in a single-cell RNA sequencing dataset of human adult small intestinal tissue. n = 15,184 single epithelial cells. l, Quantification of GNAT3 and AVIL co-staining in ileum and colon organoids (see Extended Data Fig. 2m for a representative image). n = 260 cells from 15 organoids derived from 2 organoid lines. m-n, Representative images (m) and quantification (n) of AVIL and GNAT3 co-staining in human ileum tissue. Yellow line marks one crypt-villus axis, arrows and magenta contours mark AVIL+ cells. Each dot is a donor. n = 4 donors. a,g,h,i,m, Scale bar 5 µm (h-i), 20 µm (a,g), 50 µm (m). f,j,k,l,n, Data are presented as mean values +/− standard error (f,j,l,n) or as mean values (k). f,j, P values are derived from one-tailed Student’s t-test against the base medium (f) or two-tailed Student’s t-test (j). TA cells: Transit-Amplifying Cells; EEC: Enteroendocrine cells; R1: R-spondin1 conditioned medium. Schematics in b were created using BioRender (J. van Es BioRender.com/h49r743; 2024). Source Data
Extended Data Fig. 2
Extended Data Fig. 2. Tuft cell expansion in different conditions.
a-b, Flow cytometric analysis (a) and quantification (b) of the percentage of AVIL+ cells in human ileum AVIL-Clover reporter organoids differentiated in tuft cell medium without Noggin, with or without of BMP2/BMP4. Each dot is one well. n = 4 wells per condition. Results are representative of 3 independent experiments on 2 donors (Supplementary Fig. 1f). c-d, Histogram of AVIL+ (c) and GNAT3+ (d) cell numbers on the crypt-villus axis in human ileum tissue. n = 4 donors (Supplementary Fig. 1g). c, n = 23 crypt-villus axes from one donor. d, n = 34 crypt-villus axes pooled from four donors. e, Expression of selected cytokine receptors across the scRNA-seq dataset in Fig. 1a. Dot color relates to size-normalized mean expression values and dot size to fraction of expressing cells. n = 15,184 single epithelial cells. f, Representative flow cytometric plots of AVIL-Clover reporter organoids differentiated for 4 days in tuft cell medium with indicated recombinant proteins. n = 4 donors (Supplementary Fig. 1c). g, Quantification of AVIL+ cell frequency in human small intestinal AVIL-Clover organoids differentiated with IL-4/IL-13 and with or without EGF. Each dot is one well. n = 5 wells, pooled from 3 donors. h-i, Images (h) and quantification (i) of AVIL+ cell clusters in IL-4 and IL-13 treated organoids. Dashed ellipses indicate clusters of AVIL+ cells, (Supplementary Fig. 1h). n = 988 AVIL+ cells (30 organoids) pooled from 2 donors. j-k, AVIL, KI67 co-staining in human intestine organoids (j) or in ileum tissues (k). Arrows and dashed lines indicate cells with AVIL and KI67 overlap. j Organoids were differentiated with IL-4/IL-13. n = 3 organoid lines derived from 2 donors (Supplementary Fig. 1i, Supplementary Video 1). k, n = 3 donors. l, Quantification of (k). Values indicate AVIL+KI67+ cell percentage out of the AVIL+ or KI67+ cells. Each dot is a pool of at least 10 crypts, n = 1,908 cells in 323 crypts from 3 donors. m-n, Multiplexed staining of KI67 with AVIL and GNAT3 in organoids (m) and ileal tissue (n). Dashed white lines mark triple positive cells. m, n = 2 donors; n, Dashed yellow line demarcates a crypt. n = 4 donors. o, Quantification of (n). Each dot is a donor, n = 248 tuft cells from 4 donors. h,j,k,m,n, Scale bar 40 µm (h,j), 10 µm (k,m,n). b,g,l,o, Data are presented as mean values +/− standard error. b-d,g, P values are derived from two-tailed Student’s t-test (b,g), or two-tailed Fisher’s exact test (c,d). Diff: tuft cell differentiation medium. Source Data
Extended Data Fig. 3
Extended Data Fig. 3. Proliferation dynamics of tuft cells.
a, Log-normalized expression of KIT, projected on a Metacell 2D representation of scRNA-seq data of primary human adult small intestine. n = 15,184 single epithelial cells. b, Co-staining of KIT and Phalloidin in human colon tissue. Two independent experiments were performed on one donor with similar results. c-d, Representative image (c) and quantification (d) of KIT staining in AVIL-Clover organoids. n = 303 cells of 17 organoids from 2 donors. e, Representative flow cytometry (left) and quantification (right) of KIT (phycoerythrin, PE) labeled AVIL-Clover organoids differentiated in tuft cell medium with IL-4/IL-13. Each dot is one well, n = 24 wells pooled from 3 donors (Supplementary Fig. 1j). f-g, Representative flow cytometry (f) and quantification (g) of the KIT+ and AVIL+ cells in AVIL-Clover organoids triggered with the depicted cytokines for 48 h, followed by 6 days culturing in tuft cell differentiation medium with IL-4/IL-13. Each dot is a well. n = 2 wells per condition. Results are representative of 2 donors (Supplementary Fig. 1k). h, KIT expression across epithelial cell types in healthy, IBD non-inflamed, and IBD inflamed human colon tissue. Dot color relates to mean expression values and dot size to fraction of expressing cells. n = 4,428 cells. i, Gating strategy of sorting KIT+ cells from human primary intestine tissue. Adult colon is shown. j, Distribution of tuft cell gene expression signature across different epithelial populations from human adult intestine tissue, as well as within sorted populations of KIT+ cells from primary adult ileum and colon. Horizontal line indicates an optimal separation based on the unenriched intestine dataset. Percentage of classified tuft cells in KIT+ populations is indicated. The tuft cell signature is based on 222 core tuft cell genes shown in Fig. 2c. n = 311 ileal KIT+ cells, and 271 colon KIT+ cells. k, Representative flow cytometric analysis (left) and quantification (right) of the S/G2/M phase in KIT+ cells in FUCCI reporter organoids differentiated for 3 days in the indicated media. Each dot is one well. n = 8 (Diff) or 6 (Diff+IL-4/13) wells from 6 or 4 independent experiments. l-m, Snapshots of dividing AVIL+ cells by live-cell imaging in AVIL-Clover reporter organoids differentiated in tuft cell medium. l, Each dividing AVIL+ cell and its progeny are colored, 3 independent experiments were performed on 2 donors with similar results (Supplementary Video 3). m, Shown one tuft cell dividing twice within 24 h, 2 donors were examined with similar results (Supplementary Videos 4-5). n, Experimental design (left) and quantification (right) of the KI67+AVIL+ cells percentage at indicated time points., n = 800 (day 0), 631 (day 4, Base), 776 (day 4, Base+IL-4/13), 806 (day 7, Base+IL-4/13) AVIL+ cells. Results are pooled from 3 independent experiments on two organoid lines (Supplementary Fig. 1l). o, Representative flow cytometric analysis (left) and relative quantification (right) of KIT+ cells differentiated for 3 days in different regimens. Each dot is one well. n = 3 wells per condition, pooled from two experiments on FUCCI line (Supplementary Fig. 1m). p, Representative flow cytometric analysis (left) and quantification (right) of AVIL+ cell frequency in organoids differentiated for 2 days in EGF Noggin medium (without Wnt, R-spondin1 and DAPT), followed by 4 days culturing in indicated media. Each dot is a well, n = 7 wells per condition, pooled from 3 independent experiments on two lines from one donor. q, Experimental design (top) and qPCR quantification (bottom) of tuft cell and stem cell genes in sorted single cells from organoids cultured in human expansion medium. Each dot is a donor, n = 2 donors. b,c,l,m, Scale bar, 50 µm. d,e,g,k,n-q, Data are presented as mean values +/− standard error (d,e,k,n-p) or as mean values (g,q). k,n,o, P values are derived from two-tailed t-test. TA cells: Transit-Amplifying Cells; EEC: Enteroendocrine cells; Diff: tuft cell differentiation medium. Source Data
Extended Data Fig. 4
Extended Data Fig. 4. Analysis of single cell RNA sequence used in this study.
a, Schematic overview of the scRNA-seq experiment. b, Tuft cell frequency in different medium and gating combinations, as determined by scRNA-seq analysis. c, scRNA-seq statistics, depicting number of reads per cell (top) and number of unique molecular identifiers (UMI) per cell (bottom). Each dot is a cell, colored by its gating and medium conditions. Quality threshold of 500 UMI per cell is indicated by a horizontal line. d, Gene expression profiles of stem cell and goblet cells. n = 373 single non-tuft cells. e, Expression of tuft cell marker genes projected on the metacell 2D layout as in Fig. 2a,b. Dot color indicate log normalized expression. n = 953 single cells. f, Summary of number of up-regulated differentially expressed genes (DEG) across the tuft-1-4 states, when compared to non-tuft epithelium. g, Top 10 Gene ontology terms enriched in DEG of tuft-1-4, when compared to the non-tuft cells as in (f). Values represent -log10 P value. h, Staining of tuft-1-4 specific markers (red, as indicated) in human ileum AVIL-reporter organoids cultured in tuft cell differentiation medium (tuft 1-2) or supplemented with IL-4/IL-13 (tuft 3-4). n = 2 independent experiments on one donor with similar results. Scale bar, 5 µm. i, Gene expression profiles of primary KIT+ tuft cells from human ileum and colon tissue. Shown are tuft-3 genes, as well as KIT, POU2F3 and AVIL. Cells are colored by their tissue origin, and by classification into cycling cells (cc) or non-cycling cells (no-cc). n = 271 single colon and 311 single ileum KIT+ cells. j, Differential expression of all tuft-3 genes between 311 primary ileal cycling and non-cycling KIT+ cells as in i. Genes with significant differential expression (c2 test; FDR-adjusted P value < 10−3) are colored. k, Estimation of the fraction of proliferating tuft cells across human primary intestine tissues from two published scRNA-seq datasets,. Each dot is a donor, n = 1,240 single tuft cells from 14 human donor samples. Data are presented as mean values +/− standard error. l, Gene expression profiles of 541 primary KIT+ non-cycling (no-cc) tuft cells as in i. Shown are tuft-4 genes, as well as KIT, POU2F3 and AVIL. Cells are ordered by their expression of the aggregated tuft-4 program (top panel), and colored by their tissue origin. m, Expression patterns of six genes along the tuft-4 activation gradient in 213 KIT+ no-cc ileal cells. Shadings indicate 95% confidence in binomial estimation of the mean. Data was down-sampled to 1,000 UMI per cell. n, Aggregate expression of the tuft-4 program in cycling and non-cycling cells in colon and ileum. n = 582 single cells. o, Aggregate expression of the tuft-4 program across tuft cell substates in organoids as in Fig. 2e. n = 573 single tuft cells from organoids. n-o, Boxplots show data from the 25th–75th percentile and whiskers extending to the minimum and maximum within 1.5 × inter-quartile range, with dots marking outliers. P values are derived from two tailed Mann-Whitney test. Diff: tuft cell differentiation medium; cc: cell cycle. Schematic in a was created using BioRender (J. van Es BioRender.com/k22v672; 2024).
Extended Data Fig. 5
Extended Data Fig. 5. Transcription factor knock outs and overexpression in human ileum organoids.
a-b, Expression of selected genes encoding for transcription factors across the scRNA-seq dataset from organoids as in Fig. 2a (a), or from human healthy adult intestine tissue (b). Dot color relates to mean expression values and dot size to fraction of expressing cells. n = 953 cells (a) or n = 15,184 single epithelial cells (b). c, Genotypes of clonal transcriptional factor knock outs generated from human ileum AVIL-Clover reporter organoids. Homozygous knock outs of POU2F3, HOXB8, TCF7, SPIB, SOX9 and heterozygous knock outs of ZFHX3, RUNX1, PROX1 were generated using base editing (C to T) technology to induce stop codon (TAG, TAA) within exons. HMX2−/− and GFI1B−/− lines were generated by using conventional CRISPR-Cas9 method to induce frameshift. d, Representative flow cytometry quantification of AVIL+ cell frequency in POU2F3−/− and HMX2−/− organoids. Results are representative of 3 independent experiments with similar results (Supplementary Fig. 2a). e, Quantification of AVIL-Clover+ cell frequency in heterozygous knock out organoid lines by flow cytometry. Each dot is one well. n = 11 (WT Diff), or 3 (rest) wells. One of 3 independent experiments is shown (Supplementary Fig. 2c). WT Diff measurements are pooled from 4 experiments. f, Gene-pairwise Pearson correlation between markers of the main epithelial types across cells from primary intestinal tissue. Data were down-sampled to 1,000 UMI per cell. g-h, Co-staining of AVIL with KI67 and POU2F3 in organoids (g) and primary colon tissue (h). Dashed lines mark triple positive cells. (g) n = 2 donors; h, Two independent experiments were performed on one donor with similar results; Scale bar, 50 µm (g), 5 µm (h). i-k, i, Schematics of the experimental set-up for (j-k). j, Quantification of AVIL-Clover+ cell frequency in ATOH1-inducible organoids by flow cytometry. k, qPCR quantification of ATOH1 and intestinal epithelial lineage markers expression. j-k, Each dot is a well. n = 4 wells per condition. One of 2 (k) or 3 (j) independent experiments with similar results are shown (Supplementary Fig. 2d,e). l, Genotype of clonal ATOH1 knock outs generated from human ileum organoids. m-n, Representative flow cytometry plots (m) and quantification (n) of KIT+ cell frequency in ATOH1−/− organoids. Each dot is a well. n = 4 (WT), 8 (ATOH1−/− Diff), 9 (ATOH1−/− Diff+IL-4/13) wells, pooled from two ATOH1−/− clonal lines from one donor (Supplementary Fig. 2f). o, qPCR quantification of tuft-1-4 characteristic genes in KIT+ cells sorted from WT and ATOH1−/− organoids. Organoids were differentiated for 7 days in tuft cell differentiation medium with IL-4/IL-13. Each dot is a well. n = 3 wells pooled from two ATOH1−/− lines. i-o, Organoids were differentiated without DAPT. e,j,k,n,o, Data are presented as mean values +/− standard error. e,j,n,o, P values are derived from FDR-adjusted two-tailed Student’s t-test against the WT levels (e), or two-tailed Student’s t-test (j,n,o). Diff: human tuft cell differentiation medium; TA: Transit-Amplifying Cells; EEC: Enteroendocrine cells; WT: wildtype. Source Data
Extended Data Fig. 6
Extended Data Fig. 6. Human intestinal tuft cell derived organoids.
a, Gating strategy for organoid outgrowth from single S/G2/M phase tuft cell (KIT+) and non-tuft cell (KIT-) sorted from FUCCI reporter organoids differentiated in tuft cell medium with IL-4/IL-13. b, Representative images (left) and area quantification (right) of first passage organoids derived from (a). n = 47 individual organoids per condition, shown one of three independent experiments (Supplementary Fig. 3a). Boxplot show data from the 25th–75th percentile and whiskers extending to the minimum and maximum within 1.5 × inter-quartile range, with dots marking outliers. c-d, Organoid outgrowth from single AVIL and AVIL+ cells in AVIL-Clover reporter organoids (c), or from single KIT- and KIT+ cells from human adult duodenum tissue (d). c, n = 2 donors (Supplementary Fig. 3c). d, n = 3 donors (Supplementary Fig. 3b). e, qPCR quantification of LGR5 and AVIL expression in sorted AVIL- and AVIL+ cells at depicted time points following seeding. Each dot is one donor, n = 2 donors. a-e, sorted cells were cultured in human expansion medium. f, qPCR quantification of intestinal epithelial lineage markers in passage 1 organoids cultured in the depicted regimens. Each dot is one donor, n = 2 donors. g, Representative images (left) and quantification (right) of different intestinal epithelial cell types in AVIL and AVIL+ cell-derived organoids at passage 1. Each dot is an organoid. n = 6 (CHGA), 9 (MUC2), 7 (AVIL) organoids per group from one donor. 3 independent experiments were performed on 2 donors (Supplementary Fig. 3d). h-i, qPCR quantification (h) and visualization (i) of CHGA expression in organoids of passage 4 derived from KIT- and KIT+ cells as in (a). h, Each dot is a well. n = 3 wells per condition. 3 independent experiments were performed on two donors with similar results (Supplementary Fig. 3e). j, Expression of lineage markers across cell types as in Fig. 3b,c. Left: Dot color relates to mean expression values and dot size to fraction of expressing cells; right: dot color indicates log normalized expression. k, Distribution of cell type percentages across medium condition and founder cell. Data are presented as binomial estimation of the mean +/−95% confidence intervals. j-k, n = 10,311 single cells. b-d,g,i, Scale bar, 500 µm (b-d), 20 µm (g,i). e-g,h,k, Data are presented as mean values (e,f) or as mean values +/− standard error (g,h,k). b,g, P values are derived from two-tailed Student’s t-test. Diff: Tuft cell differentiation medium; EEC: Enteroendocrine cells. Source Data
Extended Data Fig. 7
Extended Data Fig. 7. Lineage tracing of human AVIL+ tuft cells.
a, qPCR quantification of CHGA expression in AVIL and AVIL+ cells sorted from AVIL-Clover reporter organoids. Each dot is a well. Results are pooled from 3 independent experiments on one donor. b, CHGA staining in AVIL-Clover reporter organoid. n = 3 independent experiments on the same donor with similar results. c-d, Flow cytometric analysis of AVIL and CHGB (c) or CHGA (d) in human ileum AVIL-P2A-tdtomato/CHGB-mNeon (c) and AVIL-P2A-tdtomato/CHGA-Clover (d) double reporter organoid lines. 3 independent experiments were performed with similar results. e-f, Representative images (e) and quantification (f) of CHGA+ cells in WT and POU2F3−/− organoids differentiated in tuft cell medium (Diff). Results are pooled from 2 independent experiments on the same donor, n = 76 (WT) and 46 (POU2F3−/−) individual organoids. Boxplot shows data from the 25th–75th percentile and whiskers extending to the minimum and maximum within 1.5 × inter-quartile range, with dots marking outliers. g, qPCR quantification of CHGA expression in WT and POU2F3−/− organoids differentiated in tuft cell differentiation medium with or without IL-4/IL-13. Each dot is a well. n = 3 wells per condition. Experiments were performed on two donors (Supplementary Fig. 3f). h, Same as (g), organoids were differentiated in either tuft cell or EEC differentiation medium. Each dot is an experiment, n = 3 independent experiments on the same donor. i-l, i, Schematics of experimental set-up for (j-l). Mosaic organoids, derived from POU2F3−/− and H2B-iRFP wildtype organoid lines, were differentiated for 7 days in tuft cell differentiation medium before sorting. j-k, Representative image (j) and flow cytometric plot (k) of mosaic organoids as in (i). l, qPCR analysis of enteroendocrine cell markers from sorted H2B-iRFP+ and iRFP- (POU2F3−/−) cells. j-k, 2 experiment with similar results. l, Each dot is a well. n = 4 wells pooled from 2 experiments. m-n, Schematics of experimental set-up (m) and flow cytometric plots (n) of AVIL lineage tracing organoids. Organoids were differentiated for 4 days in tuft cell medium with IL-4/IL-13, with or without exposure to 1 μM 4-Hydroxytamoxifen (4-OHT) for 20 h, then medium was changed to human intestinal expansion medium. 3 independent experiments were performed with similar results. o, qPCR quantification of intestinal epithelial lineage markers in the traced organoids derived from sorted single AVIL+iRFP+ cells (sorted at day 0 as in n). Each dot is an experiment. n = 3 independent experiments. b,e,j, Scale bar, 20 µm (j), 40 µm (b, e). a,g,h,l,o, Data are presented as mean values +/− standard error. a,f-h,l P values are derived from two-tailed Student’s t-test. Diff: Tuft cell differentiation medium; WT: wildtype. Schematics in i were created using BioRender (J. van Es BioRender.com/v54e687; 2024). Source Data
Extended Data Fig. 8
Extended Data Fig. 8. Regeneration potential of tuft cells following damage.
a-b, Gene-expression profiles of genes associated with adult and repair-induced stem cells in ileum organoids as in Fig. 2a (a), or in primary intestinal epithelial cells as in Fig. 1a (b). Dot color relates to mean expression values and dot size relates to fraction of expressing cells. a, right panel - dot color indicates log normalized expression. a, n = 953 cells; b, n = 15,184 single cells. c-d, Flow cytometric quantification of KIT+ cell frequency (c) and qPCR quantification of tuft cell genes (d) in DOX-triggered POU2F3 overexpression organoids differentiated in tuft cell medium. Each dot is a well. n = 4 (c), 2 (d) wells per condition. One of 2 (d) or 3 (c) independent experiments on the same donor with similar results are shown (Supplementary Fig. 4e,f). e, Representative image (left) and quantification of organoid area (right) from POU2F3 overexpression clonal organoids, with or without DOX inducement. Each dot is an individual organoid, n = 46 (DOX-) or 50 (DOX+) organoids. Experiments were performed on 2 donors (Supplementary Fig. 4g). f-g, Representative flow cytometric analysis (f) and fluorescence image (g) of AVIL-lineage tracing organoids after irradiation. 3 independent experiments were performed on the same donor with similar results. h, qPCR quantification of EREG expression in sorted AVIL and AVIL+ cells from human ileum organoids. Each dot is a well, n = 3 (Diff) or 4 (Diff+IL-4/13) biologically replicates. Results are pooled from 2 independent experiments (Supplementary Fig. 4h), i, Genotype of human ileum EREG knock out organoids. j-k, Images (j) and quantification of organoid area (k) from WT and EREG−/−organoids exposed to IL-4/13 after irradiation (as in Fig. 4c). k, Results are pooled from 2 independent experiments, n = 900 (WT control), 700 (EREG−/− control), 700 (WT irradiation) and 600 (EREG−/− irradiation) individual organoids. l-n, WT and POU2F3−/− organoids were differentiated for 7 days in tuft cell differentiation medium with IL-4/IL-13, passaged, then cultured for 7 days in human intestinal expansion medium by removal of EGF, with or without recombinant EREG (rEREG). Shown are representative images (l), quantification of organoid numbers (m), and organoid areas (n). Three independent experiments were performed on 2 donors (Supplementary Fig. 4i). m, Each dot is a well. n = 3 wells per condition. n, n = 40 (WT control), 20 (POU2F3−/− control), 40 (WT rEREG) and 40 (POU2F3−/− rEREG) individual organoids. e,g,j,l, Scale bar, 1 mm (e,j,l), 20 µm (g). c,d,h,m, Data are presented as mean values +/− standard error (c,h,m) or as mean values (d). e,k,n Boxplots show data from the 25th–75th percentile and whiskers extending to the minimum and maximum within 1.5 × inter-quartile range, with dots marking outliers. c,e,h,k,m,n, P values are derived from two-tailed Student’s t-test (c,e,h,k,n), or two-tailed Mann-Whitney test (m). Diff: human tuft cell differentiation medium; WT: wildtype; TA: Transit-Amplifying Cells; EEC: Enteroendocrine cell; DOX: doxycycline. Source Data
Extended Data Fig. 9
Extended Data Fig. 9. Analysis of human fetal intestinal tuft cells.
a, Representative flow cytometric plots (left) and quantification (right) of KIT+ cells frequency of human fetal and adult intestinal tissue. Single cells are pre-gated on DAPI- CD45- EPCAM+. Each dot is a donor. n = 5 (adult), 10 (fetal) donors. b, Distribution of a core tuft cell signature across human tuft cells from different development stages, as well as within a sorted population of fetal KIT+ cells. The tuft cell signature is as in Extended Data Fig. 3j. c-d, Expression of core tuft cells genes (c) and genes associated with regenerative stem cells (d) across human tuft cells from different development stages, as well as in a sorted population of fetal KIT+ cells. Dot color relates to mean expression values and dot size to fraction of expressing cells. b-d, n = 699 tuft cells, and 89 KIT+ fetal cells. e-f, Representative images of AVIL expression in histological sections of human fetal intestine tissue. n = 3 donors with similar results. g-i, Representative images (g) and quantifications of organoid numbers (i) and area (j) of organoids derived from single primary fetal (week 19–21) KIT+ and KIT- cells. One of three donors is shown (Supplementary Information Fig. 4j). h, Each dot is a well. n = 7 wells per condition. i, Each dot is an individual organoid. n = 2 (KIT-), 19 (KIT+) organoids. e,f,g, Scale bar: 10 µm (e), 50 µm (f), 500 µm (g).a,h,i, Data are presented as mean values +/− standard error. a,h, P values are derived from two-tailed Student’s t-test (a) or two-tailed Mann-Whitney test (h). Source Data

References

    1. Haber, A. L. et al. A single-cell survey of the small intestinal epithelium. Nature551, 333–339 (2017). - PMC - PubMed
    1. von Moltke, J., Ji, M., Liang, H. E. & Locksley, R. M. Tuft-cell-derived IL-25 regulates an intestinal ILC2-epithelial response circuit. Nature529, 221–225 (2016). - PMC - PubMed
    1. Gerbe, F. et al. Intestinal epithelial tuft cells initiate type 2 mucosal immunity to helminth parasites. Nature529, 226–230 (2016). - PMC - PubMed
    1. Howitt, M. R. et al. Tuft cells, taste-chemosensory cells, orchestrate parasite type 2 immunity in the gut. Science351, 1329–1333 (2016). - PMC - PubMed
    1. Barker, N. et al. Identification of stem cells in small intestine and colon by marker gene Lgr5. Nature449, 1003–1007 (2007). - PubMed

MeSH terms