. 2024 Oct;634(8036):1238-1244.
doi: 10.1038/s41586-024-08012-9. Epub 2024 Oct 2.

LYCHOS is a human hybrid of a plant-like PIN transporter and a GPCR

Affiliations

LYCHOS is a human hybrid of a plant-like PIN transporter and a GPCR

Charles Bayly-Jones et al. Nature. 2024 Oct.

Abstract

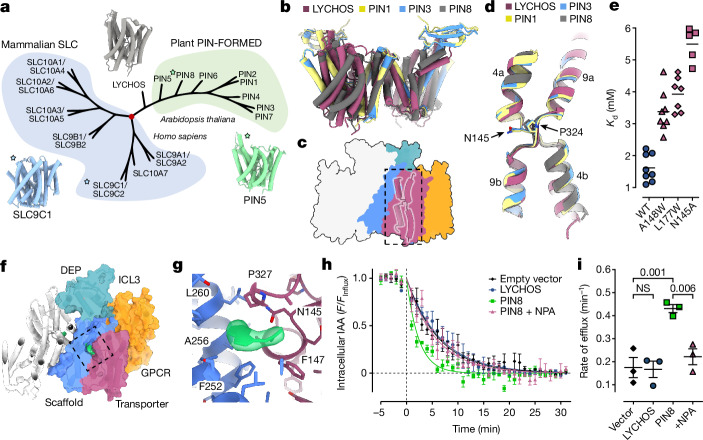
Lysosomes have crucial roles in regulating eukaryotic metabolism and cell growth by acting as signalling platforms to sense and respond to changes in nutrient and energy availability1. LYCHOS (GPR155) is a lysosomal transmembrane protein that functions as a cholesterol sensor, facilitating the cholesterol-dependent activation of the master protein kinase mechanistic target of rapamycin complex 1 (mTORC1)2. However, the structural basis of LYCHOS assembly and activity remains unclear. Here we determine several high-resolution cryo-electron microscopy structures of human LYCHOS, revealing a homodimeric transmembrane assembly of a transporter-like domain fused to a G-protein-coupled receptor (GPCR) domain. The class B2-like GPCR domain is captured in the apo state and packs against the surface of the transporter-like domain, providing an unusual example of a GPCR as a domain in a larger transmembrane assembly. Cholesterol sensing is mediated by a conserved cholesterol-binding motif, positioned between the GPCR and transporter domains. We reveal that the LYCHOS transporter-like domain is an orthologue of the plant PIN-FORMED (PIN) auxin transporter family, and has greater structural similarity to plant auxin transporters than to known human transporters. Activity assays support a model in which the LYCHOS transporter and GPCR domains coordinate to sense cholesterol and regulate mTORC1 activation.


Conflict of interest statement

The authors declare no competing interests.

Figures

Fig. 1
Fig. 1. Cryo-EM structure of the LYCHOS homodimer.
a, Schematic of LYCHOS domain layout. b, The 2.65 Å resolution cryo-EM density map of the LYCHOS homodimer in the membrane plane oriented with the cytoplasm at the top and the lysosomal lumen at the bottom. Orientation as previously determined. A second LYCHOS cryo-EM reconstruction in thinner ice was determined to a more uniform 2.75 Å resolution across the transmembrane domains, but density for the DEP domains was missing from the map (Extended Data Figs. 2 and 3 and Extended Data Table 1). c, Model of the LYCHOS homodimer oriented as in b, with the transporter scaffold region in blue, the transporter region in purple, the GPCR domain in orange and the DEP domain in green. d, Topology diagram of LYCHOS oriented as in b, with key domains and secondary structural elements highlighted. e,f, LYCHOS model (e) and cryo-EM density map (f) viewed from the lysosomal lumen.
Fig. 2
Fig. 2. The LYCHOS transporter domain is a human orthologue of plant PIN auxin transporters.
a, Phylogenetic analysis of the LYCHOS transporter domain. Models of selected transporters (stars) are shown for structural comparison. For detailed analyses, see Extended Data Fig. 6 and Extended Data Table 2. b, Structural alignment of the LYCHOS transporter domain with plant PIN1 (root mean square deviation (RMSD) 2.86 Å), PIN3 (RMSD 3.35 Å) and PIN8 (RMSD 3.57 Å) structures. c,d, The LYCHOS transporter domain crossover motif (c), aligned to the three plant PIN transporters (d). The conserved asparagine and proline residues are numbered as per LYCHOS. e, Surface plasmon resonance of IAA binding to LYCHOS wild type (WT) (n = 8) or after N145A (n = 5), A148W (n = 8) or L177W (n = 7) mutation (Extended Data Fig. 7a,h–j). Steady-state affinity fit assumes one-to-one binding. Symbols show n independent experimental replicates; bold line shows the mean. Kd, dissociation constant. f, The 2.40 Å resolution cryo-EM density map of the IAA-bound LYCHOS homodimer. IAA (cryo-EM density indicated in green) binds to LYCHOS in an inward-open state, reminiscent of the plant PIN efflux carriers bound to IAA or to NPA. g, Boxed region in f, highlighting conserved residues that coordinate IAA binding to the LYCHOS transporter channel. h, Time course of IAA efflux in HEK293 cells co-transfected with AuxSen, and empty vector, LYCHOS or PIN8. IAA efflux in PIN8-transfected cells was measured without or with 25 μM NPA. Mean ± s.e.m. of n = 3 independent biological replicates. i, Rate of efflux determined from h. Symbols show values from n = 3 independent biological replicates; the bold line shows the mean; error bars show s.e.m.; NS, not significant; P values determined using one-way ANOVA with Šidák’s multiple comparisons test (comparisons to empty vector) or unpaired two-sided t-test (comparison to +NPA). Source Data
Fig. 3
Fig. 3. Cholesterol binds at the interface of the transporter and GPCR domains.
a, The cholesterol pocket is occluded owing to π-stacking interactions made between a triad of phenylalanine residues (F352, F705 and F708) at the interface of the GPCR and transporter domains. Both wild-type and IAA-treated (closed state) LYCHOS are observed in this conformation. b, Opening of the phenylalanine gate was observed in IAA-treated (partially open state) LYCHOS. c, Focused view of the two cholesterol molecules packed within the cholesterol pocket of LYCHOS(F352A/W678R). Cryo-EM density is shown as transparent overlay. The cholesterol-binding pocket is defined by the GPCR (orange) and transporter (magenta) domains. For detailed analyses, see Extended Data Fig. 8. d, Top-down (cytoplasmic side) and end-on (membrane plane) views of the cholesterol-induced conformational change of the LYCHOS GPCR domain. Lateral movement of the whole GPCR domain is associated with CHS binding. Helices α16 and α17 must move to accommodate CHS entry. Three conformational states outline a possible mechanism of cholesterol binding to LYCHOS. e, In the closed state, Phe352 and Phe705 form a closed gate that occludes cholesterol entry into the binding groove. A CHS molecule can be seen queuing at the gate, unable to enter. f, IAA binding was associated with the partial opening of α10 and α17, whereby the gating phenylalanine residues rearrange but do not fully open. Rigid docking of CHS indicates that the pocket remains sterically occluded (Extended Data Fig. 9c–f). g, Mutagenesis of Phe352 completely bypasses the phenylalanine gate, thereby allowing CHS entry. This is accompanied by an opening of the GPCR domain relative to the transporter domain. A high degree of CHS occupancy was observed in the conserved CRAC-motif pocket.
Fig. 4
Fig. 4. The LYCHOS transporter domain coordinates a potential gating mechanism for cholesterol.
a,c,f,h, mTORC1 activity in response to cholesterol addition or depletion (dotted line) followed by repletion (arrow) in HEK293 cells co-transfected with LysoTORCAR and LYCHOS (a; n = 3), LYCHOS(F352A/W678R) (c; n = 3), f, LYCHOS(N145A) (f; n = 3) or LYCHOS(F352A/W678R/N145A) (h; n = 3). Mean ± s.e.m. of n independent biological replicates. b,d,g,i, Fold change in mTORC1 activity in response to cholesterol addition, depletion (average F/F0 at −5–0 min versus 35–40 min), or repletion (average F/F0 at 35–40 min versus 5 min average at peak after repletion) in HEK293 cells co-transfected with LYCHOS (b), LYCHOS(F352A/W678R) (d), LYCHOS(N145A) (g) or LYCHOS(F352A/W678R/N145A) (i). Symbols show n = 3 independent biological replicates; bold line shows the mean; error bars show s.e.m.; P values calculated by one-way ANOVA with Šidák’s multiple comparisons test (versus control) or two-sided paired t-test (depletion versus repletion). e,j, Control-subtracted area under the curve (AUC; 0–40 min). Symbols show n = 3 independent biological replicates; bold line shows the mean; error bars show s.e.m.; P values calculated by two-way ANOVA with Šidák’s multiple comparisons test. k, LYCHOS is oriented with the GPCR orthosteric binding pocket facing the lysosomal lumen, and DEP and ICL3 (LED) facing the cytoplasm. l, Silhouette of LYCHOS (side view) highlighting the two potential conformational positions of the PIN crossover motif during elevator transport. Inset, focused illustration of the conformational change associated with a transport cycle initiated by transport ligand interactions (PDB 7Y9V (ref. ), 7XXB (ref. ) and 7QPA (ref. )). Vertical elevator movement of the transporter domain displaces F352, uncoupling the conformational clamp and opening the Phe352 gate (Supplementary Discussion 4). m, Freely diffusing cholesterol in the lysosomal bilayer can enter the CRAC-motif pocket and bind to the open state of LYCHOS between the transporter and GPCR domains, signalling to mTORC1 through the GATOR1 complex. The highly dynamic conformational landscape of ICL3 might modulate this. CHL, cholesterol. Source Data
Extended Data Fig. 1
Extended Data Fig. 1. LYCHOS purification and characterization.
a, Size-exclusion chromatography (Superose 6 10/300; Cytiva) of recombinant LYCHOS. Elution volume is approximately 14.3 ml. The peak fraction is indicated with grey shading. b, Gradient SDS-polyacrylamide gel electrophoresis of recombinant purified LYCHOS. Representative of >10 independent purifications. c, Trypsin digest and MS/MS of purified recombinant LYCHOS. Sequence coverage (~75%) of experimentally detected peptides is highlighted (coloured according to Fig. 1b) with some larger peptides being undetected. d, Mass photometry frequency distribution of wild-type LYCHOS. e, The 2.75 Å resolution reconstruction of wild-type LYCHOS. A single subunit is coloured from N- to C-terminus (yellow to purple), and the symmetrically related subunit is shown in white. f, Pipes and planks representation of e with numbered transmembrane helices. Source Data
Extended Data Fig. 2
Extended Data Fig. 2. Cryo-EM analysis.
a, High-level overview of the image analysis pipeline including key parameters and analysis variables. b, Overview of representative 2D class averages, ab initio classification volumes, refinement mask and final reconstructed cryo-EM volumes.
Extended Data Fig. 3
Extended Data Fig. 3. Cryo-EM volumes and validation.
a, Raw and denoised cryo-EM micrograph of vitrified LYCHOS. Scale bar 100 nm. Representative of >50,000 micrographs. b, Two-dimensional class averages calculated using prior assigned Euler angles without additional alignments. Scale bar 100 Å. c, Selected regions of cryo-EM map and model agreement showing side-chain density (grey) and corresponding model (blue: scaffold, magenta: transporter, orange: GPCR). d, Per-voxel local resolution variation. All volumes are coloured by the same uniformly sampled (0.5 Å increments) resolution range (2.5 to 4.5 Å). e, Map-to-model (solid green), unmasked (grey dashed line), and noise-substituted corrected (solid purple) gold-standard half-map Fourier shell correlation plots. f, Polar plots of normalized angular distribution frequency for the final refined particle sets.
Extended Data Fig. 4
Extended Data Fig. 4. The LYCHOS GPCR domain is most closely related to class B2 adhesion GPCRs.
a, Multiple sequence alignment of the LYCHOS GPCR domain and its related homologues. Residues with high identity are shaded magenta. Here, for clarity, the loop sequences are omitted. b, Structural comparison of class B2 adhesion GPCRs and the LYCHOS GPCR domain (oriented by normal GPCR convention). Three related GPCR paralogues were identified by performing pBLAST against human GPCR sequences (GPCRdb), namely ADGRG4 (E-value 3.1 × 10⁻⁷), ADGRG6 (E-value 4.3 × 10⁻⁶), and ADGRC1 (E-value 9.1 × 10⁻⁵). No other significant matches were identified. c, Pipes and planks representation of the LYCHOS GPCR domain labelled with the overall structural helical numbering. The standard GPCR transmembrane numbering convention is included in parentheses. The LYCHOS GPCR domain has been resolved in the apo state in an apparently inactive conformation. d, View from the lysosomal lumen perpendicular to the membrane plane of the LYCHOS GPCR orthosteric ligand-binding site showing a superimposed cartoon of LYCHOS (orange) and ADGRG4 (white) (PDB: 7WUJ; RMSD 4.6 Å). ADGRG4 is in the active state, the tethered agonist binding footprint is shown in dark shading. See also Supplementary Discussion 1. e, Alignment of the cytoplasmic-facing LYCHOS G protein-binding pocket with the ADGRG1/2/4 active states reveals likely steric clashes between Gβ and the DEP domains and between Gα and LYCHOS α15/α16 (GPCR TM5/6). LYCHOS α15 (GPCR TM5) and α16 (GPCR TM6) are comparatively larger than TM5/6 of the adhesion GPCRs and extend beyond the membrane boundary to define the ICL3 (LED) region. f, LYCHOS α16 (GPCR TM6) and α17 (GPCR TM7) do not adopt the kinked conformation necessary to accommodate G protein binding. g, The glycine of the PXXG motif required to support the kinked TM6 conformation to enable G protein binding, is conserved in LYCHOS (LYCHOS α16, GPCR TM6). See also Supplementary Discussion 1.
Extended Data Fig. 5
Extended Data Fig. 5. LYCHOS scaffold and DEP domain interfaces.
a, Surface representation of the interface between LYCHOS scaffold domains coloured by per-residue conservation (ConSurf). Buried surface area (BSA) of 1410 Å2 indicated by the dotted line. b, Cartoon representation of a, key interface residues are labelled. The interface is predominantly hydrophobic with key conserved glycine residues that symmetrically arrange to form tight contact interfaces (Gly72, Gly247, Gly254). c,d, Surface representation (c) of the DEP domain interface, and cartoon representation (d). BSA of 469 Å2. Key residues are labelled that define a conserved hydrophobic core. Surface residues Tyr805, His758, Leu761, Trp789, Gly794 are conserved and define the DEP interface.
Extended Data Fig. 6
Extended Data Fig. 6. The LYCHOS scaffold and transporter domains are PIN orthologues.
a, Comparison of LYCHOS and superpositions of the Arabidopsis thaliana PIN transporters (PINs), H. sapiens SLC9 and SLC10 homologues and N. meningitdis ASBT homologue. The scaffold domain is divergent between LYCHOS and the SLC9 and SLC10 families with poor overall structural superposition. In contrast, the scaffold domain of PINs and LYCHOS is conserved. b, The transporter unit is structurally conserved between all families, each with a canonical crossover motif. Greatest similarity of LYCHOS is to the PIN transporter family. c, Simplified helical topology schematic for LYCHOS compared to the PIN, SLC9 and SLC10 families, and N. meningitidis ASBT. The overall topological arrangement and sequence of helices is conserved between LYCHOS and the PINs, while the SLC families achieve the same overall fold with a different arrangement. d, The overall Coulomb surface of LYCHOS and PIN8 is conserved. Surface representation coloured by electrostatic potential charge ( − 10 to 10 kT/e). e, Structural superposition of the conserved crossover motif between LYCHOS and PIN1, PIN3, and PIN8 (PDB 7Y9V, 7XXB, and 7QPA). The experimentally determined binding pose of IAA in the four structures is shown. The overall position of IAA is consistent and mediated by a key conserved asparagine (LYCHOS Asn145). f, Multiple sequence alignment of the crossover motif between LYCHOS, PINs, SLC9, and SLC10 families, and N. meningitidis ASBT. The conserved motif in LYCHOS is most closely related to the PINs. While the conserved motif is also present in the SLC families (including N. meningitidis ASBT), the conserved asparagine and proline are contributed by different helices owing to distinct topological arrangements (as shown in c). In LYCHOS and the PIN family, the conserved asparagine and proline are contributed by the first and second helices of the crossover motif (asparagine first, then proline). While the SLC9 and 10 families possesses the same conserved residues, the sequence order is inverted.
Extended Data Fig. 7
Extended Data Fig. 7. LYCHOS binds IAA but not tryptophan.
a, Surface plasmon resonance of IAA binding to wild-type LYCHOS (apparent Kd 1.62 mM, pKd 0.19 ± 0.04, n = 8), showing raw sensorgrams and concentration-response curves. Steady-state affinity fit assumes one-to-one binding. b, Superimposed sequence of electrogenic transient peak currents induced by wild-type LYCHOS embedded proteoliposomes upon injection of increasing concentrations of IAA (0 to 30 mM). c, Normalized peak current versus concentration of IAA, corresponding to (b). LYCHOS has a Michaelis–Menten constant of 13.7 ± 3.4 mM (95% CI; n = 4 independent experimental replicates), consistent with anion binding but likely not transport across the bilayer. d, Sliced top-down (cytoplasmic side) view of two reconstructions of LYCHOS that were incubated with 10 mM IAA or tryptophan, respectively. e, Focused view of the recessed cavity in the LYCHOS transporter domain showing additional density corresponding to IAA. No density was observed for tryptophan. f, Side-chain level contacts between IAA and LYCHOS are predominantly hydrophobic van der Waals interactions. The key asparagine forms hydrogen bonds with the carboxylate of IAA. Additional hydrogen bonds are observed between IAA and the main-chain amine groups. g, Cartoon representation of the LYCHOS transporter domain coloured by per-residue conservation (ConSurf) highlighting the IAA binding pocket. Inset: Focused surface representation view of (f), showing that the IAA binding pocket is highly conserved. hj,Site-directed mutagenesis of the conserved IAA binding pocket reduces the affinity of IAA for LYCHOS, with an increase in the apparent Kd for N145A (h; apparent Kd 5.49 mM, pKd 0.74±0.02, n = 5, p = 0.0003 vs wild-type), L177W (i; apparent Kd 3.93 mM, pKd 0.59±0.02, n = 8, p = 0.000001 versus wild-type) and A148W (j; apparent Kd 3.38 mM, pKd 0.52±0.03, n = 8, p = 0.0023 vs wild-type). RU, response units (n = 5–8 independent experimental replicates). One-way ANOVA with Tukey’s multiple comparisons test; pKd reported as mean±SEM. All RMax values are within the expected theoretical limit assuming two binding sites per LYCHOS molecule. k, Representative images of HEK293 cells transfected with LYCHOS–Flag or Flag–PIN8 at either 500 ng/well or 1 μg/well. Scale bar shows 10 μm. Transfection with 500 ng/well (as for LysoTORCAR assays, Fig. 4a–j and Extended Data Fig. 10b–g) leads to patterning consistent with a limited localization to intracellular membranes, whereas over-transfection with 1 μg/well (as for AuxSen efflux assays, Fig. 2h,i) caused a mislocalization of LYCHOS and PIN8 to additional cellular membranes, allowing us to measure transport of IAA by PIN8 across the plasma membrane. l, Tryptophan was unable to specifically bind LYCHOS wild-type or mutant variants as determined using surface plasmon resonance (n = 4 independent experimental replicates). Source Data
Extended Data Fig. 8
Extended Data Fig. 8. Cholesterol recognition is mediated by a CRAC-motif in a highly conserved pocket.
a, Sliced top-down (cytosolic face) view of two LYCHOS reconstructions with CHS (red) bound (F352A/W678R) and without CHS (wild-type). Two CHS molecules populate the interface between the GPCR and transporter domains. b, Focused view of the cryo-EM density of the cholesterol-binding region of LYCHOS (F352A/W678R) positioned at the interface of the GPCR and transporter domains. c, Wild-type LYCHOS is in a closed conformation with the GPCR domain clamped shut, occluding the LYCHOS cholesterol sensing pocket. Relaxation of the GPCR domain from the closed state to the open state is necessary to accommodate cholesterol entry. d, Surface representation of the LYCHOS cholesterol sensing pocket coloured by per-residue conservation (ConSurf). A region of high surface conservation is apparent, with virtually all conserved residues defining a deep groove that accommodates cholesterol (innermost CHS molecule; white) e, Cartoon representation of d with the single innermost CHS moiety shown. Neighbouring key residues are labelled with colours according to conservation (as in d). The CRAC-motif (L/V-X1-5-Y-X1-5-K/R) is defined by three residues (Val53, Tyr57, Arg61) on LYCHOS α1. Key residues Cys55 and Glu48 identified by photolabelling are indicated (yellow stars). Residues Phe43, Tyr57 and Pro44, previously identified through mutagenesis studies are indicated. f, A two-dimensional ligand interaction diagram showing a projected view of the key residues that define interactions in the cholesterol-binding pocket in e. Here a cholesterol molecule is modelled. g, After long incubation with IAA (2 h) a strictly monomeric LYCHOS population was observed by cryo-EM (see Supplementary Discussion 2). The 3.0 Å resolution cryo-EM reconstruction of the LYCHOS monomer in complex with IAA is shown. LYCHOS is coloured according to Fig. 1a and the micelle is shown as a white overlay. h,i, Short incubation (1 min) with IAA resulted in a mixed distribution of a closed (h) and partially open (i) conformational states by cryo-EM. In the closed state, a single CHS molecule with partial denisty is observed in a queued position, where due to Phe352, it is blocked from entering the LYCHOS cholesterol sensing pocket. j, In the monomeric state, α2 of the scaffold domain undergoes a subtle conformational rearrangement resulting in steric clashes at the dimer interface incompatible with dimer formation. k, Focused cartoon of α2 of the scaffold domain (monomer is coloured) superimposed with the same region of dimeric wild-type LYCHOS (white). l, No change was observed in the mass photometry histogram, indicating that IAA did not clearly promote the monomeric conformation of LYCHOS seen under cryo-EM. See Supplementary Discussion 2. Source Data
Extended Data Fig. 9
Extended Data Fig. 9. Conformational changes of the GPCR–transporter interface and Phe352 gate.
a, IAA-bound LYCHOS undergoes a conformational relaxation of the GPCR domain, characterized by rotation and partial opening. The transition between the closed and partially open state is only observed for wild-type LYCHOS upon incubation of IAA. b, Lateral movement of the whole GPCR domain (rigid-body transformation) is associated with the relaxation transition. c, Superposition of the middle and CRAC-motif CHS molecules from the LYCHOS (F352A/W678R) structure into the closed conformation (wild-type LYCHOS). Clear steric clashes (pink) are present due to the closed Phe352 gate. A single queuing CHS molecule is blocked from entry. d, As in c, showing the middle and CRAC-motif CHS molecules in the partially open conformation. Visible clashes suggest that alternate rotamer positions alone are not sufficient to allow cholesterol entry. e, The LYCHOS (F352A/W678R) structure showing that both CHS molecules (middle and CRAC-motif) are accommodated by bypassing the Phe352 gate and a lateral movement of α17. f, Focused illustration of F705 and F352 residues that contribute the most significant steric clashes in the closed (c) and partially open (d) conformations. These clashes are resolved in the fully open and Phe352 bypassed (F352A/W678R) structure (e). g, All three observed CHS molecules are shown with the wild-type and F352A/W678R LYCHOS structures superimposed. Cryo-EM density is shown for each CHS molecule. More complete density, potentially due to more extensive contacts, is visible for the CRAC-motif CHS molecule. By contrast, the queuing CHS is only partially resolved.
Extended Data Fig. 10
Extended Data Fig. 10. The LYCHOS transporter domain coordinates a potential gating mechanism for cholesterol.
a, Relative expression of LYCHOS–Flag WT, Y57A, F352A and N145A compared to empty vector control, and of LYCHOS–Flag WT compared to F352A/W678R or F352A/W678R/N145A in HEK293 cells after transfection with 500 ng/well as for the LysoTORCAR assay (this figure and Fig. 4a–j). Upper panel shows quantified densitometry of the LYCHOS–Flag band relative to β-tubulin loading control. Symbols show values from independent biological replicates (n = 3), the bold line shows the mean and error bars show SEM. Lower panel shows a representative western blot. For western blot source data, see Supplementary Figs. 1 and 2. b,d,f, mTORC1 activity in response to cholesterol addition or depletion (at 0 min, dotted line) followed by repletion (at 40 min, arrow) in HEK293 cells co-transfected with LysoTORCAR and empty vector control (b; n = 4), LYCHOS(Y57A) (d; n = 3), or LYCHOS(F352A) (f; n = 4). Symbols show the mean and error bars show SEM from independent biological replicates. c,e,g, Fold change in mTORC1 activity in response to cholesterol addition, depletion (average F/F0 at -5-0 min vs 35–40 min for red and blue curves, respectively), or repletion (average F/F0 at 35–40 min vs 5 min average at the peak after repletion) calculated from b,d,f. h, Control-subtracted area under the curve (AUC) in response to cholesterol addition, calculated from 0–40 min from f and Fig. 4a,c,f,h. For bar graphs, symbols show values from independent biological replicates, the bold line shows the mean and error bars show SEM; p-values were calculated by one-way ANOVA with Šidák’s multiple comparisons test (for h, and comparisons to control in c,e,f) or two-sided paired t-test (for comparisons between depletion and repletion in c,e,f). See also Supplementary Discussion 3. Saturation BRET in HEK293 cells transfected with increasing amounts of cpmCitrine-NPRL2 (BRET acceptor) and a low, constant amount of the BRET donors i, LYCHOS-NLuc (n = 3) or β2-adrenoceptor-NLuc (β2AR-NLuc; a G protein-coupled receptor that we used as a negative control; n = 3), or j, LYCHOS-NLuc WT (n = 5), N145A (n = 3), F352A/W678R (n = 3), or F352A/W678R/N145A (n = 3). Symbols show values from n independent biological replicates. k, BRET50 values calculated from the curves shown in (j). Symbols show values from independent experiments, the bold line shows the mean and error bars show SEM; p-value was calculated by one-way ANOVA with Šidák’s multiple comparisons test. The large and saturating increase in BRET between LYCHOS and NPRL2 (i) is consistent with specific interactions between LYCHOS and GATOR1 under growth conditions (normal cell culture medium). In contrast, there is minimal BRET observed between NPRL2 and the β2-adrenoceptor which, when not activated by ligand, predominantly resides at the plasma membrane. Source Data

References

    1. Settembre, C. & Perera, R. M. Lysosomes as coordinators of cellular catabolism, metabolic signalling and organ physiology. Nat. Rev. Mol. Cell Biol.25, 223–245 (2024). - PubMed
    1. Shin, H. R. et al. Lysosomal GPCR-like protein LYCHOS signals cholesterol sufficiency to mTORC1. Science377, 1290–1298 (2022). - PMC - PubMed
    1. Liu, G. Y. & Sabatini, D. M. mTOR at the nexus of nutrition, growth, ageing and disease. Nat. Rev. Mol. Cell Biol.21, 183–203 (2020). - PMC - PubMed
    1. Luo, J., Yang, H. & Song, B. L. Mechanisms and regulation of cholesterol homeostasis. Nat. Rev. Mol. Cell Biol.21, 225–245 (2020). - PubMed
    1. Meng, Y., Heybrock, S., Neculai, D. & Saftig, P. Cholesterol handling in lysosomes and beyond. Trends Cell Biol.30, 452–466 (2020). - PubMed

MeSH terms