. 2024 Nov;635(8038):415-422.
doi: 10.1038/s41586-024-08010-x. Epub 2024 Oct 2.

Inducing novel endosymbioses by implanting bacteria in fungi

Affiliations

Inducing novel endosymbioses by implanting bacteria in fungi

Gabriel H Giger et al. Nature. 2024 Nov.

Abstract

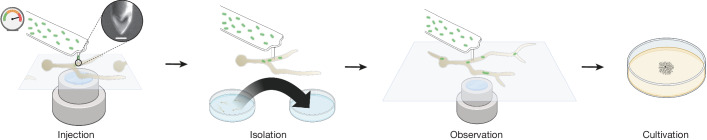
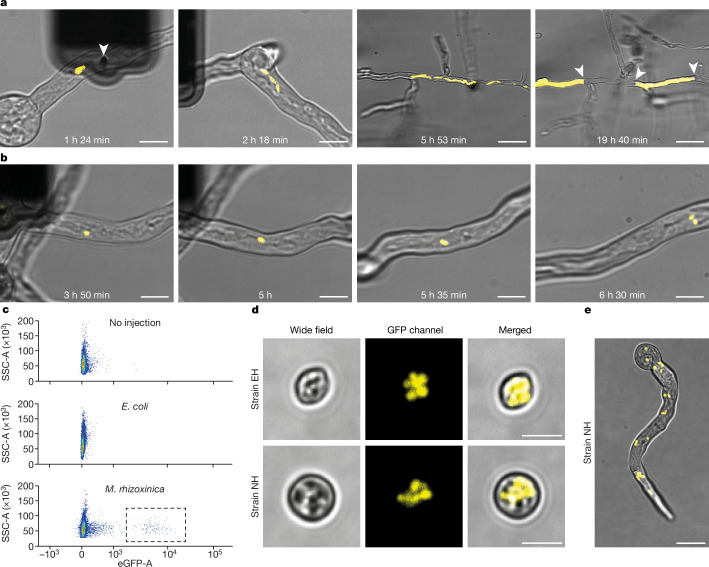
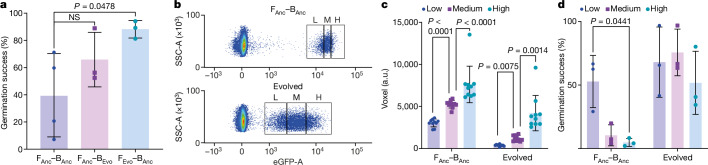
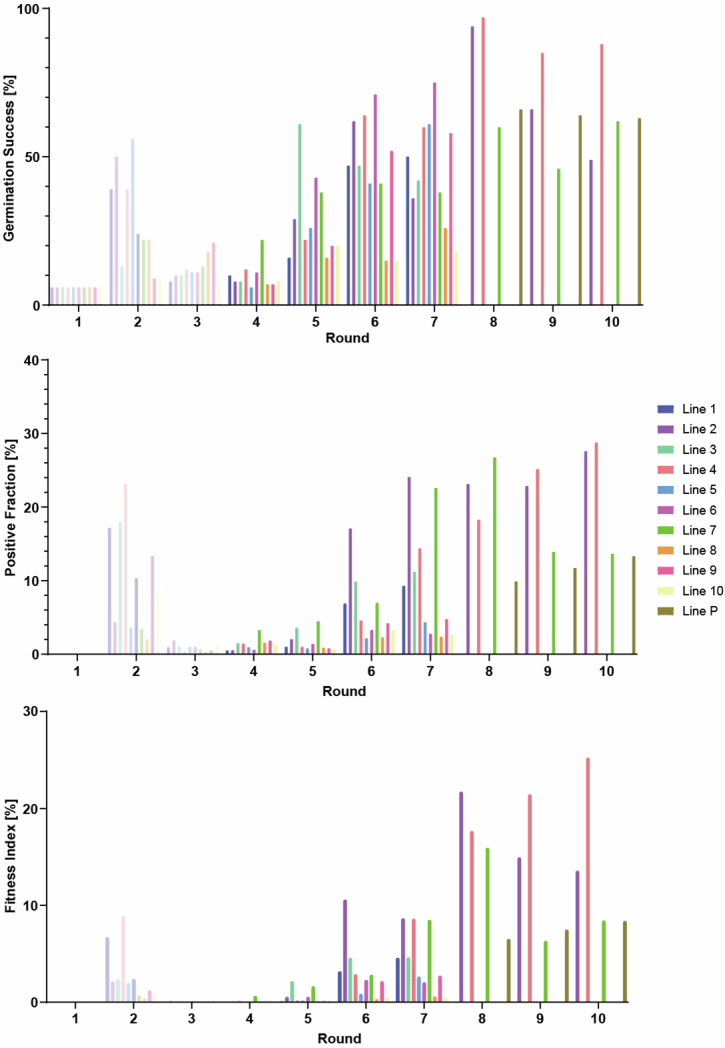
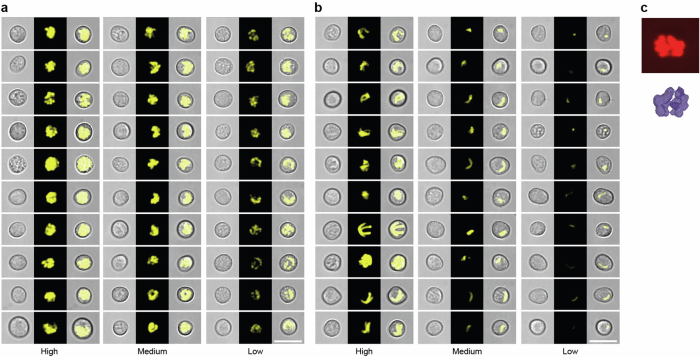
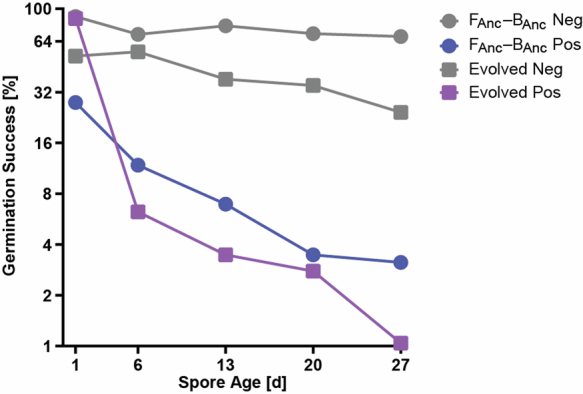
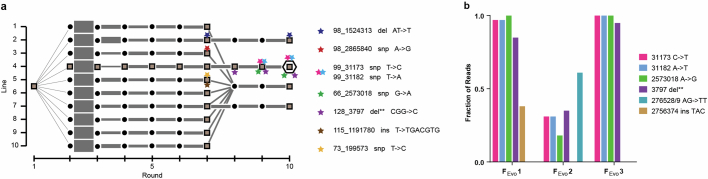
Endosymbioses have profoundly impacted the evolution of life and continue to shape the ecology of a wide range of species. They give rise to new combinations of biochemical capabilities that promote innovation and diversification1,2. Despite the many examples of known endosymbioses across the tree of life, their de novo emergence is rare and challenging to uncover in retrospect3-5. Here we implant bacteria into the filamentous fungus Rhizopus microsporus to follow the fate of artificially induced endosymbioses. Whereas Escherichia coli implanted into the cytosol induced septum formation, effectively halting endosymbiogenesis, Mycetohabitans rhizoxinica was transmitted vertically to the progeny at a low frequency. Continuous positive selection on endosymbiosis mitigated initial fitness constraints by several orders of magnitude upon adaptive evolution. Phenotypic changes were underscored by the accumulation of mutations in the host as the system stabilized. The bacterium produced rhizoxin congeners in its new host, demonstrating the transfer of a metabolic function through induced endosymbiosis. Single-cell implantation thus provides a powerful experimental approach to study critical events at the onset of endosymbiogenesis and opens opportunities for synthetic approaches towards designing endosymbioses with desired traits.


Conflict of interest statement

Competing interests The authors declare no competing interests.

Figures

Fig. 1
Fig. 1. Workflow for bacteria injection into fungal germlings.
FluidFM injection takes place on a glass dish surface placed above an inverted confocal light microscope. The probe apex is sharpened to a double point with an aperture of 500 to 1,000 nm. Inset: focused ion beam image of probe apex; scale bar, 500 nm. The turgor of the hypha is overcome by applying up to 6.5 bar overpressure. After the injection, the still-attached germling can be isolated into an empty dish, in which the recovery and growth of the microorganisms can be observed. The injected germling can subsequently be detached from the probe and transferred to a Petri dish for further cultivation until sporulation. Created with BioRender.com.
Fig. 2
Fig. 2. Injection of M.rhizoxinica, but not E.coli, leads to vertical transmission of endosymbionts.
a, Images show the growth of the fungus and E.coli cells (yellow) at different time points. In the left image, the dark shape is the FluidFM probe, and the white arrowhead marks the apex of the probe inserted in the germling. In the right image, the white arrowheads indicate formed septa preventing bacterial spread. Images with differing magnification have different illumination settings and contrast adjustments. E.coli injections were carried out three times each in R.microsporus strain EH and strain NH with similar results (total n = 6). Shown here is strain EH. b, M.rhizoxinica replicates in R.microsporus strain NH (see also Supplementary Video 4). The experiment was carried out four times with similar results. c, Flow cytometry plots for spores collected from R.microsporus strain NH after no bacteria injection (top), E.coli injection (middle) and M.rhizoxinica injection (bottom). After injection with M.rhizoxinica, a high-GFP-signal fraction is observed (dashed grey rectangle), stemming from labelled bacteria. The experiment was carried out three times with similar results. Samples were run on different days on the same machine. d, Images showing positively FACS-sorted spores with intracellular bacteria. Top: host R.microsporus strain EH populated with the natural endosymbiont. Bottom: injected R.microsporus strain NH populated with M.rhizoxinica. The experiment was carried out four times with similar results. e, Image showing a germling from the positively sorted spore fraction of R.microsporus strain NH injected with M.rhizoxinica. The bacteria are distributed within the whole germling and are present in higher density than directly after an injection. The experiment was carried out four times with similar results. For a,b,d,e, images show a single-z-layer wide-field image overlaid with the two-dimensional projection of the GFP-signal z-stack in yellow. Scale bars, 10 μm (a, two left images, b), 40 μm (a, two right images), 5 μm (d) and 20 μm (e).
Fig. 3
Fig. 3. Adaptive laboratory evolution experiment leads to higher fitness of the induced endosymbiosis.
a, Scheme of population sizes and line management throughout the experiment. Black dots indicate spore collection events with measurement of positive fraction and germination success, and sorting of positive spores. Black squares mark collection events in which, additionally, genomic DNA was isolated from the population and sequenced. Grey bars illustrate the number of positive spores plated. Round 1 spore collection is R.microsporus strain NH germling injected with M.rhizoxinica. The hexagon marks round 10 of line 4. b, The germination success of bacteria-positive spores (blue) and bacteria-negative spores (grey) at different rounds of propagation. NS, not significant. c, The positive fraction as measured by FACS increases over time. d, The fitness index, as calculated by multiplying the positive fraction from c with the germination success from b. e, Bacteria-positive (B+) spores exhibit an increased level of delayed germinations compared to bacteria-negative (B) spores throughout the directed evolution experiment. Solid lines indicate mean; dashed lines indicate quartiles. n = 73 plates. P < 0.000000000001. In bd, for round 1, n = 1, round 3 and 7, n = 10, and round 10, n = 4 biological samples from one experiment. In bd, data are presented as mean values ± s.d. In be, two-sided Wilcoxon matched-pairs signed rank test. f, The bacterially produced rhizoxin precursor WF-1360F can be detected in the induced endosymbiosis. g, The compound rhizoxin can be detected in the induced endosymbiosis. In f,g, plate extracts of all ten lines (L1–L10) from round 7 of the adaptive laboratory evolution experiment were analysed by liquid chromatography with tandem mass spectrometry. The molecules are detected in all ten lines. Shown are the sections of the liquid chromatography retention times of the highest signal intensity for m/z 610.337 (WF-1360F; f) and m/z 626.3323 (rhizoxin; g). a.u., arbitrary units. Source Data
Fig. 4
Fig. 4. Cross-injection experiments show that the induced endosymbiosis adapted throughout the evolution experiment.
a, The evolved fungus in FEvo–BAnc leads to a higher germination success directly after injection compared to the unevolved fungus in FAnc–BAnc. Data are presented as mean values ± s.d. and compared using two-sided unpaired t-test with Welch’s correction. n = 3 biological samples b, Flow cytometry plots of side scatter area (SSC-A) versus enhanced-GFP area (eGFP-A) show a reduced GFP intensity for the bacteria-positive spores from round 10 line 4 (evolved) compared to FAnc–BAnc spores. Gates illustrate the approximate gating strategy used to sort samples depicted in c,d, with the positive population being partitioned into low (L)-, medium (M)- and high (H)-GFP-signal fractions. Prior flow cytometry gating imposed size restrictions and selected for single spores (Methods). c, Bacterial load of ten spores per fraction for the low, medium and high fractions collected according to the gating strategy in b. There is a significant correlation between bacterial load and the signal intensity measured with flow cytometry. The bacterial load was determined by quantifying fluorescent voxels of z-stack images of single spores. Data are presented as mean values ± s.d. and compared using a two-sided unpaired t-test with Welch correction; n = 10 technical replicates. P = 0.0000000022 (left); P = 0.000016 (right). Spores from the evolved pair (round 10 line 4) have a lower bacterial load than FAnc–BAnc (all fractions combined, P = 0.00000013, two-sided unpaired t-test with Welch correction, n = 30 technical replicates). d, A lower bacterial load correlates with a higher germination success for the ancestral pair (FAnc–BAnc). This correlation is not detected in the evolved pair, which overall has a lower bacterial load and higher germination success. Data are presented as mean values ± s.d. and compared using two-sided paired t-test with individual variance and two-stage set-up. n = 3 biological samples. Source Data
Fig. 5
Fig. 5. The increased fitness and stability of the evolved endosymbiosis correlates with genetic changes in the fungal population.
a, Four mutations in line 4 became prevalent in the host population during the adaptive evolution experiment, correlating with the increase in the fitness index. The graph depicts in solid lines on the left y axis the relative frequency of reads with the corresponding mutations compared to the reference sequence. The dashed line on the right y axis depicts the fitness index of line 4 over the course of the experiment. Mutations reaching more than 50% relative frequency are shown. ‘del**’ indicates deletion of two base pairs (CGG>C). b, The evolved endosymbiosis is more stable than the ancestral endosymbiosis (FAnc–BAnc) in the absence of artificial selection. The graph shows in colour the fraction of bacteria-positive spores in the absence of artificial selection by FACS, and in grey the predicted positive fraction based on a mathematical model. The model uses the germination success and fraction of bacteria-positive and bacteria-negative spores to predict the fraction of bacteria-positive spores over rounds of propagation in the absence of selection. The upper dotted line indicates the threshold for propagation and diluting out (1/100,000); the lower dotted line indicates the detection limit (1/1,000,000). Values measured as 0 positive fraction are not shown on the logarithmic plot. Data are presented as mean values ± s.d. of n = 3 biological samples. Source Data
Extended Data Fig. 1
Extended Data Fig. 1. Plots showing data for all ten rounds of the adaptive laboratory evolution experiment for all ten lines.
Pale colored datapoints in rounds 1–3 indicate the expansion phase of the experiment under differing plating densities (see Methods and Extended Data Fig. 4a). The increase in fitness in round 2 is likely due to the low-density plating conditions. Plots show the heterogeneity in increase of the fitness of the different lines and trend towards higher fitness. For round 8–10, only lines 2, 4, and 7, were continued as before, while line P was the pooled fraction of the other lines. Source Data
Extended Data Fig. 2
Extended Data Fig. 2. Bacterial load assessment inside spores of R. microsporus strain NH.
Panel a and b show per column from left to right: a single z layer widefield image, a 2D sum of the GFP signal of a z stack in yellow, the overlay of the two signals. The different columns show 10 spores each from FACS-sorted spores from fractions with high, medium, and low GFP signal. Scale bar 10 µm. Panel a shows spores from the unevolved partners. Panel b shows spores from the evolved partners. The microscopy data shows that lower FACS signal corresponds to a lower bacterial load. Bacteria from the evolved endosymbiosis show an elongated phenotype and generally a lower bacterial load. Panel c shows an example of the output for the computational analysis of bacterial volume used for Fig. 5c. In red on black is the fluorescence signal used for the selection of the region of interest (same spore as Panel a, first column, third row). In purple on white is a pseudo 3D rendering of the generated output for visual confirmation. The calculated voxel number for this sample was 6247.
Extended Data Fig. 3
Extended Data Fig. 3. The germination rate of bacteria-positive spores drops faster over time than the germination rate of bacteria-negative spores.
The plot shows the germination rate of spores at timepoints after harvesting and incubating in Hepes2 at 16 °C on a logarithmic scale. Evolved spores stem from Round 10 Line 4. Data shown is from a single sample. Source Data
Extended Data Fig. 4
Extended Data Fig. 4. Overview of the identified mutations in the adaptive laboratory evolution experiment.
a Scheme of mutations found in over 50% of reads throughout the adaptive evolution experiment (see also Fig. 3a). Squares indicate where genomic DNA was extracted from the fungus and from reisolated bacteria. Colored stars indicate samples where the respective mutations is found in more than 50% of reads. The hexagon marks round 10 of line 4, the population with the highest final fitness index, which was used for phenotypic characterization and is referred to as “evolved” (positive spores), FEvo (negative spores), or BEvo (reisolated bacteria). b Graph showing the genotype of the mycelium formed after injecting an FEvo negative spore with BAnc bacteria, which showed a high fitness index. Shown are the fraction of reads showing the mutations for the four loci identified in panel a plus an additional 2 loci which showed differences to the reference in more than 30% of reads. Details to the frequency of these two mutations over the course of the experiment can be found in (Extended Data Table 3) FEvo1 and FEvo3 appear to almost exclusively have the four previously identified mutations, whereas they are only partially present in FEvo2. Source Data

References

    1. Martin, W. & Müller, M. The hydrogen hypothesis for the first eukaryote. Nature392, 37–41 (1998). - PubMed
    1. Wernegreen, J. J. Endosymbiosis. Curr. Biol.22, 555–561 (2012). - PubMed
    1. Kobayashi, D. Y. & Crouch, J. A. Bacterial/fungal interactions: from pathogenes to mutualistic endosymbionts. Annu. Rev. Phytopathol.47, 63–82 (2009). - PubMed
    1. Meaney, R. S., Hamadache, S., Soltysiak, M. P. M. & Karas, B. J. Designer endosymbionts: converting free-living bacteria into organelles. Curr. Opin. Syst. Biol.24, 41–50 (2020).
    1. Brockhurst, M. A., Cameron, D. D. & Beckerman, A. P. Fitness trade-offs and the origins of endosymbiosis. PLoS Biol.22, e3002580 (2024). - PMC - PubMed

LinkOut - more resources