. 2024 Nov;635(8038):398-405.
doi: 10.1038/s41586-024-08027-2. Epub 2024 Oct 2.

Calcium-permeable AMPA receptors govern PV neuron feature selectivity

Affiliations

Calcium-permeable AMPA receptors govern PV neuron feature selectivity

Ingie Hong et al. Nature. 2024 Nov.

Abstract

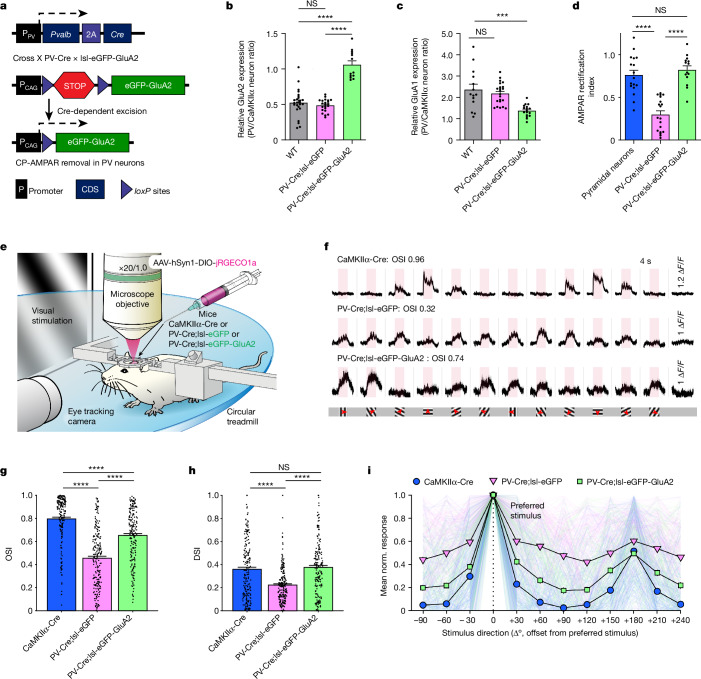
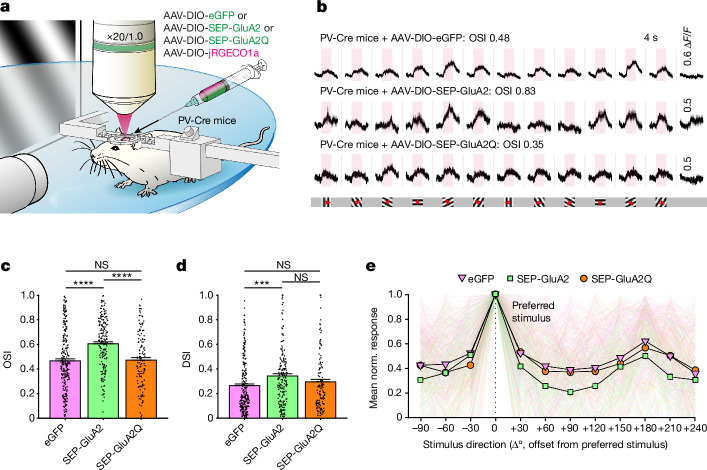
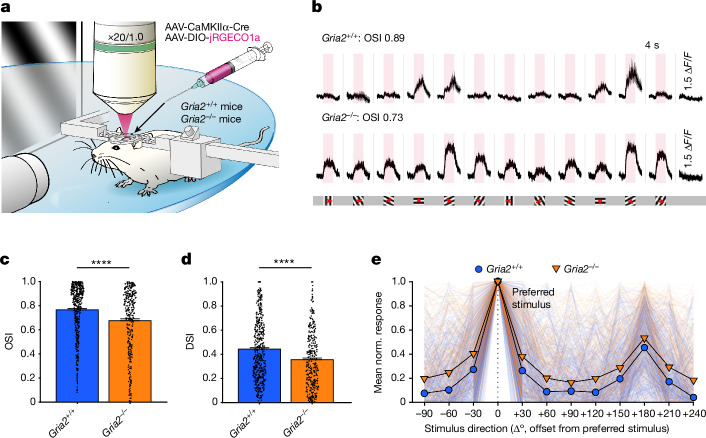
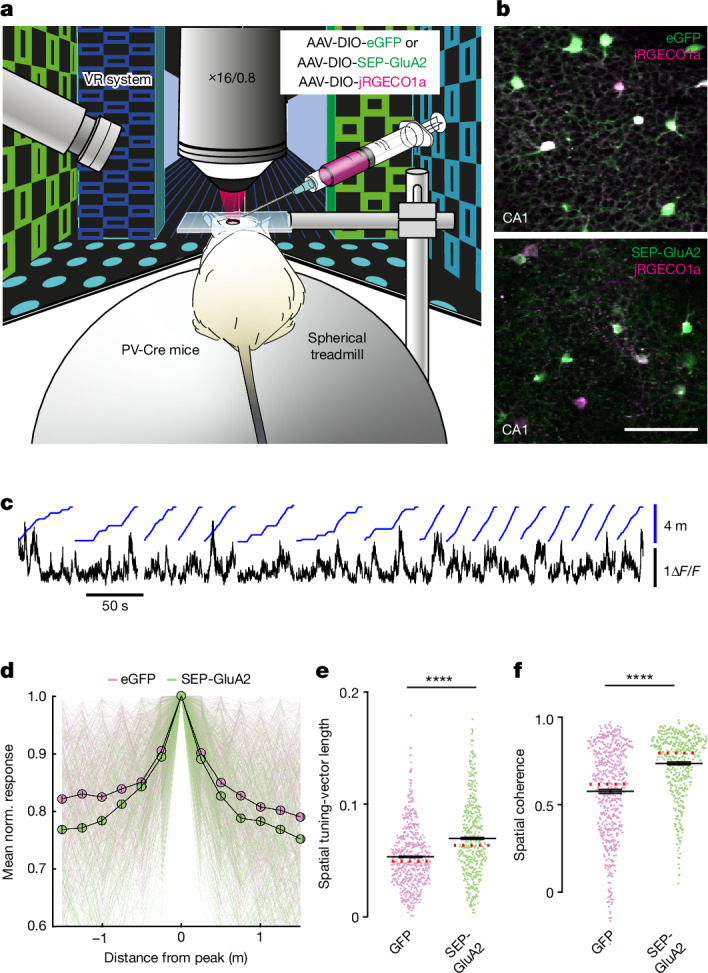
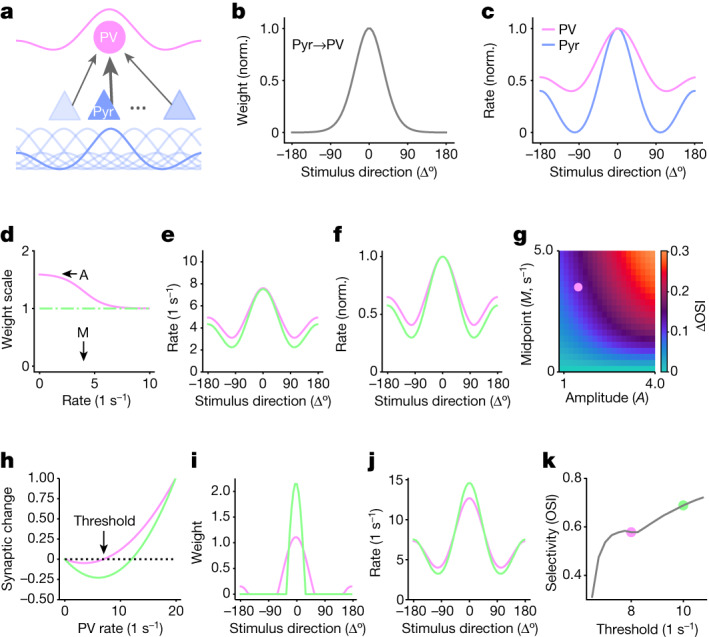
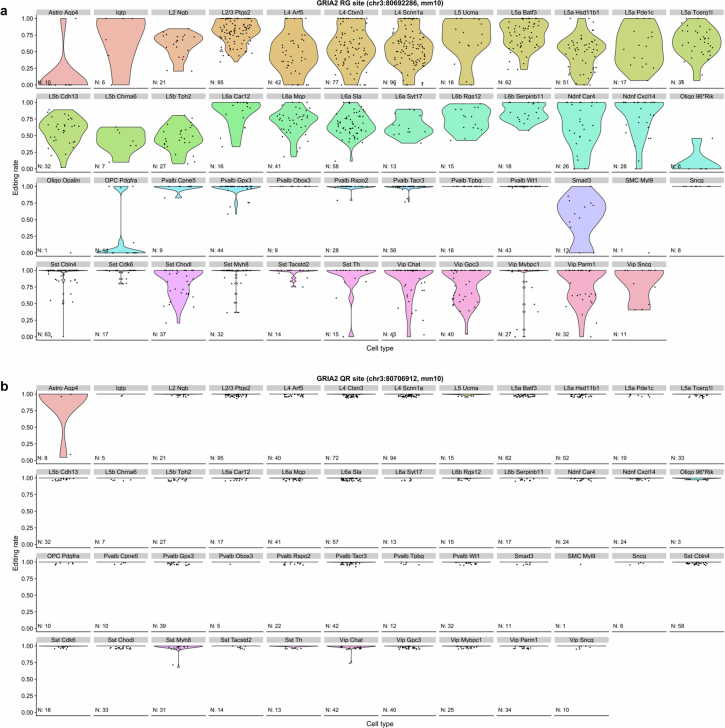
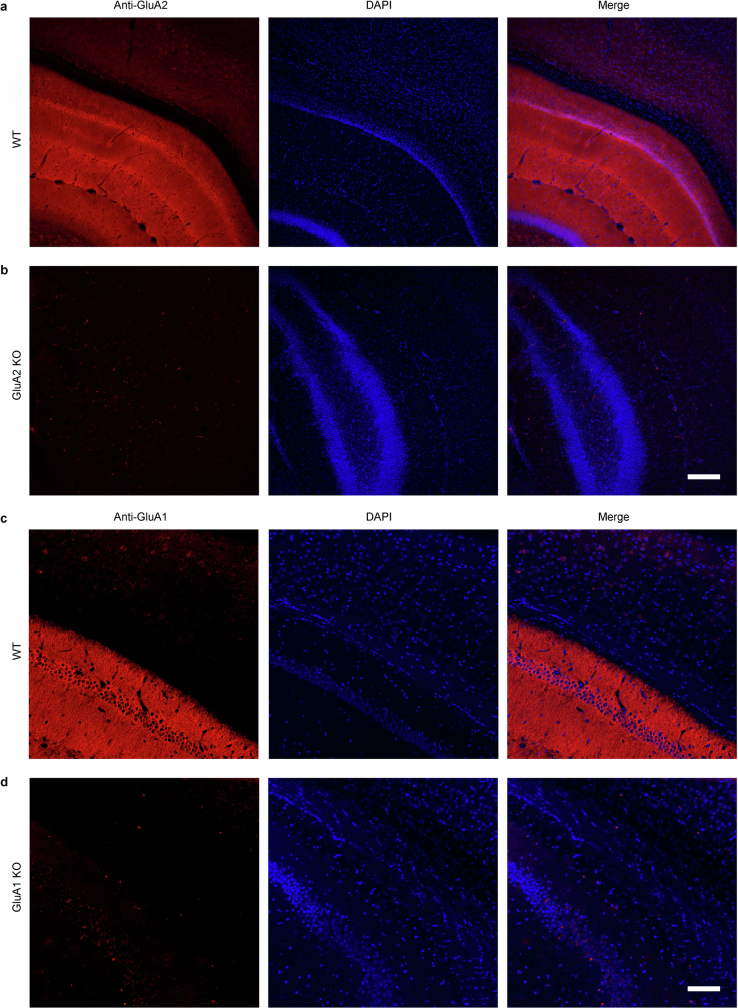
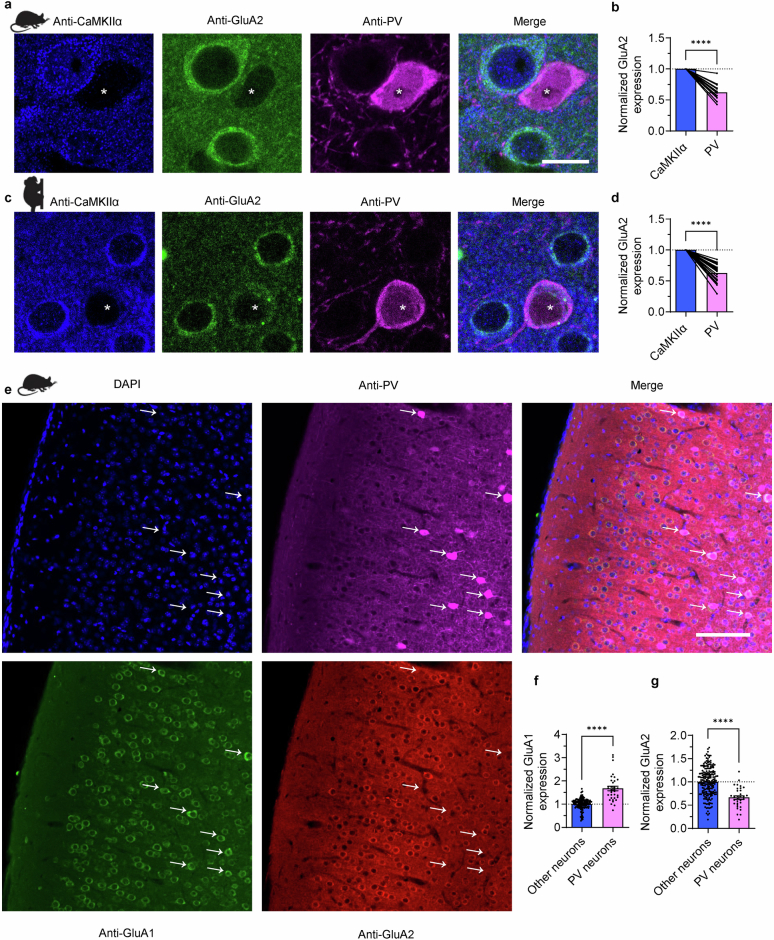
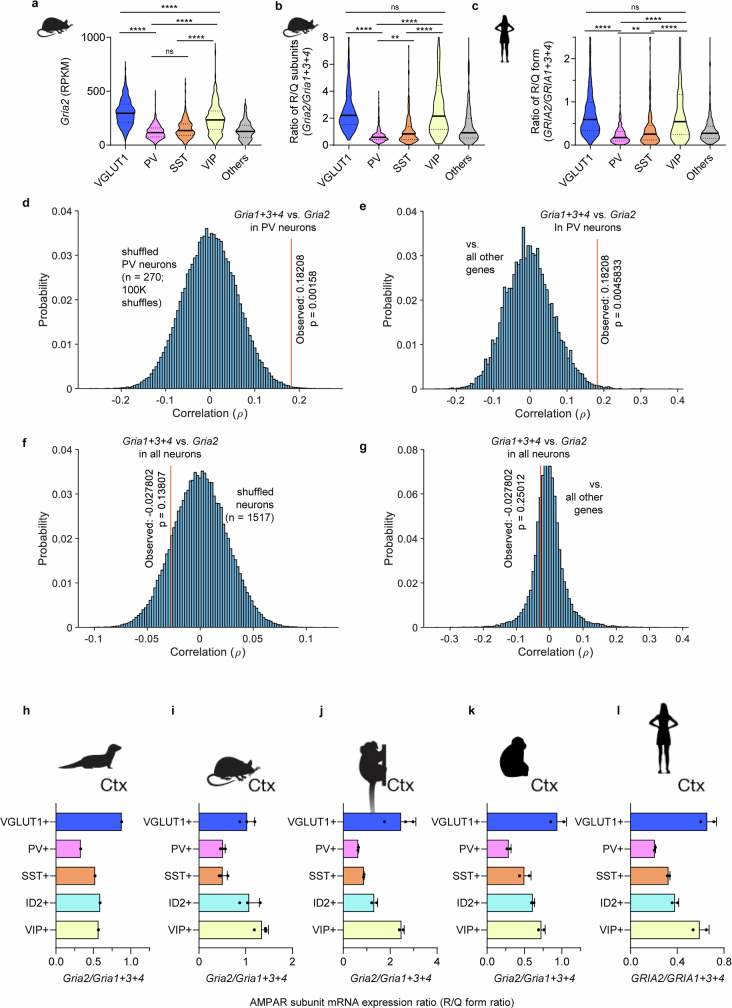
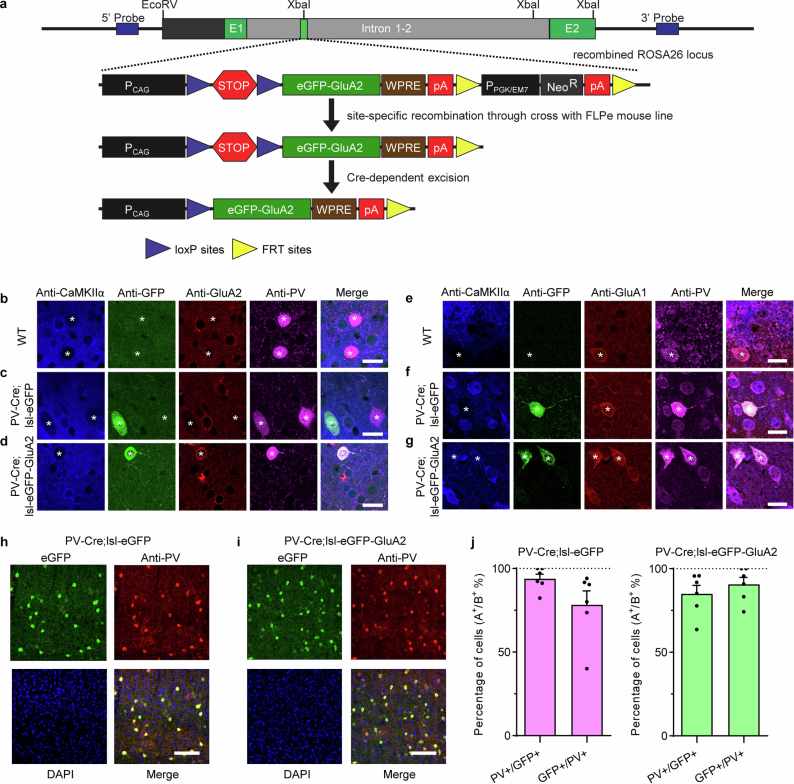
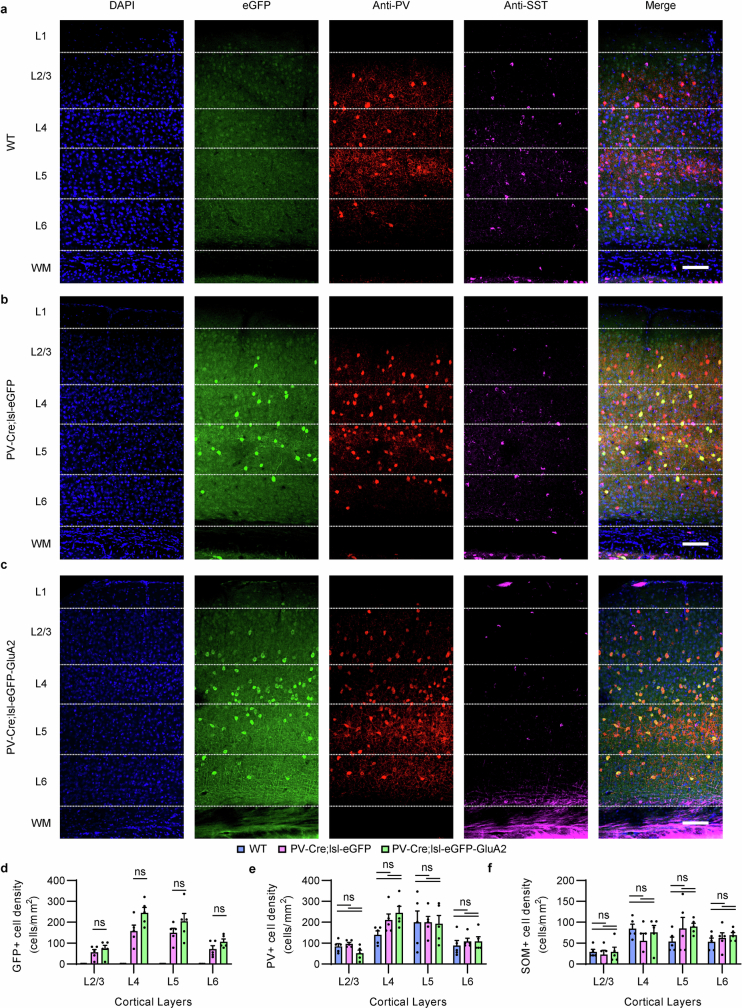
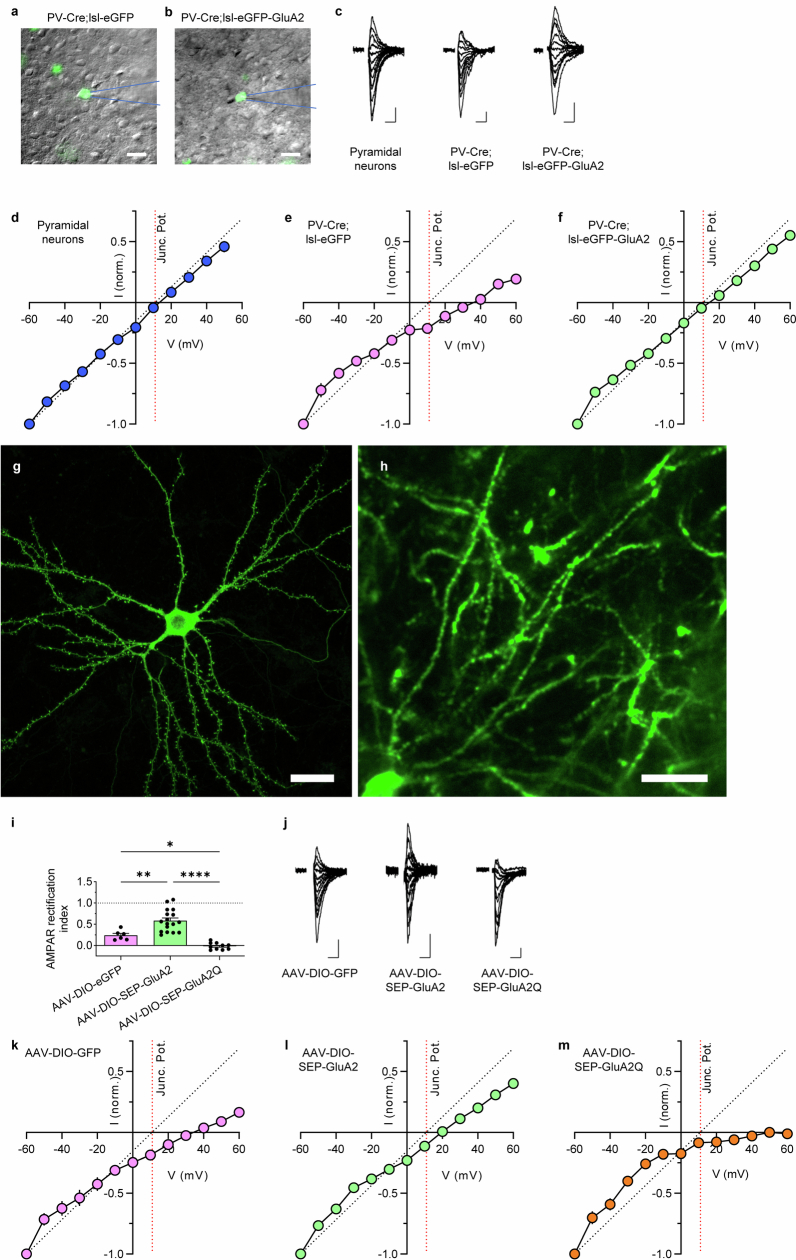
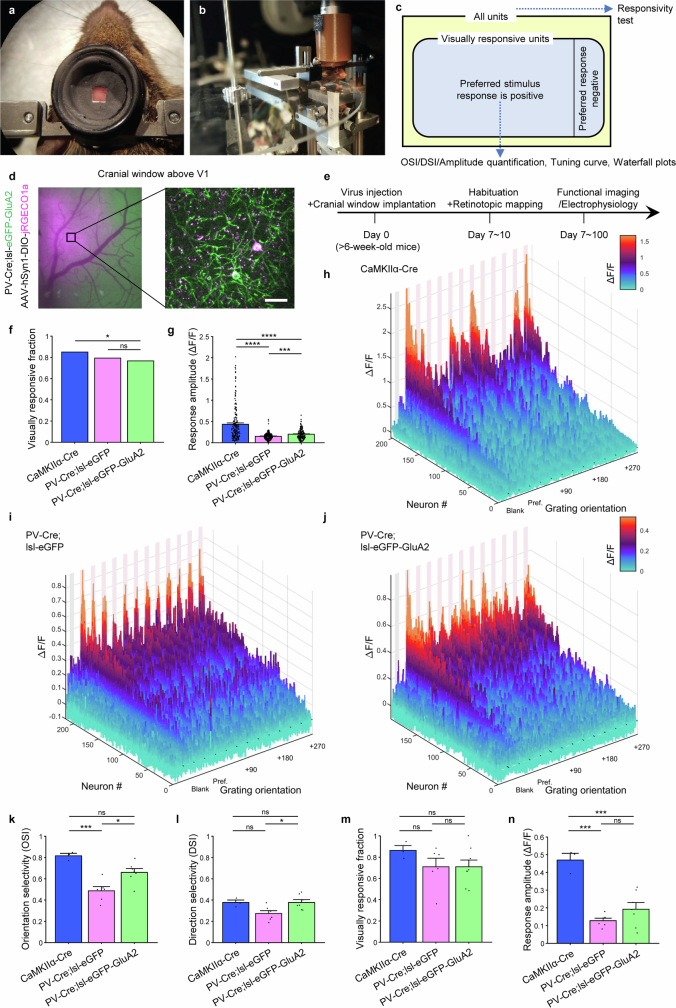
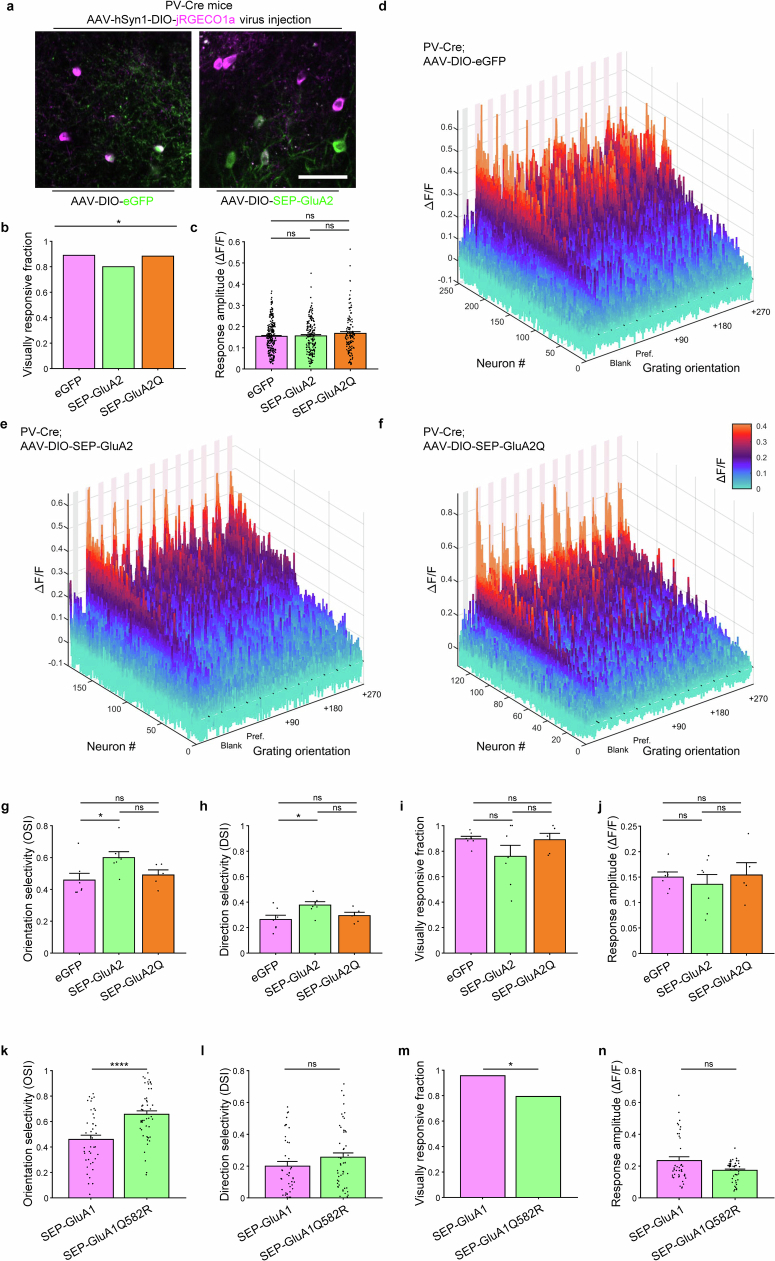
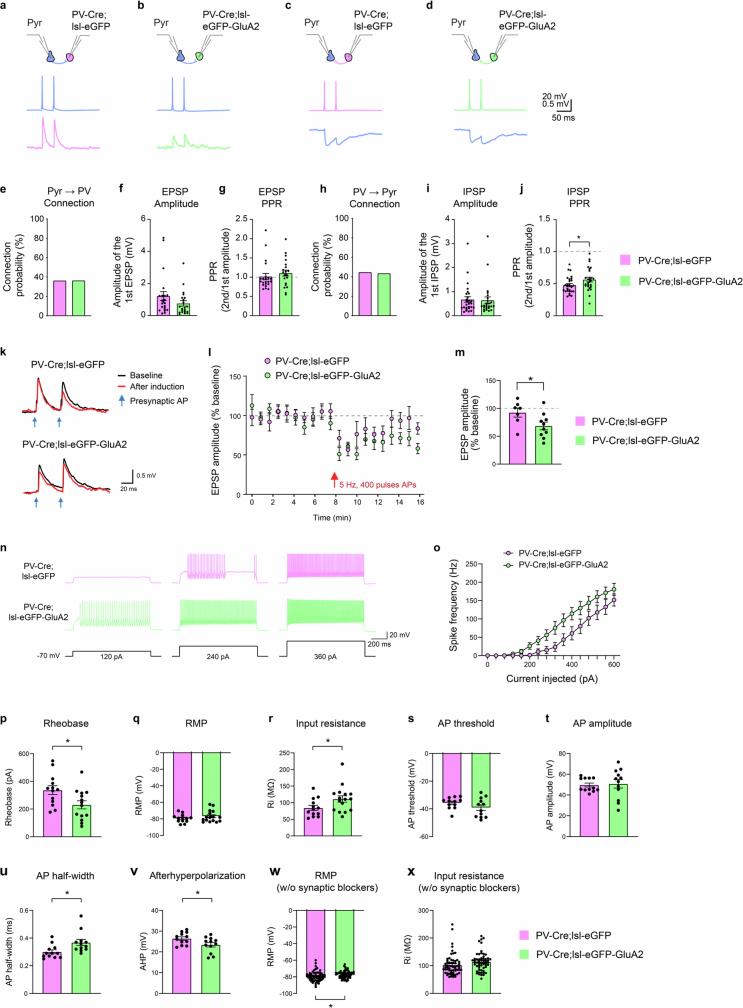
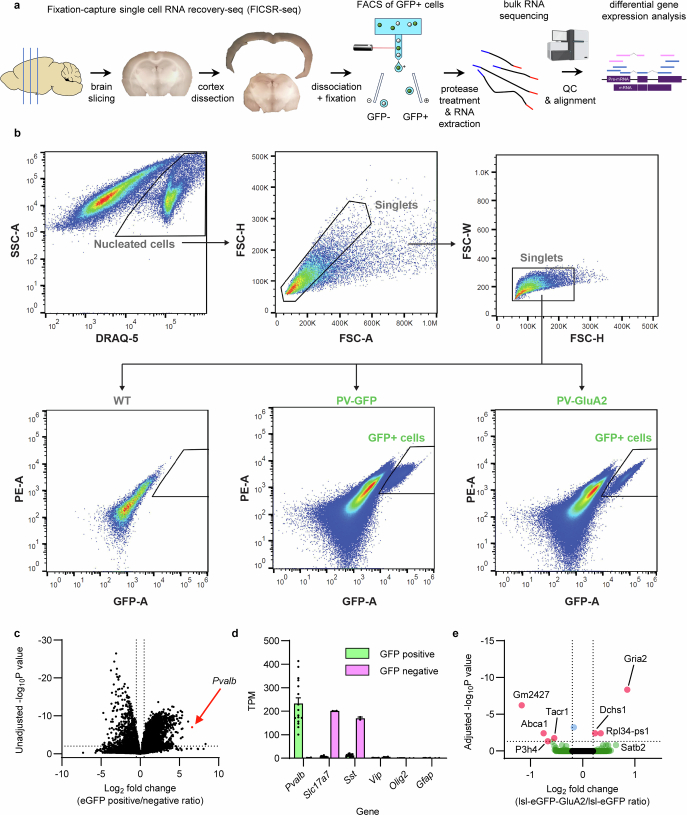
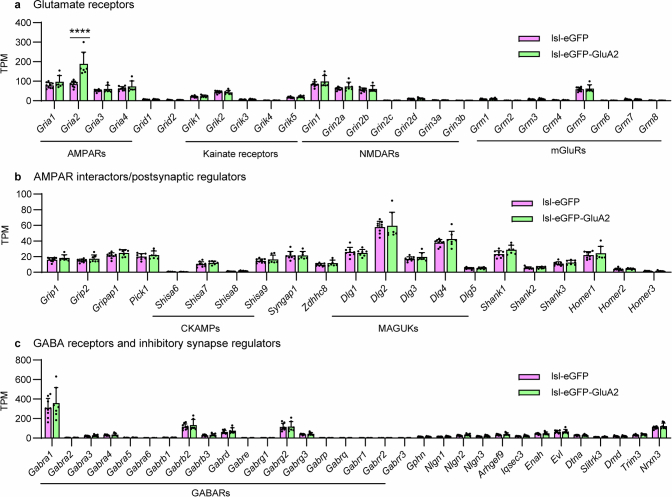
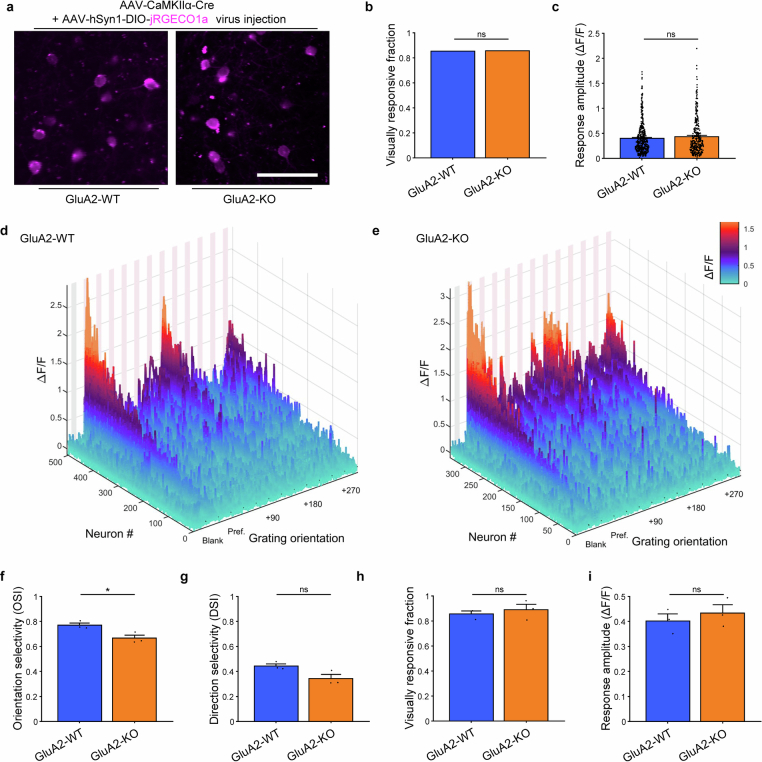
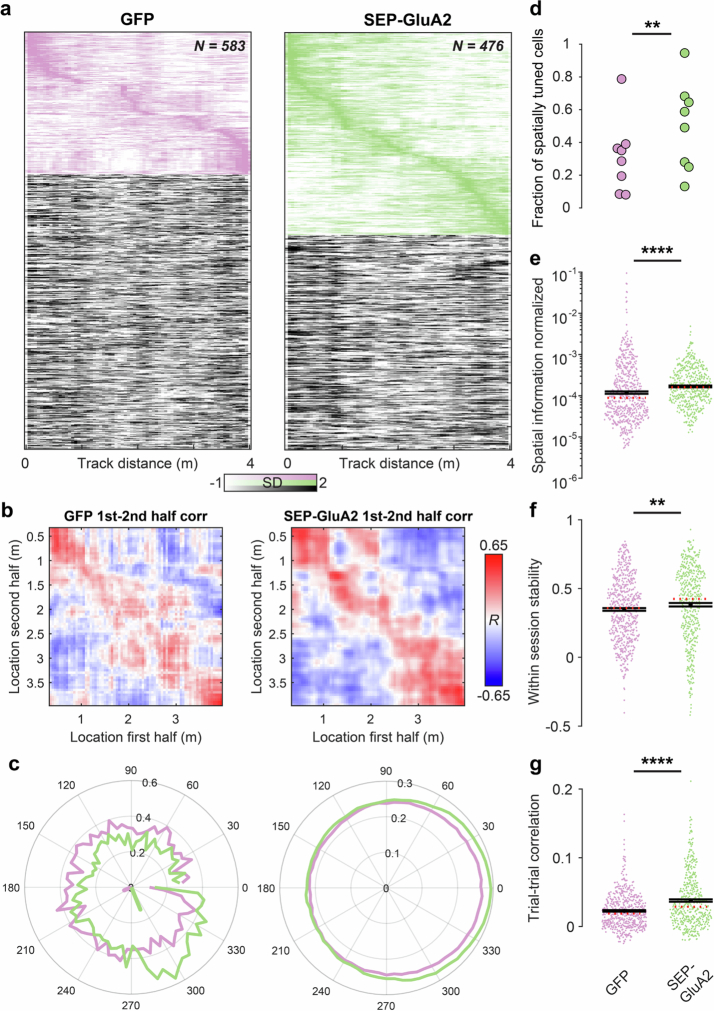
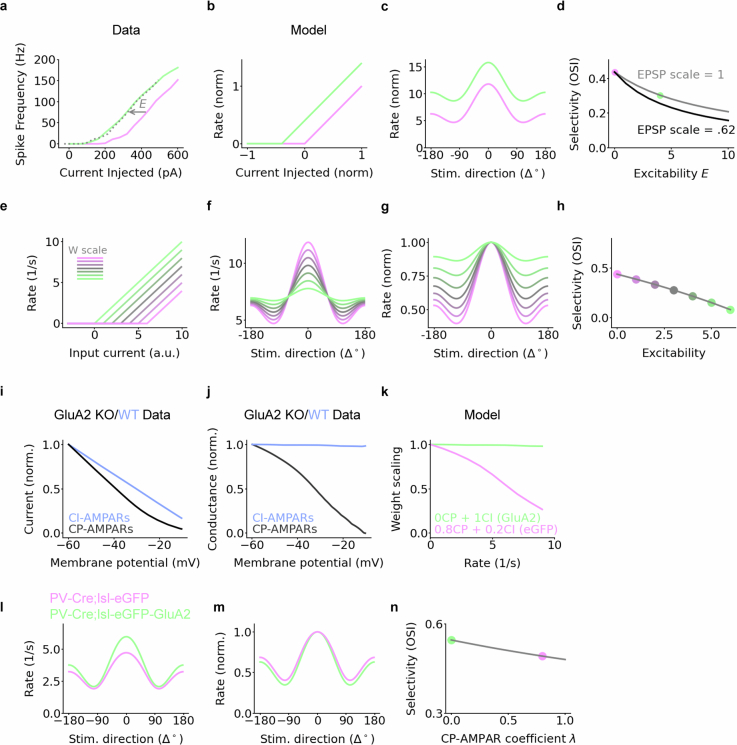
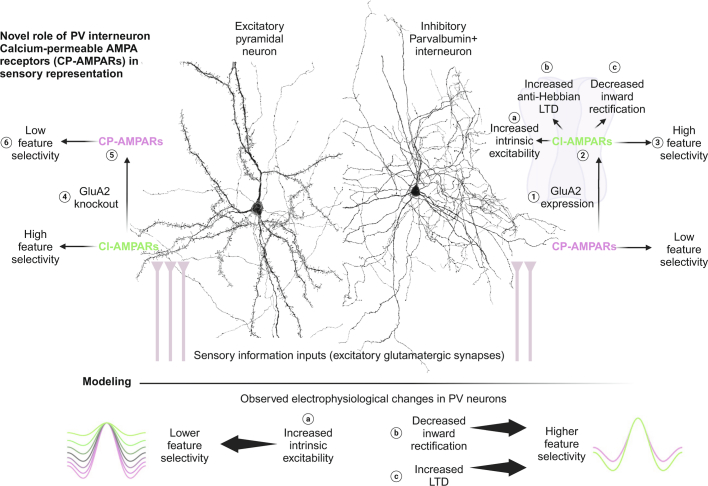
The brain helps us survive by forming internal representations of the external world1,2. Excitatory cortical neurons are often precisely tuned to specific external stimuli3,4. However, inhibitory neurons, such as parvalbumin-positive (PV) interneurons, are generally less selective5. PV interneurons differ from excitatory neurons in their neurotransmitter receptor subtypes, including AMPA (α-amino-3-hydroxy-5-methyl-4-isoxazole propionic acid) receptors (AMPARs)6,7. Excitatory neurons express calcium-impermeable AMPARs that contain the GluA2 subunit (encoded by GRIA2), whereas PV interneurons express receptors that lack the GluA2 subunit and are calcium-permeable (CP-AMPARs). Here we demonstrate a causal relationship between CP-AMPAR expression and the low feature selectivity of PV interneurons. We find low expression stoichiometry of GRIA2 mRNA relative to other subunits in PV interneurons that is conserved across ferrets, rodents, marmosets and humans, and causes abundant CP-AMPAR expression. Replacing CP-AMPARs in PV interneurons with calcium-impermeable AMPARs increased their orientation selectivity in the visual cortex. Manipulations to induce sparse CP-AMPAR expression demonstrated that this increase was cell-autonomous and could occur with changes beyond development. Notably, excitatory-PV interneuron connectivity rates and unitary synaptic strength were unaltered by CP-AMPAR removal, which suggested that the selectivity of PV interneurons can be altered without markedly changing connectivity. In Gria2-knockout mice, in which all AMPARs are calcium-permeable, excitatory neurons showed significantly degraded orientation selectivity, which suggested that CP-AMPARs are sufficient to drive lower selectivity regardless of cell type. Moreover, hippocampal PV interneurons, which usually exhibit low spatial tuning, became more spatially selective after removing CP-AMPARs, which indicated that CP-AMPARs suppress the feature selectivity of PV interneurons independent of modality. These results reveal a new role of CP-AMPARs in maintaining low-selectivity sensory representation in PV interneurons and implicate a conserved molecular mechanism that distinguishes this cell type in the neocortex.


Conflict of interest statement

Competing interests The authors declare no competing interests.

Figures

Fig. 1
Fig. 1. GluA2 expression in PV interneurons alters orientation selectivity in the L2/3 of the mouse visual cortex.
a, Strategy to selectively remove CP-AMPARs in PV neurons. CDS, coding sequence. b, Relative GluA2 protein expression in PV and CaMKIIα neurons (left to right: n = 25, 22 and 13 pairs from 4, 4 and 4 slices, 3, 3 and 3 mice, respectively; P = 3.961 × 10−7, Kruskal–Wallis one-way ANOVA; P < 0.0001 for all PV-Cre;lsl-eGFP-GluA2 post hoc comparisons, Dunn’s multiple comparison correction). NS, not significant; WT, wild type. c, Relative GluA1 expression (left to right: n = 14, 22 and 17 pairs from 3, 3 and 3 slices, 3, 3 and 3 mice, respectively; P = 4.845 × 10−5, one-way ANOVA; P < 0.001 for all eGFP-GluA2 group post hoc comparisons, Tukey’s multiple comparison correction). Data are mean ± s.e.m. d, The low AMPAR rectification index in PV control neurons (lsl-eGFP, 0.298 ± 0.044) is increased in PV-Cre;lsl-eGFP-GluA2 mice (0.823 ± 0.047) to levels comparable with pyramidal neurons (0.763 ± 0.056) recorded for comparison (left to right: n = 17, 19 and 14 cells from 4, 3 and 2 mice, respectively; P = 4.056 × 10−10, one-way ANOVA test; P < 0.0001 for all post hoc comparisons with PV-Cre;lsl-eGFP mice, Tukey’s multiple comparison correction), thereby indicating the removal of CP-AMPARs. e, Mice were head-fixed and visually stimulated during 2P imaging of the V1. f, Neuronal soma activity traces. Pink rectangles denote the 4-s visual stimulation period and 1.2, 1.0 and 1.0 ΔF/F for each group. Grey shading corresponds to s.e.m. Whole screen drifting grating stimulation in 12 different directions was used to assess orientation selectivity. Red arrows mark the drifting direction. g, CaMKIIα neurons in CaMKIIα-Cre mice and PV neurons in PV-Cre;lsl-eGFP-GluA2 group displayed higher OSI values than in PV neurons in PV-Cre;lsl-eGFP controls (left to right: n = 202, 215 and 197 visually positive responsive neurons of 291, 316 and 395 total neurons from 3, 6 and 7 mice, respectively; χ22 = 175.67, P = 7.154 × 10−39, Kruskal–Wallis one-way ANOVA; P < 0.0001, Dunn’s multiple comparison correction). h, The CaMKIIα-Cre group and the PV-Cre;lsl-eGFP-GluA2 group displayed higher direction selectivity index (DSI) values than the PV-Cre;lsl-eGFP controls (χ22 = 50.76, P = 9.517 × 10−12, Kruskal–Wallis one-way ANOVA; P < 0.0001). i, Normalized (norm.) average response profile of all positively responding neurons from each group aligned to their preferred stimulus direction (0°). A prominent peak is also present at +180° owing to the orientation selective nature of V1 neurons. Responses are plotted as the mean ± s.e.m.
Fig. 2
Fig. 2. Sparse GluA2 expression in L2/3 PV interneurons increases their orientation and direction selectivity.
a, Pre-injected mice were head-fixed and visually stimulated during 2P imaging of the V1 to reveal differences in tuning. b, Representative traces of neurons infected with AAV-DIO-eGFP or AAV-DIO-SEP-GluA2. Pink regions denote the 4-s visual stimulation period and 0.6, 0.5 and 0.5 ΔF/F for each group. Drifting grating stimulation was used to assess orientation selectivity. Red arrows mark the drifting direction. c, The SEP-GluA2 group displayed higher orientation selectivity than eGFP controls, whereas the SEP-GluA2Q group did not show increased OSI (left to right: n = 252, 184 and 132 visually responsive neurons of 325, 267 and 161 total neurons from 7, 7 and 5 mice, respectively; χ22 = 41.68, P = 8.892 × 10−10, one-way ANOVA; P < 0.0001 for eGFP versus SEP-GluA2; P = 0.9863 for eGFP versus SEP-GluA2Q, Dunn’s multiple comparison correction). d, Similarly, the SEP-GluA2 group displayed higher direction selectivity than the eGFP control group, whereas the SEP-GluA2Q group did not show higher DSI values (P = 9.843 × 10−4, χ22 = 13.85, Kruskal–Wallis one-way ANOVA; P = 0.0006 for eGFP versus SEP-GluA2; P = 0.5195 for eGFP versus SEP-GluA2Q). e, Normalized average response profile of all positively responding neurons aligned to their preferred stimulation (0°). Responses are plotted as the mean ± s.e.m.
Fig. 3
Fig. 3. GluA2 homozygous knockout leads to decrease of selectivity in excitatory neurons.
a, Pre-injected GluA2-knockout (Gria2–/–) and littermate wild-type (Gria2+/+) mice were head-fixed and visually stimulated during 2P imaging of the V1 to reveal differences in tuning. b, Representative traces of Gria2+/+ and Gria2–/– excitatory neurons. Pink regions denote the 4-s visual stimulation period and 1.5 ΔF/F for both groups. Whole screen drifting grating stimulation with 12 different orientations was used to assess orientation selectivity. Red arrows mark the drifting direction. c, Quantification of orientation selectivity shows a significantly lower OSI in Gria2–/– neurons than in wild-type controls (left to right: n = 504 and 340 from 3 and 3 mice, respectively; P = 8.733 × 10−7, Mann–Whitney U-test). d, The Gria2–/– group also displayed lower direction selectivity (P = 3.552 × 10−7, Mann–Whitney U-test). e, Normalized average response profile of all positively responding neurons aligned to their preferred stimulation (0°). Responses are plotted as the mean ± s.e.m.
Fig. 4
Fig. 4. Increased spatial tuning of hippocampal PV interneurons after expression of GluA2.
a, Experimental schematic of the virtual reality (VR) system. b, Time average of fluorescence acquired in vivo for jRGECO1a and SEP-GluA2 or eGFP. Scale bar, 100 μm. c, Ca2+ activity traces (black) and mouse position in virtual reality linear track (blue) over time. d, Normalized average spatial response profile of hippocampal CA1 PV neurons expressing SEP-GluA2 (green) or eGFP (magenta) aligned to the location of their peak activation. Responses are plotted as the mean ± s.e.m. Thin lines denote individual cells. e, Spatial tuning-vector lengths (Extended Data Fig. 15c) of PV neurons transfected with SEP-GluA2 were significantly higher than GFP controls (left to right: n = 583 and 476 cells from 4 and 4 mice, respectively; P = 1.472 × 10−14, Wilcoxon rank-sum test). f, Spatial coherence was also higher in the SEP-GluA2 group (P = 1.532 × 10−26, Wilcoxon rank-sum test). Black lines in e and f denote the mean ± s.e.m., and the red dotted line denotes the median. Dots denote values for individual cells.
Fig. 5
Fig. 5. Mathematical models of the impact of CP-AMPAR removal on selectivity.
a, Feed-forward network architecture of a PV neuron (circle) receiving inputs from pyramidal cells (Pyr; triangles, n = 64). Insets depict tuning curves. b, Pyramidal–PV connectivity depends on the difference between the preferred orientation of the PV neuron and the pyramidal cell in question. c, Tuning of pyramidal and PV responses. OSI: 0.73 (Pyr) and 0.44 (PV). Rates are normalized by their maximum for visual comparison. d, Rate-dependent weight reduction as a model of CP-AMPAR-dependent inward rectification in control PV-Cre;lsl-eGFP neurons (magenta), parametrized by a maximum amplitude A and a midpoint M. The removal of CP-AMPARs and inward rectification in PV-Cre;Isl-eGFP-GluA2 mice is modelled by removing the rate dependence of the synaptic weights (green). e, Removal of CP-AMPARs decreases responses to non-preferred stimuli but not to preferred stimuli, thereby increasing stimulus selectivity. OSI with and without CP-AMPARs: 0.48 and 0.59, respectively. f, As for e, but normalized. g, Orientation selectivity increases for most combinations of amplification and midpoint. Dot shows the example shown in e and f (A = 1.6, M = 4). h, Bienenstock–Cooper–Munro plasticity rule. PV rates below the threshold cause LTD, whereas PV rates above the threshold cause LTP. Exaggerated LTD is modelled by increasing the threshold (magenta, 8 Hz; green, 12 Hz). i,j Increased LTD sharpens the pyramidal–PV connectivity (i) and increases PV selectivity (j). OSI with baseline and increased LTD: 0.58 and 0.69, respectively. k, Orientation selectivity increases with the threshold as long as this threshold is within the range of PV responses (between about 6 and 11 Hz).
Extended Data Fig. 1
Extended Data Fig. 1. RNA editing at the Gria2 Q/R site is largely complete across many cortical cell types.
a, A-to-I RNA editing rates at the Gria2 R/G site. Editing rates [G/(A + G)] were stratified according to the cell types defined in Tasic et al. Each dot represents the editing rate in a single cell. The number of samples (cells) is noted in each panel. b, A-to-I RNA editing rates at the Gria2 Q/R editing site. Due to high concentration of data points near 1 (complete RNA editing) in this panel, many violin symbols were not visible, and single data points were jittered by 0.05 along the y-axis to aid visualization.
Extended Data Fig. 2
Extended Data Fig. 2. Immunohistochemical validation of anti-GluA2 and anti-GluA1 antibodies.
a-d, Immunohistochemical staining of GluA2 in GluA2−/− knockout mice (KO, b), wild-type littermates (WT, a), staining of GluA1 in GluA1−/− knockout mice (KO, d), and wild-type littermates (WT, c). Images of hippocampus and visual cortex were taken at 20x magnification. Scale bars, 200 μm.
Extended Data Fig. 3
Extended Data Fig. 3. Selective low expression of GluA2 and Gria2 in PV and SST interneurons in mice, marmosets, and humans.
a, Immunohistochemical staining of PV and GluA2 in visual cortex layer 2/3. PV interneurons (asterisks) show markedly lower GluA2 expression compared to CaMKIIα excitatory counterparts. Layer 2/3 of visual cortex, scale bars, 10 μm. b, Quantification of relative GluA2 expression as a ratio of PV/CaMKIIα neurons (mean ± SEM) shows that PV interneurons express significantly less GluA2 (PV: 0.62 ± 0.03-fold vs CaMKIIα; n = 15 neuron pairs from 3 slices, 3 mice; P = 1.605x10⁻⁸, 1-sample t-test). c, GluA2 expression in PV interneurons and CaMKIIα excitatory neurons in the marmoset cortex. Scale bars, 10 μm. d, Marmoset PV interneurons express significantly less GluA2 compared to nearby CaMKIIα neurons (PV: 0.63 ± 0.03-fold vs CaMKIIα; n = 22 pairs from 7 slices, 3 marmosets, P = 1.062x10⁻¹⁰, one sample t-test). Bars and error bars denote mean ± SEM. e-g. High expression of GluA1 and low expression of GluA2 protein in PV interneurons. e, Immunohistochemical staining of PV, GluA1, and GluA2 in layer 2/3 of mouse visual cortex. PV interneurons (arrows) show markedly lower GluA2 expression, and higher GluA1 expression compared to all other neurons (all GluA1+ or GluA2+ and DAPI+ cells). Scale bar, 100 μm. f, Quantification of GluA1 expression (mean ± SEM) shows that PV interneurons express significantly more GluA1 (other neurons: 1.00 ± 0.02, n = 203 neurons/3 slices/3 mice; PV interneurons: 1.68 ± 0.10, n = 33 neurons; P = 2.319−25, unpaired t-test). g, Quantification of GluA2 expression (mean ± SEM) shows that PV interneurons express significantly less GluA2 (other neurons: 1.00 ± 0.02; PV interneurons: 0.66 ± 0.04; P = 5.861x10⁻⁹, unpaired t-test).
Extended Data Fig. 4
Extended Data Fig. 4. Conserved low expression of Gria2 mRNA in PV/SST interneurons across mammalian species, and potential co-regulation of Gria1-4 mRNA expression in PV interneurons.
a, Analysis of Smart-seq single-cell RNA-seq data from the visual cortex of p56 mice shows distinctly lower expression of Gria2 mRNA in PV and SST interneurons (n = 756/270/178/185/118 neurons from VGLUT1/PV/SST/VIP/Other cell types, respectively, χ(4)2 = 610.9, P < 1.000x10⁻¹⁵, KW 1-way ANOVA; P < 0.0001 for all VGLUT1 post-hoc comparisons, Dunn’s multiple comparison correction). A fraction of outlier cells was omitted for visualization. Conventional marker protein names are adapted to denote cardinal neuronal cell classes (VGLUT1 neurons and CaMKIIα neurons both refer to forebrain excitatory neurons). Post-hoc comparisons with the ‘others’ group are omitted for brevity. b, c, This low expression of Gria2 contributes to the lower ratio of calcium impermeable/calcium permeable AMPAR subunits (R/Q subunit ratio) both in mice (b) and in humans (c). In both (b) and (c), a KW 1-way ANOVA test reveals a significant difference (mice: χ(4)2 = 593.6, P < 1.000x10⁻¹⁵; humans: χ(4)2 = 491.9, P < 1.000x10⁻¹⁵), and post-hoc comparisons demonstrate significant differences between all non-‘others’ pairs except VGLUT vs. VIP (panel c shows human data from n = 2151/235/193/282/181 neurons from VGLUT1/PV/SST/VIP/Other cell types, respectively). Post-hoc comparisons with the ‘others’ group are omitted for brevity. Thick center lines and dotted lines in violin plots represent median and 25–75% interquartile range, respectively. d-g, Potential co-regulation of Gria1-4 mRNA expression in PV interneurons. d, Single-cell mRNA expression of Gria2 in PV neurons showed a strong correlation (ρ = 0.18208, n = 270 cells) with the sum of Gria1, Gria3, Gria4 mRNA expression, which was highly significant compared to a bootstrap randomized distribution (100,000 shuffles across PV neurons, P = 0.0019). The Monte Carlo P-value was determined by comparing the observed correlation statistic to the simulated distribution. e, The correlation between Gria2 expression and the sum of Gria1, Gria3, Gria4 expression in PV neurons was also highly significant compared to the distribution of correlations of Gria1 + 2 + 3 with all other genes (top 0.45 percentile, P = 0.0046). f, g, This correlation was not present in the entire neuron population (n = 1517 cells, ρ = −0.027802; P = 0.1381 in comparison to shuffled neuron data; P = 0.25012 in comparison to the correlation of Gria1 + 2 + 3 to all other genes beyond Gria2). These results suggest a tight co-regulation of Gria2 vs. Gria1 + 3 + 4 mRNA expression ratio unique to PV interneurons. h-l, Conserved low expression of Gria2 mRNA in PV/SST interneurons across mammalian species. Analysis of Drop-seq single-cell RNA-seq data from the cortex of (h) ferrets (n = 1 replicates), (i) mice (n = 3 replicates), (j) marmosets (n = 3/2/2/2/2 replicates), (k) macaques (n = 2 replicates), and (l) humans (n = 2 replicates) shows a conserved lower ratio of calcium impermeable/calcium permeable AMPAR subunits (R/Q form ratio) in PV and SST interneurons. VGLUT1 cells correspond to cortical excitatory neurons (CaMKIIα), and ID2 correspond to neurogliaform cells. Bars and error bars denote mean ± SD of Drop-seq samples, which were averaged within replicates.
Extended Data Fig. 5
Extended Data Fig. 5. Development and characterization of a Rosa26 knock-in mouse to conditionally express eGFP-tagged GluA2 in a Cre-dependent manner.
a, To enable robust expression of eGFP-GluA2, we used a strong ubiquitous CMV-βactin hybrid (CAG) promoter (consisting of three gene regulatory elements: 5′ cytomegalovirus early enhancer element, chicken β-actin promoter and rabbit β-globin intron) and added a woodchuck hepatitis virus posttranscriptional regulatory element (WPRE) at the 3′ end of the eGFP-GluA2 coding sequence. The WPRE sequence allows rapid exit of mRNA from the nucleus and increases the mRNA stability in the cytosol. For inducible expression of eGFP-GluA2, a “stopper” cassette consisting of loxP-flanked 3X SV40 polyA (loxP-STOP-loxP, “lsl”) was placed upstream of the coding sequence, preventing expression until cyclic recombinase (Cre)-dependent excision. A Neomycin resistance cassette (NeoR) flanked by Flippase Recognition Target sequences (FRT) was present in the targeting vector to allow for selection. To prevent gene-silencing effects and ensure consistent and long-term expression of these transgenes in all cell types, the CAG-driven inducible eGFP-GluA2 transgenic constructs were targeted to the ubiquitously expressed Rosa26 locus. For homologous recombination in mouse embryonic stem (ES) cells, the gene-targeting vector was assembled into a ROSA26 targeting plasmid containing a 1.2 kb 5′ homology arm, 4.3 kb 3′ homology arm, and PGK-DTA (Diphtheria toxin fragment A, downstream of 3′ homology arm) for negative selection. ES cells, derived from a SV129 mouse strain, were electroporated with the AsiSI-linearized targeting vectors. A nested PCR screening strategy along the 5′ homology arm was used to identify ES cell clones harboring the correct genomic targeting event. After verification of homologous recombination by Southern blot analysis and confirmation of the karyotypes, correctly targeted ES cell clones were used to generate chimeric mice by injection into blastocysts derived from SV129 females at the Johns Hopkins University Transgenic Core. Germline transmission was achieved by breeding male chimeric founders to C57BL/6 N wild-type female mice. The FRT-NeoR cassette was removed by breeding to a transgenic FLPe mouse line. b-j, Transgenic expression of GluA2 in PV interneurons mimics excitatory neuron GluA2 expression levels (related to Fig. 2b,c). b-d, Representative data for Fig. 1b. Immunohistochemical staining of GluA2 expression in PV interneurons and excitatory neurons. PV interneurons are marked by white asterisks and display negative CaMKIIα staining. Images were acquired in layer 2/3 of visual cortex. Scale bars, 15 μm. e-g, Representative data for Fig. 1c. Immunohistochemical staining of GluA1 expression in PV interneurons and excitatory neurons. Scale bars, 15 μm. h-j, Concordance of conditionally expressed eGFP and eGFP-GluA2 with PV immunostaining. h, i, Immunohistochemical staining of PV interneurons in mouse visual cortex. Scale bars, 100 μm. j, Quantification of conditional expression concordance in PV interneurons. In both PV-Cre;lsl-eGFP and PV-Cre; lsl-eGFP-GluA2 mouse lines, the ratio of PV+ cells among GFP+ cells and GFP+ cells among PV+ cells was high (n = 6/6 slices for each genotype; PV-Cre;lsl-eGFP mice: PV + /GFP + = 93.8 ± 2.7%, GFP + /PV + = 78.3 ± 8.3%; PV-Cre;lsl-eGFP-GluA2 mice: PV + /GFP + = 85.0 ± 5.1%, GFP + /PV + = 90.7 ± 4.0%). Bars and error bars denote mean ± SEM.
Extended Data Fig. 6
Extended Data Fig. 6. Transgenic expression of GluA2 in PV interneurons does not alter PV/SST interneuron density.
a-c, Visual cortex immunohistochemical staining of PV/SST interneurons. Layer segmentation was based on marker gene expression staining in V1 of internal and Allen Brain Atlas mouse brain sections. Scale bars, 100 μm. d-f, Quantification of GFP +, PV +, and SST+ cell density in cortical layers. PV and SST neuron density did not significantly change in PV-Cre;lsl-eGFP or PV-Cre;lsl-eGFP-GluA2 mice (n = 5/5/5 slices, 3/3/3 mice, 2-way ANOVA, P > 0.05 for all post-hoc comparisons, Šídák’s multiple comparison correction). Bars and error bars denote mean ± SEM.
Extended Data Fig. 7
Extended Data Fig. 7. Conditional transgenic/AAV expression of GluA2 in PV interneurons reduces calcium-permeable AMPARs.
Related to Figs. 1d and 2. a-b, Epi-fluorescence microscopy overlaid upon IR-DIC images of PV-Cre;lsl-eGFP and PV-Cre;lsl-eGFP-GluA2 mice. Scale bars, 20 μm. Layer 2/3 eGFP+ neurons in the visual cortex of PV-Cre;lsl-eGFP and PV-Cre;lsl-eGFP-GluA2 mice were targeted for whole cell patch clamp and rectification measurement. c, Example AMPAR-EPSC traces (Vh = −60 mV to 60 mV in 10 mV increments and in the presence of 100 μM AP5) from eGFP or eGFP-GluA2-expressing PV interneurons. Scale bars, 20 pA, 10 ms. d-f, Plot of the average I-V relationship for the AMPAR EPSC peak amplitudes of all recorded neurons (mean ± SEM). Red dotted lines denote the uncorrected junction potential (~11 mV). Black dotted lines indicate the expected linear I-V relationship from non-rectifying AMPARs to reveal deviations from linearity. Pyramidal neurons were recorded identically for comparison except for a subset which were measured from Vh = −60 mV to 50 mV. Note that PV control neurons (PV-Cre;lsl-eGFP) display inwardly rectifying AMPAR currents partially reminiscent of the doubly-rectifying CP-AMPAR currents reported previously in heterologous cells,, and additionally display a higher reversal potential, suggesting an alteration of AMPAR channel pore selectivity in cortical PV interneurons. g-m, AAV-mediated Cre-dependent expression of SEP-GluA2 and SEP-GluA2Q in PV interneurons bidirectionally regulates calcium-permeable AMPAR expression (related to Fig. 2). g, Confocal micrograph of a primary cultured excitatory cortical neuron transfected with FUW-Cre and pAAV-hSyn1-DIO-SEP-GluA2 plasmids. h, In vivo two-photon micrograph of a cortical PV interneuron infected with AAV2/9-hSyn1-DIO-SEP-GluA2. Scale bars: 20 µm. i, In mice injected with 3 different AAVs, layer 2/3 GFP+ visual cortex neurons were targeted for whole cell patch clamp and AMPAR rectification measurement. Data are presented as mean values ± SEM. Expression of the calcium-impermeable (wild-type) GluA2 subunit (AAV-DIO-SEP-GluA2) relieved AMPAR rectification and increased the rectification index compared to the control group (AAV-DIO-GFP). In comparison, the expression of the calcium-permeable mutant GluA2Q subunit (AAV-DIO-SEP-GluA2Q) resulted in further rectifying AMPAR currents and a lower rectification index (n = 6/17/10 cells from 2/2/3 mice, P < 0.0001, 1-way ANOVA test; P = 0.003 for AAV-DIO-eGFP vs. AAV-DIO-SEP-GluA2, P = 0.048 for AAV-DIO-eGFP vs. AAV-DIO-SEP-GluA2Q, P < 0.0001 for AAV-DIO-SEP-GluA2 vs. AAV-DIO-SEP-GluA2Q, Tukey’s multiple comparison correction). j, Example AMPAR-EPSC traces (Vh = −60 mV to 60 mV in 10 mV increments and in the presence of 100 μM AP5) from AAV-expressing PV interneurons. Scale bars, 20 pA, 10 ms. k-m, Plot of the average I-V relationship for the AMPAR EPSC peak amplitudes of all recorded neurons. Red dotted lines denote the uncorrected junction potential (~11 mV). Black dotted lines indicate the expected linear I-V relationship from non-rectifying AMPARs to reveal deviations from linearity.
Extended Data Fig. 8
Extended Data Fig. 8. Awake head-fixed two photon imaging of the visual cortex reveals visual representation changes induced by Cre-dependent eGFP-GluA2 expression in PV interneurons.
a, Reinforced headposts with light-proofing rings to allow visual stimulation during two photon imaging. b, Circular treadmill for head-fixed awake imaging. The frame is mounted on a pair of goniometers to allow arbitrary tilt correction. c, Venn diagram displaying the hierarchical grouping of visual cortex units based on the responsivity to drifting grating stimuli and valence of largest response. Blue arrows indicate the level at which each analysis or visualization is carried out. d, Epifluorescence image of mouse visual cortex through an implanted cranial window (left) and two-photon imaging within the monocular V1 area (right). Scale bar, 20 μm. e, Experimental schedule. f, Fraction of neurons with statistically significant visual response in CaMKIIα or PV interneurons in each group (0.85, 0.79, 0.76; n = 395/316/355 neurons from 3/6/7 mice, χ(2)2 = 8.4242, dF = 2, P = 1.487x10⁻², Chi-square test). g, Average response amplitudes (∆F/F, mean ± SEM) of each group. CaMKIIα+ neurons in the CaMKIIα-Cre mice displayed higher amplitude preferred responses compared to PV interneurons in the PV-Cre;lsl-eGFP and PV-Cre;lsl-eGFP-GluA2 group (n = 202/215/197 neurons, χ(2)2 = 96.78, P = 9.663×10⁻²², KW 1-way ANOVA; P < 0.0001 for all post-hoc comparisons with CaMKIIα-Cre, Dunn’s multiple comparison correction). h-j, Waterfall plots displaying the overall visual response profile of the population of visually responsive neurons with positive preferred stimulus responses in the (h) CaMKIIα-Cre, (i) PV-Cre;lsl-eGFP, (j) PV-Cre;lsl-eGFP-GluA2 groups. k-n, Mouse-level statistics confirm that removal of CP-AMPARs in PV interneurons increases feature selectivity in layer 2/3 of mouse visual cortex. k, CaMKIIα neurons in the CaMKIIα-Cre mice displayed higher orientation selectivity compared to PV interneurons in PV-Cre;lsl-eGFP mice, and the PV-Cre;lsl-eGFP-GluA2 group showed higher OSI than PV-Cre;lsl-eGFP controls (n = 3/6/7 mice, P = 0.0005, one-way ANOVA; P = 0.0111 for PV-Cre;lsl-eGFP vs. PV-Cre;lsl-eGFP-GluA2 and P = 0.0005 for CaMKIIα-Cre vs. PV-Cre;lsl-eGFP, Tukey’s multiple comparison correction). l, The PV-Cre;lsl-eGFP-GluA2 group showed higher DSI than PV-Cre;lsl-eGFP controls (P = 0.0278, one-way ANOVA; P = 0.0315 for PV-Cre;lsl-eGFP vs. PV-Cre;lsl-eGFP-GluA2). m, Fraction of neurons with statistically significant visual response in CaMKIIα or PV interneurons in each group were not different (0.86, 0.71, 0.71; n = 3/6/7 mice, P = 0.4016, one-way ANOVA). n, Average response amplitudes (∆F/F) of each group. CaMKIIα+ neurons in the CaMKIIα-Cre mice displayed higher amplitude preferred responses compared to PV interneurons in the PV-Cre;lsl-eGFP and PV-Cre;lsl-eGFP-GluA2 group (n = 3/6/7 mice, P < 0.0001, one-way ANOVA; P = 0.0001 for CaMKIIα-Cre vs. PV-Cre;lsl-eGFP and P = 0.0004 for CaMKIIα-Cre vs. PV-Cre;lsl-eGFP-GluA2, Tukey’s multiple comparison correction).
Extended Data Fig. 9
Extended Data Fig. 9. Visual representation changes induced by sparse viral SEP-GluA2 expression in PV interneurons.
a, AAV-infected layer 2/3 PV interneurons within the monocular V1 area. Scale bar, 50 μm. b, The fraction of neurons with significant visual responses in each group (n = 325/267/161 total neurons from 7/7/5 mice, χ2 = 11.09, dF = 2, P = 0.0039, Chi-square test). c, The average response amplitude (∆F/F, mean ± SEM) of each group was not statistically different (n = 252/184/132 neurons, χ(2)2 = 0.5550, P = 0.7578, KW 1-way ANOVA). d-f, Waterfall plots displaying the overall visual response profile of the population of visually responsive neurons with positive preferred stimulus responses in the (d) PV-Cre;AAV-DIO-eGFP, (e) PV-Cre;AAV-DIO-SEP-GluA2, (f) PV-Cre;AAV-DIO-SEP-GluA2Q groups. g-j, Mouse-level statistics confirm that removal of CP-AMPARs in PV interneurons increases feature selectivity in layer 2/3 of mouse visual cortex. g, The SEP-GluA2 group displayed higher orientation selectivity compared to eGFP controls, whereas the SEP-GluA2Q group did not show increased OSI (n = 7/7/5 mice, P = 0.0401, one-way ANOVA; P = 0.0385 for eGFP vs. SEP-GluA2, P = 0.8307 for eGFP vs. SEP-GluA2Q, Tukey’s multiple comparison correction). h, Similarly, the SEP-GluA2 group displayed higher direction selectivity compared to the eGFP control group, whereas the SEP-GluA2Q group failed to show higher DSI (n = 7/7/5 mice, P = 0.0348, one-way ANOVA; P = 0.0318 for eGFP vs. SEP-GluA2, P = 0.7699 for eGFP vs. SEP-GluA2Q). i, Fraction of neurons with statistically significant visual response in each group were not different (0.86, 0.76, 0.89; n = 7/7/5 mice, P = 0.2247, one-way ANOVA). j, Average preferred response amplitudes (∆F/F) of each group were not statistically different (n = 7/7/5 mice, P = 0.7319, one-way ANOVA). k, The SEP-GluA1Q582R group showed a significantly higher OSI (mean ± SEM) compared to the SEP-GluA1 group (n = 42/49 neurons from 44/68 total neurons from 3/3 mice, P < 0.0001, unpaired t-test). l, The DSI (mean ± SEM) was not significantly different (P < 0.1648, Mann-Whitney U-test). m, The fraction of neurons with significant visual responses in each group was different (0.95/0.79; n = 44/68 total neurons from n = 3/3 mice, χ2 = 5.615, dF = 1, P = 0.0178, Chi-square test). n, The average response amplitude (∆F/F) of each group (mean ± SEM) was not significantly different (n = 42/49 neurons from 3/3 mice, P = 0.6076, Mann-Whitney U-test).
Extended Data Fig. 10
Extended Data Fig. 10. Synaptic connectivity, plasticity, and intrinsic excitability of PV interneurons in PV-Cre;lsl-eGFP and PV-Cre;lsl-eGFP-GluA2 mice.
Recording configurations (top), representative action potential traces in presynaptic cells (middle) and voltage response traces in postsynaptic cells (bottom) for Pyr→control PV (a), Pyr→GluA2 PV (b), control PV→Pyr (c), and GluA2 PV→Pyr (d) pairs. e, The probability of connection for tested Pyr→control PV and Pyr→ GluA2 PV connections (Pyr→control PV: 36.7%, n = 22 of 60 tested connections; Pyr→GluA2 PV: 36.8%, n = 21 of 57 tested connections, P = 1, Fisher’s exact test). f, The amplitudes of the unitary excitatory postsynaptic potentials (uEPSPs) of connected pairs (Pyr→control PV: 1.22 ± 0.30 mV, n = 22 pairs; Pyr→GluA2 PV: 0.76 ± 0.17 mV, n = 21 pairs; P = 0.17702, Mann-Whitney U test). g, The paired-pulse ratio (PPR) for connected pairs (Pyr→control PV: 1.02 ± 0.08, n = 22 pairs; Pyr→GluA2 PV: 1.11 ± 0.08, n = 21 pairs; P = 0.13104, Mann-Whitney U test). h, The probability of connection for tested control PV→Pyr and GluA2 PV→Pyr connections (PV→Pyr: 45%, n = 27 of 60 tested connections; GluA2 PV→Pyr: 43.9%, n = 25 of 57 tested connections, P = 1, Fisher exact test). i, The amplitudes of the unitary inhibitory postsynaptic potentials (uIPSPs) of connected pairs (PV→Pyr: 0.68 ± 0.12 mV, n = 27 pairs; GluA2 PV→Pyr: 0.64 ± 0.14 mV, n = 25 pairs; P = 0.75656, Mann-Whitney U test). j, The paired-pulse ratio (PPR) for connected pairs (PV→Pyr: 0.48 ± 0.03, n = 27 pairs; GluA2 PV→Pyr: 0.56 ± 0.04, n = 25 pairs; P = 0.0394, Mann-Whitney U test). k, Representative EPSP traces measured before (black, average of 50 traces) and after (red, average of last 20 traces) anti-Hebbian (AH) plasticity induction (400 presynaptic action potentials at 5 Hz paired with hyperpolarization of postsynaptic PV interneurons to −90 mV). The time points of the presynaptic action potentials for measuring EPSPs are marked with blue arrows. l, Normalized EPSP amplitude before and after AH plasticity induction (eGFP, n = 7 pairs from 4 mice; eGFP-GluA2, n = 10 pairs from 9 mice). Red arrow indicates the time point of AH plasticity induction. m, A summary graph showing normalized EPSP amplitude of the average of last 20 traces after AH plasticity induction (n = 7/10; eGFP, 92.6 ± 8.1%; eGFP-GluA2, 68.6 ± 6.9%, P = 0.03968, t-test). Representative voltage traces (n), and the current–spike (mean ± SEM) frequency relationship (o) recorded from control and eGFP-GluA2-expressing PV interneurons (for panels n-v, control eGFP: n = 13 cells from 3 mice; eGFP-GluA2: n = 14 cells from 3 mice; P = 0.0025, 2-way ANOVA interaction effect). p, The rheobase measured in GluA2-overexpressing PV interneurons was substantially lower than in control PV interneurons (control, 336.31 ± 31.69 pA; GluA2, 230.00 ± 29.35 pA; P = 0.0209, Mann-Whitney U-test). q, Resting membrane potential (RMP, control, −79.5 ± 1.37 mV; GluA2, −76.9 ± 1.73 mV; P = 0.4413, Mann-Whitney U-test), in the presence of glutamate and GABA receptor blockers (5 µM NBQX, 5 µM (RS)-CPP, and 10 µM SR95531; applies to panels n-v). r, Input resistance (Ri, control, 84.3 ± 7.5 MΩ; GluA2, 111.1 ± 9.7 MΩ; P = 0.0453, Mann-Whitney U-test). s, Action potential threshold (control, −35.7 ± 1.2 mV; GluA2, −39.2 ± 2.0 mV; P = 0.1501, Mann-Whitney U-test). t, Action potential amplitude (control, 49.7 ± 1.9 mV; GluA2, 50.8 ± 4.1 mV; P = 0.509, Mann-Whitney U-test). u, Action potential half-width (control, 0.30 ± 0.01 ms; GluA2, 0.37 ± 0.02 ms; P = 0.01, Mann-Whitney U-test). v, Afterhyperpolarization (AHP, control, 26.4 ± 0.8 mV; GluA2, 23.4 ± 1.1 mV; P = 0.0387, Mann-Whitney U-test). w, Resting membrane potential measured without synaptic glutamate and GABA receptor blockers (RMP; for panels w and x, control eGFP: n = 61 cells; eGFP-GluA2: n = 57 cells; control, −79.5 ± 0.75 mV; GluA2, −77.2 ± 0.58 mV; P = 0.0185, Mann-Whitney U-test). x, Input resistance measured without synaptic glutamate and GABA receptor blockers (Ri, control, 102.5 ± 4.7 MΩ; GluA2, 114.3 ± 4.5 MΩ; P = 0.0762, Mann-Whitney U-test). Data are presented as mean values ± SEM.
Extended Data Fig. 11
Extended Data Fig. 11. FACS-assisted bulk RNA-seq of cortical PV interneurons.
a, Overview of the workflow isolating and analyzing mouse cortex PV interneuron mRNA expression. Fixation-capture single cell RNA recovery-seq (FICSR-seq) was used to recover PV interneurons without substantial loss of PV cells during dissociation. After brain slicing, enzymatic dissociation was followed with fixation in 4% PFA and mechanical dissociation. GFP+/DRAQ5+ cells were isolated using FACS and were treated with proteinase K before RNA extraction which removes RNA-binding proteins and increases the yield of intact RNA. The resulting mRNA was sequenced with paired-end Illumina sequencing and analyzed for differential gene expression. b, Representative gating diagrams and FACS flowchart. DRAQ-5 was used to sort nuclei-containing cells from debris, and singlets are further sorted into GFP+ and GFP- cells. c, d, Bulk RNA-seq reveals ~100-fold enrichment of Pvalb mRNA in GFP+ vs GFP- cell samples (from n = 16/2 mice, mean ± SEM), validating FACS-based isolation of PV interneuron population. TPM stands for transcripts per million. e, Differential gene expression in PV-Cre;lsl-eGFP-GluA2 mice vs. PV-Cre;lsl-eGFP mice (n = 7/9 mice). Gria2 transgenic overexpression is observed (Padj = 4.63×10⁻⁹, Benjamini-Hochberg correction), together with other regulated genes (red).
Extended Data Fig. 12
Extended Data Fig. 12. FACS-assisted bulk RNA-seq of cortical PV interneurons: synaptic gene expression.
a, Gene expression in PV interneurons of each genotype was statistically analyzed with DESeq2 and plotted using TPM (transcripts per million) to visualize expression levels. PV interneurons in PV-Cre;lsl-GFP-GluA2 mice display largely unchanged expression (mean values ± SEM) of major glutamate receptor genes compared to PV-Cre;lsl-eGFP control mice, with the exception of Gria2, which is overexpressed by roughly 2-fold in these mice (n = 9/7 mice; Wald test, Benjamini-Hochberg adjusted P < 0.0001). This is in line with the protein level increases (Fig. 1b) and matches the Gria2 expression level of typical excitatory neurons. b-c, AMPAR/GABAR interactor/postsynaptic regulator genes also display unaltered expression.
Extended Data Fig. 13
Extended Data Fig. 13. FACS-assisted bulk RNA-seq of cortical PV interneurons: intrinsic excitability genes including K+/Na+/Ca2+/Cl- channel gene expression.
Gene expression in PV interneurons of each genotype was statistically analyzed with DESeq2 and plotted using TPM (transcripts per million) to visualize expression levels. PV interneurons in PV-Cre;lsl-GFP-GluA2 mice display largely unchanged expression of (a-c) major K+ channel genes, (d), Ca2+ channel genes (e), and Cl- channel genes (f), compared to PV-Cre;lsl-eGFP control mice compared to PV-Cre;lsl-eGFP control mice (n = 9/7 mice). Data are presented as mean values ± SEM.
Extended Data Fig. 14
Extended Data Fig. 14. Visual representation changes in excitatory neurons induced by global GluA2 homozygous knockout.
a, Two-photon micrograph of AAV-infected layer 2/3 excitatory neurons within monocular V1. Scale bar, 50 μm. b, The fraction of neurons with statistically significant visual responses in each group was not different (0.85/0.86; n = 739/500 neurons from n = 3/3 mice, χ2 = 0.0292, dF = 1, P = 0.8644, Chi-square test). c, The average response amplitude (∆F/F) of each group was not significantly different (n = 504/340 neurons; P = 0.4060, Mann-Whitney U-test). Data are presented as mean values ± SEM. d, e, Waterfall plots displaying the overall visual response profile of the population of visually responsive neurons with positive preferred stimulus responses in the (d) GluA2-WT (+/+), (e) GluA2-KO (−/−) groups. f-i, Mouse-level statistics confirm that homozygous knockout of GluA2 lowers excitatory neuron orientation selectivity in layer 2/3 of mouse visual cortex. f, Quantification of orientation selectivity shows a significantly lower OSI in GluA2 knockouts compared to littermate wildtype (WT) controls (n = 3/3 mice, P = 0.0288, unpaired t-test). g, The GluA2-KO group displays a trend towards lower direction selectivity (n = 3/3 mice, P = 0.0540, unpaired t-test). h, The fraction of neurons with statistically significant visual responses in each group was not different. (n = 3/3 mice, P = 0.5605, unpaired t-test). i, The average response amplitude (∆F/F) of each group was not significantly different (n = 3/3 mice, P = 0.5144, unpaired t-test). Responses are plotted as mean ± SEM. *P < 0.05, **P < 0.01, ***P < 0.001, ****P < 0.0001, n.s., not significant, P ≥ 0.05.
Extended Data Fig. 15
Extended Data Fig. 15. Increased spatial tuning of hippocampal PV interneurons after removal of CP-AMPARs.
a, Raster plots of Ca2+ activity over distance (normalized) for PV interneurons expressing GFP (left) or SEP-GluA2 (right). Activity for cells with significant spatial tuning is shown on top (magenta, green, respectively) and sorted by the peak location of activation. Activity of non-spatially tuned cells is shown below (greyscale). b, Average cross correlation of spatial activity profiles of cells between the first and second half of recording sessions (10 runs each). Note the higher and more consistent correlations of spatial tuning in cells expressing GluA2. c, Left, two representative examples of spatial vector tuning for a GFP (magenta) and SEP-GluA2 expressing (green) PV interneuron. The cell’s activity along the track is projected into a circular coordinate system. The orientation and length of the calculated tuning vector in the center correspond to the tuning direction and specificity, respectively. Right, Average activity profile for all GFP (magenta) or SEP-GluA2 expressing (green) PV interneurons aligned to their preferred orientation (0°). Note the higher asymmetry and stronger vectorial tuning for GluA2 expressing cells. d, Fraction of cells with significant spatial tuning in GFP (magenta) and SEP-GluA2 (green) expressing animals. Dots denote fractions in individual experiments. (n = 8/8 experiments from n = 4/4 mice, P = 0.001, t-test). e, Spatial information normalized to activity (see Methods) for GFP (magenta) and SEP-GluA2 (green) expressing cells. Dots denote individual cells. (n = 583/476 cells from n = 4/4 mice, P = 2.23×10⁻⁸, Wilcoxon rank-sum test). f, Same as in (e) but for spatial map stability (correlation) between the first and second half of the recording session (P = 0.0026, Wilcoxon rank-sum test). g, Same as in (e) but for spatial activity map correlations between individual trials of a session (P = 2.28×10⁻⁹, Wilcoxon rank-sum test). Note the consistently higher stability of spatial representation in PV interneurons expressing GluA2. Black lines in (e-g) denote mean ± SEM, and the red dotted line denotes the median. Dots denote values for individual cells.
Extended Data Fig. 16
Extended Data Fig. 16. Computational modeling: increased intrinsic excitability and CP-AMPAR inward rectification decreases selectivity.
a, PV-Cre;lsl-eGFP-GluA2 mice show intrinsic excitability increase in the form of a shift of the FI curve to lower input currents (Extended Data Fig. 10o). Dashed line: FI curve of PV-Cre;lsl-eGFP mice, shifted by E = 106.03 pA (fit to data). b, Model of increased intrinsic excitability: a shift of the PV cell’s FI-curve. c, Increased excitability causes a uniform increase in stimulus responses, decreasing stimulus selectivity (OSI: 0.44 vs OSI: 0.3). d, Orientation selectivity decreases for any increase in excitability. The decrease is even more pronounced in the presence of downscaled weights, mimicking a potentially decreased weight scale (black line; cf. Extended Data Fig. 10f). Magenta and green dots indicate examples shown in (b), (c). e, A range of increases in excitability, each compensated by a homeostatic synaptic scaling to preserve the mean rate (inset). f, Tuning curves for different levels of increased excitability. g, As (f), but normalized to the maximum response. h, Orientation selectivity monotonically decreases with increasing excitability, even for commensurately decreasing synaptic scaling. i-n, Alternative models of inward rectification. i, Average I-V relationship in calcium permeable (CP) and calcium-impermeable (CI) receptors, measured in excitatory neurons of wild-type and GluA2 knockout mice, respectively, derived from Lu et al. j, Conductance measured from k, estimated as current / voltage. k, Model of voltage or rate-dependent desensitization of inputs, parametrized by the relative portion α of CP versus CI conductances. The conductance in PV-Cre;lsl-eGFP-GluA2 neurons was modeled as CI-AMPARs only (green, CP-AMPAR coefficient λ = 0). The conductance in PV-Cre;lsl-eGFP neurons was modeled as a combination of CI and CP receptors (magenta, CP-AMPAR coefficient λ = 0.8). l, Increased responses to preferred stimuli in simulated PV-Cre;lsl-eGFP-GluA2 neurons. Orientation selectivity index (OSI): 0.49 (eGFP) and 0.55 (GluA2). m, As (d), but normalized by maximum response. n, Orientation selectivity monotonically decreases as the portion of CP-AMPARs λ increases. Dots indicate values used in panels k, l, m.
Extended Data Fig. 17
Extended Data Fig. 17. Summary of findings.
The abundant CP-AMPARs in PV interneurons were removed by ① targeted expression of GluA2, which ② replaces them with CI-AMPARs. This causes several electrophysiological changes (ⓐ-ⓒ) and ③ increases orientation selectivity in the visual cortex or spatial selectivity in the hippocampus. In excitatory forebrain neurons, which primarily have CI-AMPARs, ④ knocking out GluA2 makes all AMPARs ⑤ calcium permeable. This leads to ⑥ lower orientation selectivity. These results collectively demonstrate a strong role of CP-AMPARs in deciding the feature selectivity of a neuron. Computational modeling reveals that of the three cardinal electrophysiological changes we detect with CP-AMPAR removal (green traces), ⓐ increased intrinsic excitability is likely to decrease selectivity (opposite to our findings), whereas ⓑ decreased inward rectification and ⓒ increased anti-Hebbian LTD are likely to increase feature selectivity (consistent with our findings), providing a potential mechanism of the increased orientation selectivity and spatial selectivity after CP-AMPAR removal observed.

References

    1. Olshausen, B. A. & Field, D. J. Sparse coding of sensory inputs. Curr. Opin. Neurobiol.14, 481–487 (2004). - PubMed
    1. Destexhe, A. & Marder, E. Plasticity in single neuron and circuit computations. Nature431, 789–795 (2004). - PubMed
    1. Moser, M. B., Rowland, D. C. & Moser, E. I. Place cells, grid cells, and memory. Cold Spring Harb. Perspect. Biol.7, a021808 (2015). - PMC - PubMed
    1. Niell, C. M. Cell types, circuits, and receptive fields in the mouse visual cortex. Annu. Rev. Neurosci.38, 413–431 (2015). - PubMed
    1. Hu, H., Gan, J. & Jonas, P. Interneurons. Fast-spiking, parvalbumin+ GABAergic interneurons: from cellular design to microcircuit function. Science345, 1255263 (2014). - PubMed

LinkOut - more resources