. 2024 Oct;634(8032):181-190.
doi: 10.1038/s41586-024-07967-z. Epub 2024 Oct 2.

Connectomic reconstruction predicts visual features used for navigation

Affiliations

Connectomic reconstruction predicts visual features used for navigation

Dustin Garner et al. Nature. 2024 Oct.

Abstract

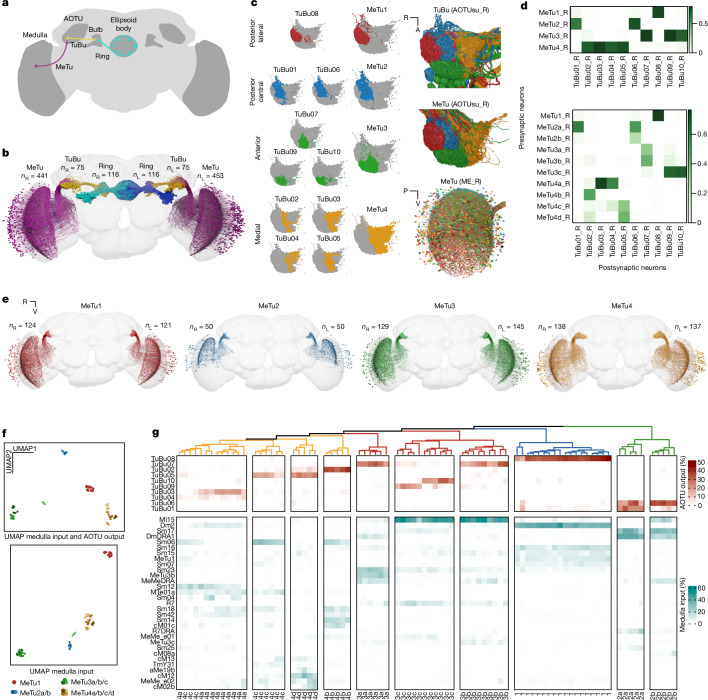
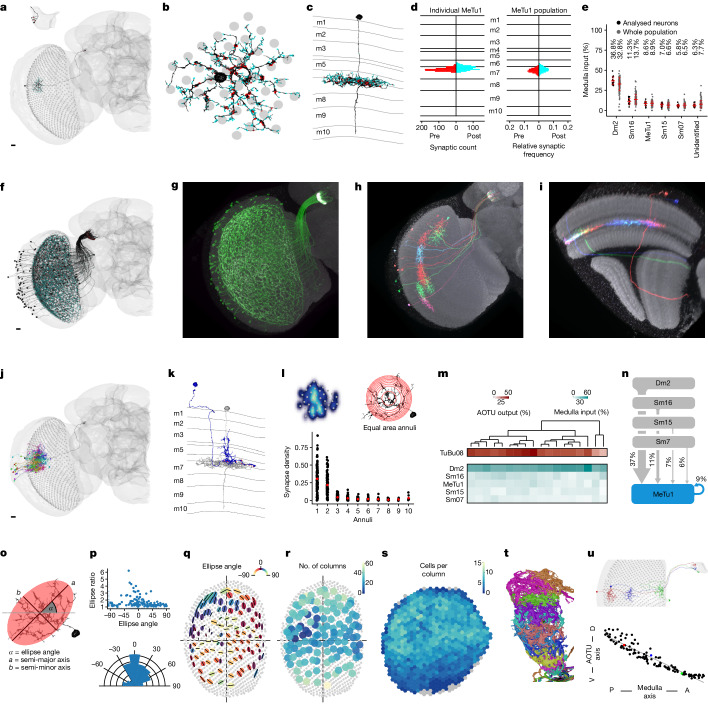
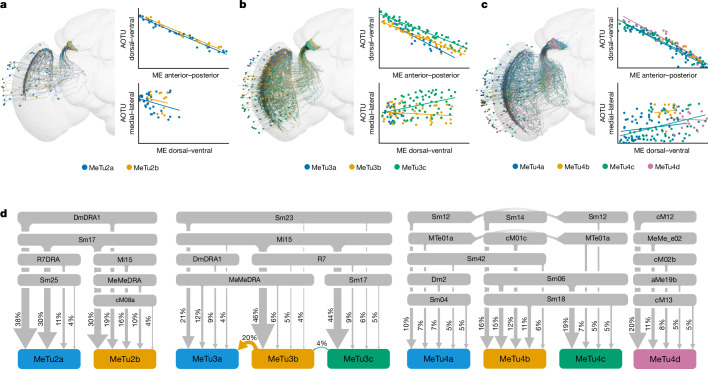
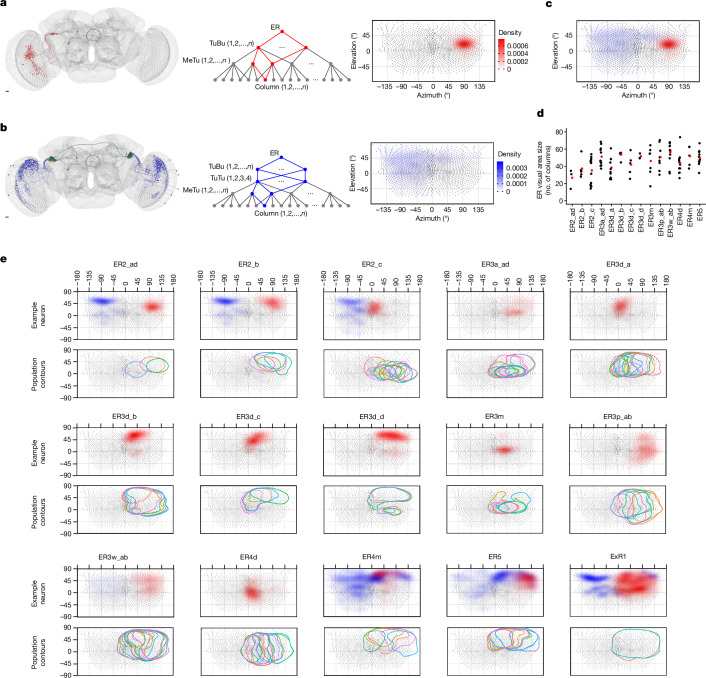
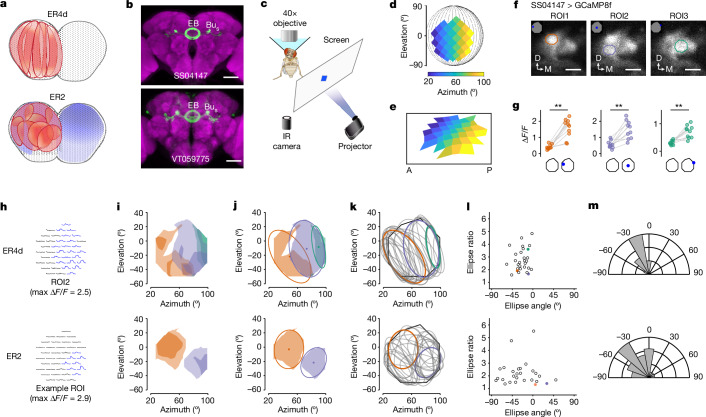
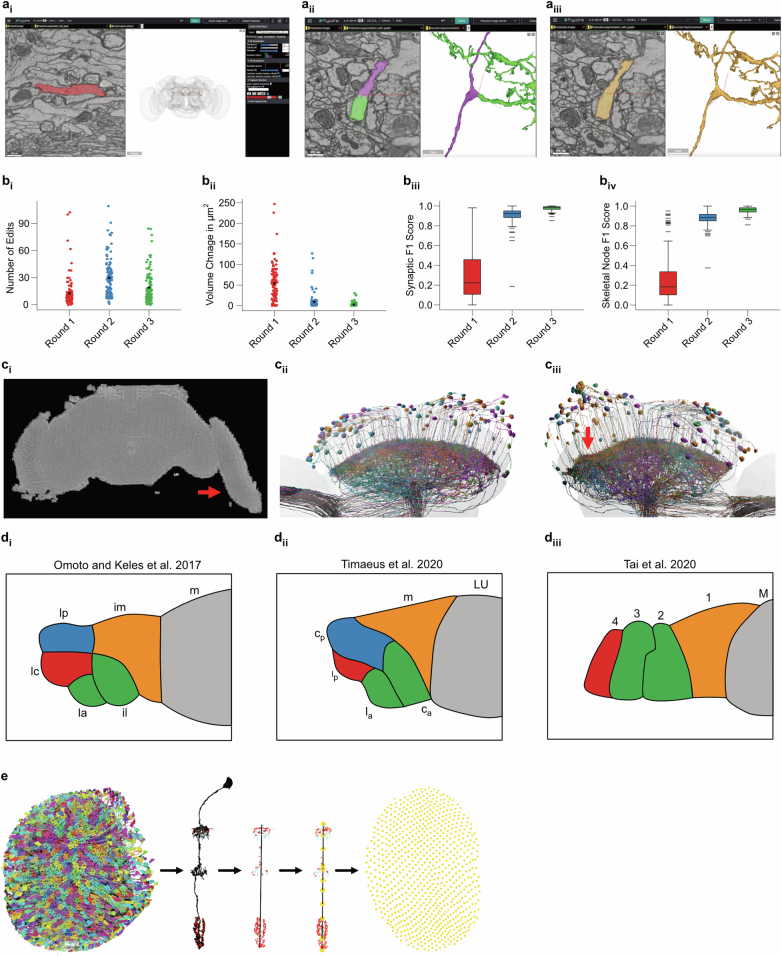
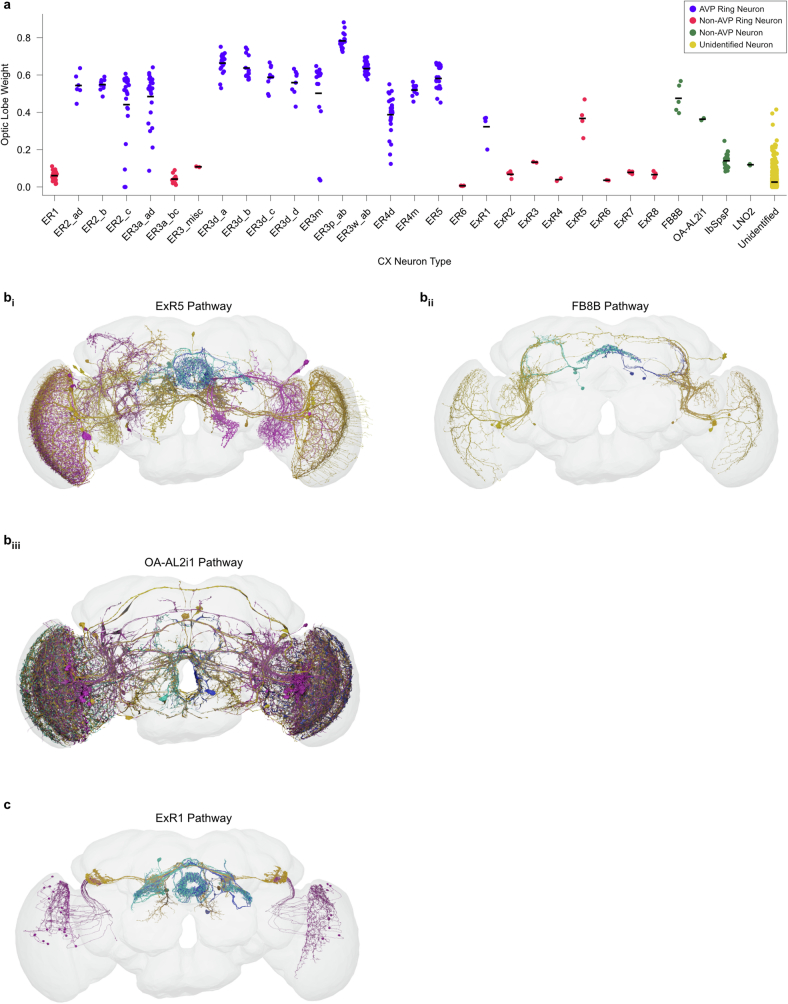
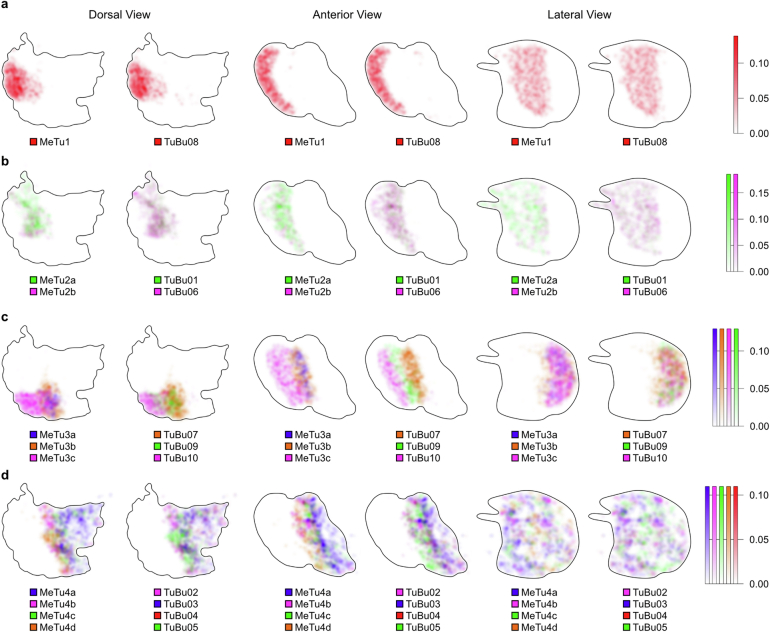
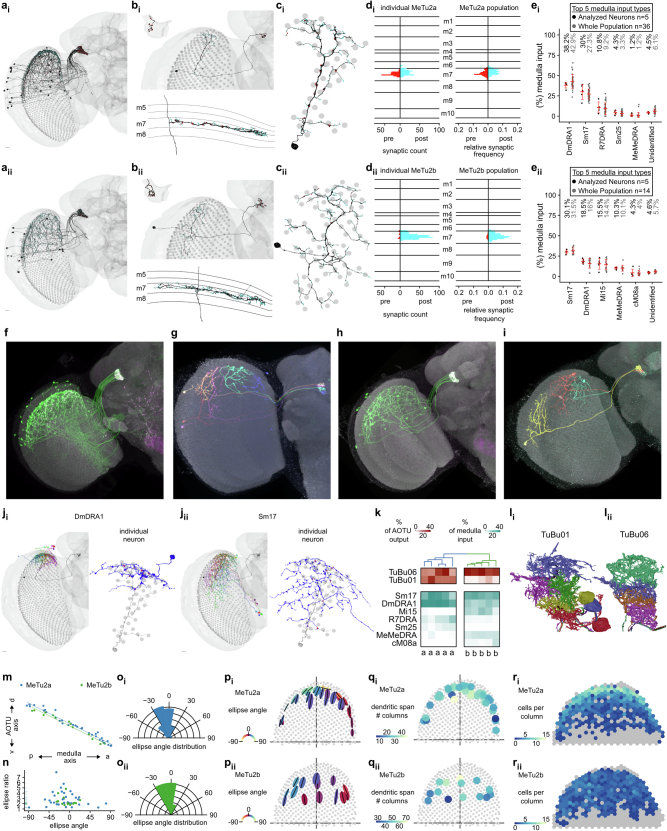
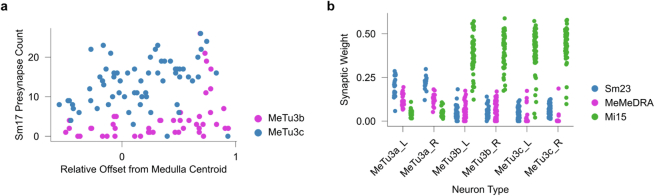
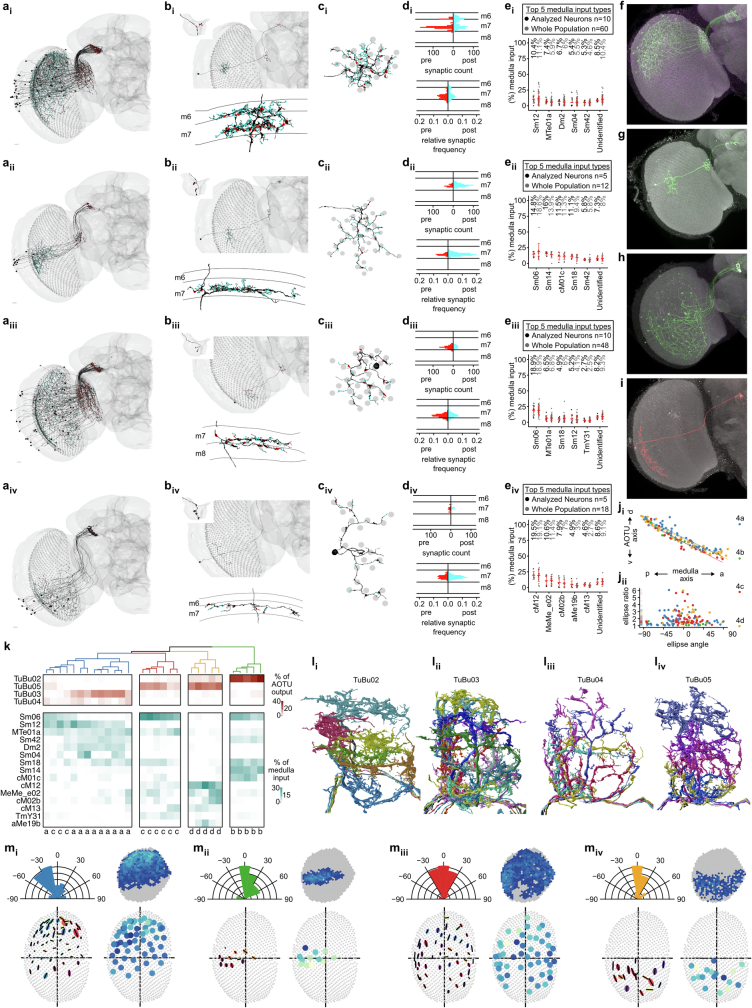
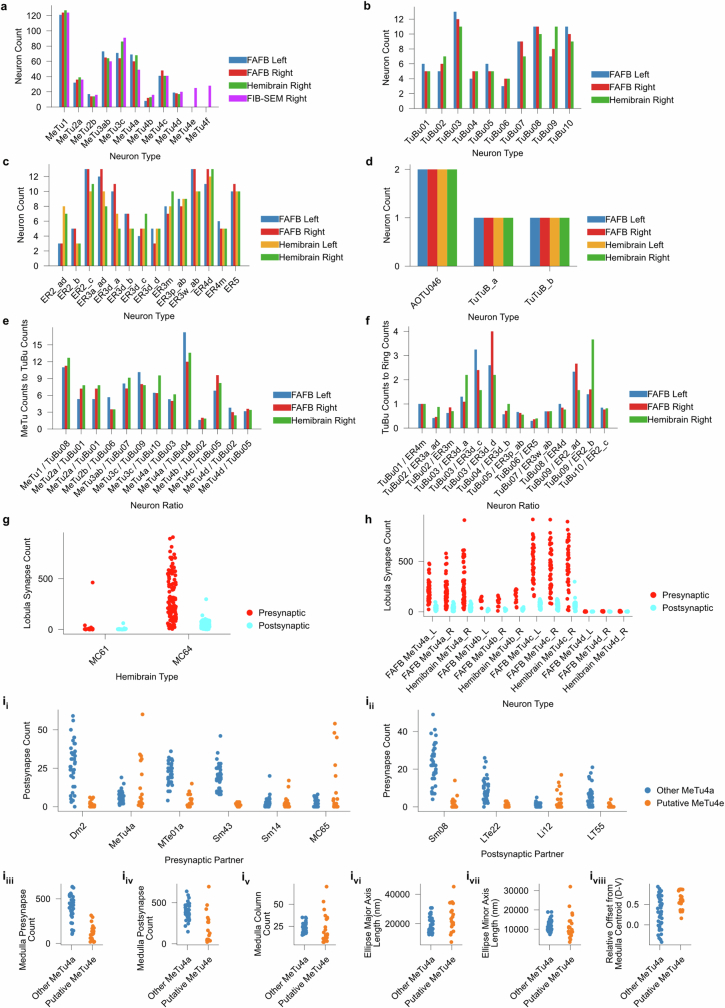
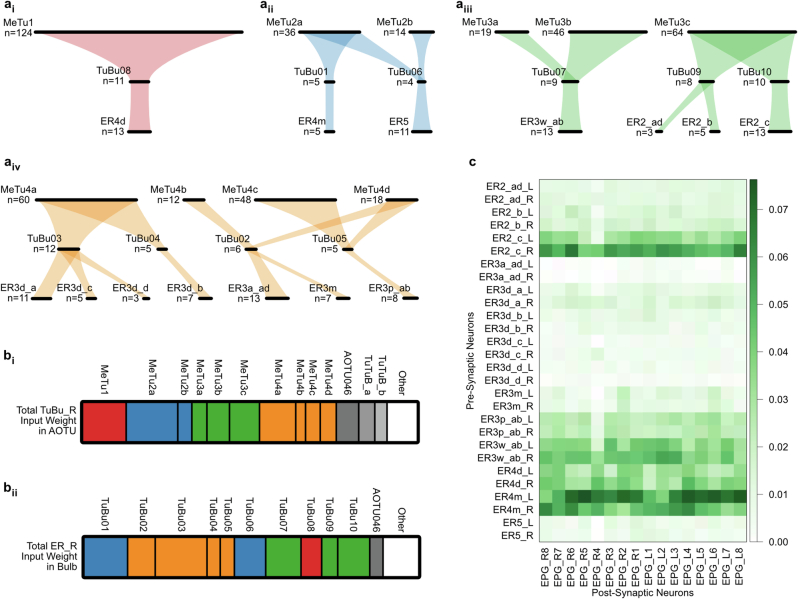
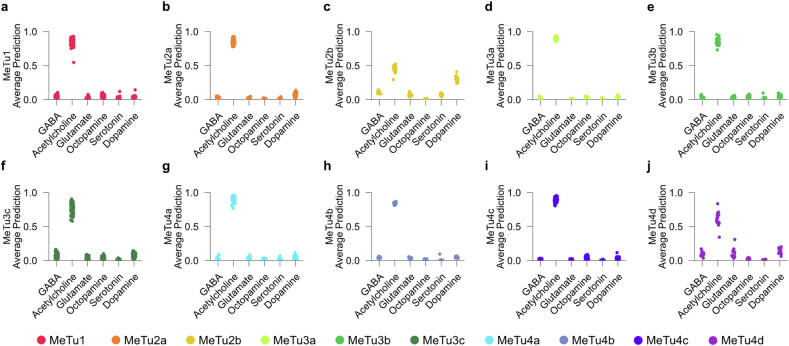
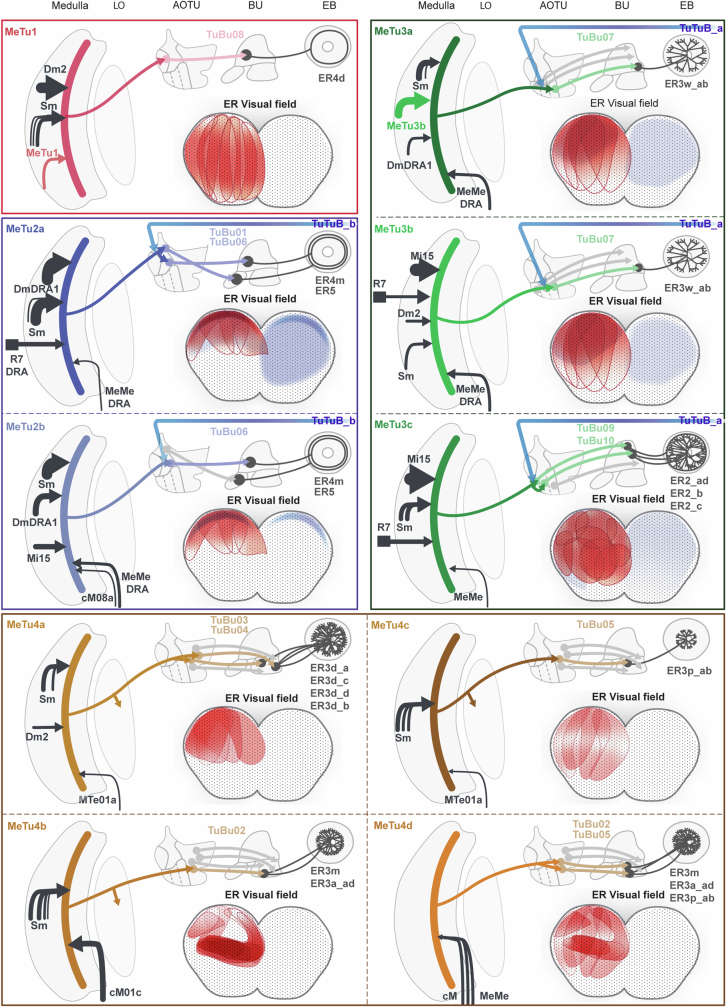
Many animals use visual information to navigate1-4, but how such information is encoded and integrated by the navigation system remains incompletely understood. In Drosophila melanogaster, EPG neurons in the central complex compute the heading direction5 by integrating visual input from ER neurons6-12, which are part of the anterior visual pathway (AVP)10,13-16. Here we densely reconstruct all neurons in the AVP using electron-microscopy data17. The AVP comprises four neuropils, sequentially linked by three major classes of neurons: MeTu neurons10,14,15, which connect the medulla in the optic lobe to the small unit of the anterior optic tubercle (AOTUsu) in the central brain; TuBu neurons9,16, which connect the AOTUsu to the bulb neuropil; and ER neurons6-12, which connect the bulb to the EPG neurons. On the basis of morphologies, connectivity between neural classes and the locations of synapses, we identify distinct information channels that originate from four types of MeTu neurons, and we further divide these into ten subtypes according to the presynaptic connections in the medulla and the postsynaptic connections in the AOTUsu. Using the connectivity of the entire AVP and the dendritic fields of the MeTu neurons in the optic lobes, we infer potential visual features and the visual area from which any ER neuron receives input. We confirm some of these predictions physiologically. These results provide a strong foundation for understanding how distinct sensory features can be extracted and transformed across multiple processing stages to construct higher-order cognitive representations.


Conflict of interest statement

The authors declare no competing interests.

Figures

Fig. 1
Fig. 1. Identification and classification of MeTu neurons in the AVP.
a, Diagram of the D. melanogaster central brain, emphasizing the AVP. Important regions are darker grey, including the medulla, AOTU, bulb and ellipsoid body (the former three have counterparts in both hemispheres). The three crucial neurons of the AVP are MeTu (purple), TuBu (yellow) and ER (cyan). b, All MeTu (n = 453 left; n = 441 right), TuBu (n = 75 left; n = 75 right) and visual ER (n = 116 left; n = 116 right) neurons. c, Left, synapse plots of TuBu (left) and MeTu (middle) neurons in the posterior lateral (red), posterior central (blue), anterior (green) and medial (yellow) region of the AOTUsu. Right, renders of TuBu in the AOTUsu_R (top) and MeTu in the AOTUsu_R (middle) and ME_R (bottom) with the same regional colours as the synapse plots on the left. Coordinates: A, anterior; R, lateral side of the right hemisphere; P, posterior; V, ventral. d, Synaptic weight matrices of MeTu type (top) or MeTu subtype (bottom) to TuBu type connectivity (right hemisphere). e, All neurons of types MeTu1 (far left), MeTu2 (left middle), MeTu3 (right middle) and MeTu4 (far right). f, UMAPs of all MeTu neurons with identified upstream partners on the basis of the synaptic weight of both the top five medulla input neuron types and AOTU output neuron types (top), or just the top five medulla input types (bottom) (see Methods for details). Groupings are generally consistent with MeTu1–MeTu4 groups in the main text, except MeTu3a neurons, which are closer to MeTu2 neurons (because of the similar polarization input) than other MeTu3 neurons. g, Synaptic weight matrix of all MeTu neurons with identified upstream partners (columns) and their AOTU output partners (red top rows) and top five medulla input types (teal bottom rows). Dendrogram branches and column labels are colour-coded according to MeTu. See Supplementary Data 1h,i for analyses with entire MeTu neurons.
Fig. 2
Fig. 2. MeTu1 neurons form a homogeneous group.
a, A single MeTu1_R neuron with presynapses (red) and postsynapses (cyan). Corner: magnified view of AOTUsu portion. Scale bar, 10 μm. b, Top view of the same neuron spanning medulla columns (grey). c, Side view of the neuron in a,b, with medulla layers labelled. d, Synapse distribution of the individual neuron in ac (left) and of all MeTu1_R neurons (right) within medulla layers (as count per 100 nm or relative frequency, respectively). e, Medulla input percentage of the top five synaptic input types and unidentified types for analysed neurons (n = 18, black; see Methods) and all MeTu1_R neurons (n = 124, grey); mean and s.d. in red. f, All MeTu1_R neurons with synapses. Scale bar, 10 μm. g, Confocal image of MeTu1-specific split-GAL4 driver (SS00385). h,i, MeTu1 MultiColor FlpOut (MCFO) image, from anterior (h) and medial (i) medulla views. j, MeTu1_R neurons from a (black), with all upstream Dm2 partners. Scale bar, 10 μm. k, Side view of same MeTu1_R neuron (grey) and one Dm2 partner (blue, with red presynapses). l, Top left, synapse density of one MeTu1 neuron. Top right, equal area annuli (314.15 µm2). Bottom, synapse density for each annulus (red averages). m, Percentage of output (red) and input (cyan) of analysed MeTu1 neurons with TuBu (top) and upstream partners (bottom). n, Diagram of analysed MeTu1 top medulla inputs. o, Illustration of MeTu1’s dendritic span with elliptical measurement (see Methods). p, Top, all MeTu1_R ellipse ratios (semi-major axis to semi-minor axis) plotted against ellipse angles. Bottom, ellipse angles’ relative frequencies (Rayleigh test of uniformity: P = 2.061 × 10⁻¹³, z-value = 0.345, mean ellipse angle = 29.1). q, Ellipses of all MeTu1_R, semi-major axes (black lines) and ellipse angles (colour range). r, Number of columns spanned by each MeTu1_R. s, Number of MeTu1_R bounded by each medulla column (grey if none). t, All TuBu08_R rendered from the AOTUsu_R lateral side (n = 11). u, MeTu1 retinotopy. Top, three MeTu1_R neurons (red, blue and green) with similar dorsal–ventral medulla positions. Bottom, all MeTu1_R AOTUsu dorsal–ventral positions plotted against medulla posterior–anterior positions.
Fig. 3
Fig. 3. Retinotopy and inputs of other MeTu subtypes.
ac, Renders and retinotopy of MeTu2, MeTu3 and MeTu4, respectively. a, Left, render of MeTu2a_R (blue, n = 36) and MeTu2b_R (orange, n = 14). b, Left, render of MeTu3a_R (blue, n = 19), MeTu3b_R (orange, n = 46) and MeTu3c_R (green, n = 64). c, Left, render of MeTu4a_R (blue, n = 60), MeTu4b_R (orange, n = 12), MeTu4c_R (green, n = 48) and MeTu4d_R (purple, n = 18). a–c, Top right, AOTU dorsal–ventral positions plotted against medulla (ME) anterior–posterior positions for each neuron of the respective types. This retinotopy is maintained in all types. Bottom right, AOTU medial–lateral positions plotted against medulla dorsal–ventral positions for each neuron of the respective types. This retinotopy is seen mainly in MeTu3c. d, Top medulla input types of analysed MeTu neurons (see Methods) for MeTu2 (left), MeTu3 (middle) and MeTu4 (right). Percentages of input contribution to each type are shown.
Fig. 4
Fig. 4. Putative visual areas of ER neurons in the right hemisphere.
a, Direct pathway (putatively excitatory). Left, all connected TuBu and upstream MeTu neurons for a given exemplary ER neuron. Middle, connectivity graph illustration of the direct pathway. In red are all branches connecting to one given column. Right, resulting putative visual area. The eye map was developed using microCT data. Scale bar, 10 μm. b, Indirect pathway (putatively inhibitory). Left, all connected TuBu, upstream TuTu and upstream MeTu neurons for a given exemplary ER neuron. Middle, connectivity graph illustration of the indirect pathway. In blue are all branches connecting to one given column. Right, resulting putative visual area. We did not analyse the AOTU046 pathway because its neurotransmitter was not conclusive. Scale bar, 10 μm. c, Overlaid direct and indirect visual areas predicted from a,b. d, Visual area size as the number of covered columns for all visual ER neurons of the right hemisphere. Red point: population average. e, For all visual ER types (columns) of the right hemisphere, we show an exemplary visual area of individual neurons (top of each ER type) and a contour outline of the visual area of all neurons of a given ER type (bottom of each ER type). ER2_ad_R, n = 3; ER2_b_R, n = 5; ER2_c_R, n = 13; ER3a_ad_R, n = 13; ER3d_a_R, n = 11; ER3d_b_R, n = 7; ER3d_c_R, n = 5; ER3d_d_R, n = 3; ER3m_R, n = 7; ER3p_ab_R, n = 8; ER3w_ab_R, n = 13; ER4d_R, n = 13; ER4m_R, n = 5; ER5_R, n = 11; ExR1_R, n = 2.
Fig. 5
Fig. 5. Physiological testing of predictions for ER4d and ER2 neurons.
a, Putative receptive fields for ER4d and ER2. b, Confocal image of ER neuron driver lines. Left, ER4d split-GAL4 line (SS04147). Right, ER2 Gal4 line (VT059775). Dendrites of ER4d and ER2 innervate the superior bulb (BUs). Scale bars, 50 µm. EB, ellipsoid body. c, Imaging set-up. Fly heads were tilted 30–45o to expose the left eye to the stimulus. IR, infrared. d, The stimulated visual area in the fly’s eye coordinates. e, The projection of the 38 predetermined squares (dots) on the screen. In each trial, a single dot was back-projected on the screen for 1 s, followed by 1 s of darkness. f, Snapshots of two-photon calcium imaging video of ER4d neurons in the BUs with an overlay of regions of interest (ROIs) selected on the basis of responses to stimuli. Individual ER neurons form a microglomerulus in the bulb. ER neurons (ROI1–ROI3) respond to dots appearing at different positions. Scale bars, 3 μm. Coordinates: D, dorsal; M, medial. g, Calcium activity (ΔF/F) of ROI1–ROI3 (left to right) before and during stimulation (n = 10 trials each; ROI1 P = 0.0020, ROI2 P = 0.0030, ROI3 P = 0.0039; Wilcoxon signed-rank test). h, Top, average calcium traces of ten trials of ROI2 in f arranged in the eye coordinates. Bottom, an ROI from an example ER2 neuron. i, Receptive field contour plot, contours at 20% (lighter shade) and 50% (darker shade) maximum ΔF/F of individual ROIs. Top, data are from ROI1–3 shown in f. j, Fitted ellipses at 20% contour. Dots represent the ellipses’ centroids. k, Fitted ellipses at 20% contour of ROIs collected from 11 flies (ER4d: 29 ROIs; ER2: 27 ROIs). l, Receptive field ellipse ratios as a function of ellipse angles. Ellipse ratio medians of ER4d and ER2 are significantly different (P = 0.0030, Wilcoxon rank sum test). m, Polar histograms of ellipse angles. The ellipse angles are not uniformly distributed (ER4d P = 4.673 × 10−14, ER2 P = 0.0033, Rayleigh’s test for nonuniformity). Source Data
Extended Data Fig. 1
Extended Data Fig. 1. Methods of analysis of the AVP and AOTUsu.
a, Diagrams of FlyWire. Image of the FlyWire interface with the EM volume on the left and neuropils on the right (ai). An example of proofreading/, with images before (aii) and after (aiii) a merge of two neuron fragments. b, Quality control through three rounds of proofreading among 113 MeTu neurons of the right hemisphere. The total number of edits per neuron per round (bi), the change in neuronal volume after each round (bii) and the F1 scores calculated between rounds for synapse counts (biii) and skeletal nodes (biv). All pair-wise test in each plot was significant (p < 0.0001, Wilcoxon rank sum test). ci–iii, EM data quality of the left and right optic lobe. ci, EM slice of the fly brain, note the partially detached lamina (arrow) on the left optic lobe. cii,ciii, MeTu1 neurons of the right and left optic lobe, respectively, viewed from the dorsal side, note the uneven image alignment on the posterior side (arrow) of the left optic lobe (ciii). di–iii, Comparison of different illustrations of the AOTUsu subregion (see section ‘AOTUsu subdivision in comparison with previous studies’ in the Methods for more details),,. e, Process of defining medulla columns and layers from all Mi1 neurons, a unicolumnar cell type, shown for the right optic lobe. From left to right: render of all Mi1 neurons of the right optic lobe (n = 796), a single Mi1 neuron with pre- (red) and postsynaptic (cyan) sides, distal–proximal axis of a column is given by PC1 of a PCA on all synaptic sides of the corresponding Mi1 neuron, defining layer markers based on the upper and lower bound of the distal–proximal axis, m6 layer marker of all columns.
Extended Data Fig. 2
Extended Data Fig. 2. Alternative pathways from the optic lobe to the central complex.
a, Strip plot that includes all neurons providing input to the central complex. Those of known types have been labelled (blue dots: ER neurons in the AVP, red dots: non-AVP ER neurons, green dots: non-EB neurons), and others (yellow dots) are labelled “Unidentified”. The y-axis represents the total synaptic weight from neurons that contain dendrites within the optic lobe that are at most two neurons upstream of the target neuron. The relative synaptic contribution of visual information, calculated from synapse counts, is less than 10% for most neurons outside the AVP, much less than 40% of those in the AVP. Further, only 11 neurons (four ExR5, five FB8B, and two OA-AL2i1) outside the AVP showed significant synaptic contribution to the central complex, compared to 236 neurons in the AVP. ER1: n = 28, ER2_ad: n = 6, ER2_b: n = 10, ER2_c: n = 26, ER3_misc: n = 2, ER3a_ad: n = 24, ER3a_bc: n = 11, ER3d_a: n = 21, ER3d_b: n = 14, ER3d_c: n = 9, ER3d_d: n = 8, ER3m: n = 15, ER3p_ab: n = 17, ER3w_ab: n = 26, ER4d: n = 24, ER4m: n = 11, ER5: n = 21, ER6: n = 4, ExR1: n = 4, ExR2: n = 4, ExR3: n = 2, ExR4: n = 2, ExR5: n = 4, ExR6: n = 2, ExR7: n = 4, ExR8: n = 4, FB8B: n = 5, IbSpsP: n = 24, LNO2: n = 2, OA-AL2i1: n = 2, Unidentified: n = 1261. bi–iii, Renders of pathways from the optic lobe to three types of neurons that convey significant visual information from outside the AVP: ExR5 (bi), FB8B (bii) and OA-AL2i1 (biii). Only ExR5 neurons are in the EB and may provide visual information to EPG neurons. With n = 4, however, they are unlikely to provide retinotopically organized visual information. These renders include the relevant central complex neurons (blue for right, cyan for left), neurons one layer upstream (yellow), and optic lobe neurons two layers upstream (pink). Note the the lack retinotopy and their diffuse connectivity patterns. c, Renders of the AVP pathways to ExR1.
Extended Data Fig. 3
Extended Data Fig. 3. Synapse density maps of MeTu-to-TuBu connections.
ad, Synapse density maps in the AOTUsu_R from the dorsal, anterior, and lateral perspectives. All perspectives have been rotated 30° with respect to the anterior–posterior axis, and synapse densities were blurred with a Gaussian filter with a sigma value of 10. Figures include MeTu1 (a), MeTu2a-b (b), MeTu3a-c (c), and MeTu4a-d (d) to their relevant downstream TuBu partners. a, The AOTUsu_PL comprises the outermost lateral volume of the AOTUsu, facing the posterior side (Figs. 1ci and 2t). All MeTu axons and TuBu dendrites found in this area arborize solely there and do not extend processes to other regions of the AOTUsu. We therefore designated all MeTu neurons arborizing in AOTUsu_PL as MeTu1 (Fig. 1c,e). All MeTu1 neurons form synapses with TuBu08 neurons (Fig. 1d and Supplementary Data 1fi-ii). The dendrites of any given TuBu08 neuron partially overlap with those of neighbouring TuBu08 neurons (Fig. 2t). As a population, the dendrites of TuBu08 neurons therefore roughly form a one-dimensional line along the dorsal–ventral axis, with a small positional variation along the medial–lateral axis (Fig. 2t). The AOTUsu_PL contains only one more cell type, being sparsely innervated by all four AOTU046 neurons (Extended Data Fig. 4b), which may provide motor context from superior posterior slope (SPS) and also potentially mediate bilateral communication between hemispheres (Extended Data Fig. 4 and Supplementary Data 1f). b, The AOTUsu_PC is located directly medial to AOTUsu_PL (Fig. 1c and Extended Data Fig. 5l). We designated all MeTu neurons that innervate AOTUsu_PC as MeTu2. Their dendrites in medulla were limited to the DRA, where input from photoreceptors that are sensitive to skylight polarization is processed ,. MeTu2 neurons make synapses onto TuBu01 and TuBu06 (Fig. 1d and Supplementary Data 1fi-ii). The dendrites of individual TuBu01 neurons do not overlap with neighbouring neurons of the same type (Extended Data Fig. 5l). As a population, TuBu01 and TuBu06 neurons form a one-dimensional line along the dorsal–ventral axis (Extended Data Fig. 5l). AOTUsu_PC contains two more types of neurons TuTuB_a and TuTuB_b, both of which interconnect the two hemispheres (Extended Data Fig. 4a,d). c, The AOTUsu_A is located in front of both AOTUsu_PL and AOTUsu_PC (Fig. 1c and Extended Data Fig. 6m). We designated all MeTu neurons that innervate AOTUsu_A as MeTu3. MeTu3 neurons synapse onto TuBu07, TuBu09, and TuBu10 neurons. These TuBu neurons are located in the medial, central, and lateral portions of the AOTUsu_A, respectively (Extended Data Fig. 6m). Of these three TuBu types, dendrites of the same type partially overlap each other but do not overlap with dendrites of other types (Fig. 1c and Extended Data Fig. 3c). In addition, they do not form clear one-dimensional lines along the dorsal–ventral axis as do the TuBu neurons in the AOTUsu_PL/PC. Finally, the entire anterior area is covered by dendritic and axonal processes of TuTuB_a (Extended Data Fig. 4d), and innervated by axonal boutons of AOTU046 (Extended Data Fig. 4e) exclusively in the TuBu09 location (Extended Data Fig. 4a). d, The AOTUsu_M is adjacent to both AOTUsu_PC and AOTUsu_A (Fig. 1c and Extended Data Fig. 8l). We designated all MeTu neurons that innervate AOTUsu_M as MeTu4. Their axonal boutons tile the entire volume with varying densities and spans. MeTu4 neurons synapse onto TuBu02, TuBu03, TuBu04, and TuBu05 neurons. TuBu02 dendrites are wide along the anterior–posterior axis and have thin dendritic clumps (Extended Data Fig. 8l). Dendrites of TuBu03 neurons form a rough one-dimensional line (Extended Data Fig. 8l). TuBu04 dendrites are sparse but cover an exceptionally wide area, with some filling the entire volume. As a population, they are not linearly arranged (Extended Data Fig. 8l). Dendrites of TuBu05 branch widely along the anterior–posterior axis but are narrower along the dorsal–ventral axis, forming a rough one-dimensional line (Extended Data Fig. 8l). The AOTUsu_M has a thin two-layer structure: TuBu02 and TuBu05 both cluster along the border between the AOTUsu_M and the other AOTUsu areas, while TuBu03 and TuBu04 cluster more medially. Finally, only AOTU046 neurons, but not TuTuB_a/b neurons, innervate AOTUsu_M, thus potentially conveying motor information from SPS (Extended Data Fig. 4b).
Extended Data Fig. 4
Extended Data Fig. 4. Bilateral neurons.
a, Left: synaptic weight between bihemispheric neuron types and MeTu subtypes on the ipsilateral (left) and contralateral (right) sides. Right: similar to the left, Synaptic weight between bihemispheric neuron types and TuBu types. MeTu2a receives strong synaptic inputs from TuTuB_b on both sides, but none from TuTuB_a. It also reciprocally provides strong inputs to TuTuB_b on both sides, but only very weak input to TuTuB_a. b, Diagram of an AOTU046 neuron. AOTU046 neurons innervates AOTUsu_M, where they send sparse axons along the anterior/posterior–lateral face and extend boutons toward the posterior–medial triangle vertex at only a single latitude halfway down the dorsal–ventral axis. Pie charts are the ratio of presynaptic (red) to postsynaptic (cyan) connections to AVP neurons in the AOTU and Bulb regions, and connections to all neurons in the SPS. The SPS depicted in a cutout. Pie chart sizes are based on the relative number of connections (legend on the right). c, Average neurotransmitter prediction score over all synapses in each AOTU046 neuron for each type of neurotransmitter. di,ii, Diagrams of TuBuB_a (di) and TuBuB_b (dii) neurons. Boutons of TuTuB_a sparsely protrude into the posterior central area only on the opposite side of the soma, while both axons and dendrites of TuTuB_b neurons innervate the entire AOTUsu_PC. Pie charts are the ratio of presynaptic (red) to postsynaptic (cyan) connections to AVP neurons in the AOTU and Bulb. Pie chart sizes are based on the relative amount of connections (legend on the right). ei,ii, The average neurotransmitter prediction score over all synapses in each TuTuB_a (ei) (n = 2) or TuTuB_b (eii) (n = 2) neuron for each type of neurotransmitter. f, Number of synapses of each TuTuB neuron between the ipsilateral and contralateral hemisphere, based on the type of neuron it is connected to.
Extended Data Fig. 5
Extended Data Fig. 5. The two MeTu2 subtypes both process polarized skylight.
a, All MeTu2a (ai) and MeTu2b (aii) neurons of the right optic lobe. Presynapses are red and postsynapses are cyan. b, Top: single MeTu2a (bi) or MeTu2b (bii) neuron, with a closeup of the AOTU portion in the top-left corner. Bottom: side view of the same neuron, with the medulla layers labelled on the left. c, Top view of the same neurons as in b, with the medulla columns it spans as grey circles. d, Left: synapse distribution of presynapses (red) and postsynapses (cyan) of the neurons in (b) with reference to the medulla layers. Right: synapse distribution of all MeTu2a/b respectively with reference to the medulla layers (relative frequency). ei,ii, Medulla input percentage of top 5 synaptic input types and unidentified types for MeTu2a (ei) and MeTu2b (eii). Includes analysed neurons (black, MeTu2a n = 5, MeTu2b n = 5, see Methods) and all MeTu2_R (grey, MeTu2a n = 36, MeTu2b n = 14); means and SD in red. f, Confocal image of a MeTu2a specific split-GAL4 driver (SS00336). g, MCFO image of MeTu2a neurons (SS00336). h, Confocal image of a MeTu2b specific split-GAL4 driver (SS03744). i, MCFO image of MeTu2b neurons (SS03744). j, MeTu2 main presynaptic partners. ji, Left: MeTu2a from bi in black, with all presynaptic DmDRA1 partners. Right: same MeTu2a in grey, along with a single DmDRA1 partner in blue. Presynapses from the DmDRA1 are red. jii, Left: MeTu2a from bi in black, with all presynaptic Sm17 partners. Right: Same MeTu2a shown in grey, along with a single Sm17 partner in blue. Presynapses from the Sm17 are red. k, Connectivity dendrogram of all analysed MeTu2a/b neurons (labelled on the bottom). Percentage of output (red) and input (cyan) to their top TuBu and upstream partners respectively. li,ii, All TuBu01_R (li, n = 5) and TuBu06_R (lii, n = 4) rendered from the AOTUsu_R lateral side. m, Dorsal–ventral positions in the AOTU of all MeTu2a (blue) and MeTu2b (green) neurons in the right hemisphere as a function of their posterior–anterior positions in the medulla. n, Ellipse ratios (semi-major axis to semi-minor axis) of all MeTu2a (blue) and MeTu2b (green) of the right hemisphere as a function of the ellipse angles. o, Relative frequency of ellipse angles for all MeTu2a (oi) and MeTu2b (oii) neurons in the right hemisphere (MeTu2a: Rayleigh Test of Uniformity: p = 2.136e-11, z-value = 0.584, mean ellipse angle=20.7; MeTu2b: Rayleigh Test of Uniformity: p = 4.905e-07, z-value = 0.682, mean ellipse angle=33.9). p, Ellipses of all MeTu2a (pi) and MeTu2b (pii) neurons of the right optic lobe with their semi-major axes as black lines and the colour of the ellipse as a function of the ellipse angle. q, Number of columns spanned by each MeTu2a (qi) and MeTu2b (qii) neuron of the right optic lobe. r, Number of MeTu2a (ri) and MeTu2b (rii) neurons each medulla column of the right optic lobe contains within its bounds. Grey columns have zero cells.
Extended Data Fig. 6
Extended Data Fig. 6. Three subtypes of MeTu3 are functionally segregated.
ai–iii, Entire population of MeTu3a, MeTu3b and MeTu3c neurons respectively of the right hemisphere. Presynapses are red and postsynapses are cyan. bi–iii, Top: Single MeTu3a/b/c neuron respectively, with a closeup of the AOTU portion in the top-left corner. Bottom: Side view of the same, with the medulla layers labelled on the left. ci–iii, Top view of the same neurons in bi–iii, with the medulla columns it spans as grey circles. di–iii, Synapse distribution of presynapses (red) and postsynapses (cyan) of the neurons in (bi-iii) with reference to the medulla layers. Right: Synapse distribution of all MeTu3a/b/c respectively with reference to the medulla layers (relative frequency). ei–iii, Medulla input percentage of top 5 synaptic input types and unidentified types for MeTu3a (ei), MeTu3b (eii), and MeTu3c (eiii). Includes analysed neurons (black, MeTu3a n = 6, MeTu3b n = 9, MeTu3c n = 11, see Methods) and all MeTu3_R (grey, MeTu3a n = 19, MeTu3b n = 46, MeTu3c n = 64); means and SD in red. f, Confocal image of a MeTu3b specific split-GAL4 driver (SS00988). g, MCFO image of MeTu3b neurons (SS00988). h, Dorsal–ventral positions in the AOTU of all MeTu3a (blue), MeTu3b (green), and MeTu3c (red) neurons in the right hemisphere as a function of their posterior–anterior positions in the medulla. i, Ellipse ratios (semi-major axis to semi-minor axis) of all MeTu3 neurons of the right hemisphere as a function of the ellipse angles. ji–iii, Relative frequency of ellipse angles for all MeTu3a/b/c neurons in the right hemisphere respectively (MeTu3a: Rayleigh Test of Uniformity: p = 7.598e-04, z-value = 0.427, mean ellipse angle=1.2; MeTu3b: Rayleigh Test of Uniformity: p = 1.941e-14, z-value = 0.586, mean ellipse angle=33.3, MeTu3c: Rayleigh Test of Uniformity: p = 1.987e-08, z-value = 0.545, mean ellipse angle=35.9). k, Top: MeTu3b from bii in black, along with all presynaptic Mi15 partners. Bottom: Side view of same MeTu3b in grey, with a single Mi15 partner in blue. Mi15 to MeTu3b synapses in red. l, Connectivity dendrogram of all analysed MeTu3a/b/c neurons (labelled on the bottom). Percentage of output (red) and input (cyan) to their top TuBu and upstream partners respectively. mi–iii, All TuBu07_R (mi, n = 9), TuBu09_R (mii, n = 8), and TuBu10_R (miii, n = 10) rendered from the AOTUsu_R lateral side. n, Morphometric analysis of MeTu3a (ni), MeTu3b (nii) and MeTu3c (niii) neurons. First plot: fitted ellipses with semi-major axes as black lines and the colour of the ellipse as a function of the ellipse angle. Second plot: number of columns spanned by each MeTu3 neuron of the right optic lobe. o, Number of MeTu3a (top left), MeTu3b (top right) and MeTu3c (bottom left) neurons each medulla column in the right optic lobe contains within its bounds. Grey columns have zero neurons.
Extended Data Fig. 7
Extended Data Fig. 7. MeTu3 upstream connections.
a, Number of synapses from Sm17 onto MeTu3b (pink) and MeTu3c (blue) neurons in the right hemisphere as a function of their relative position along the dorsal–ventral axis. 0 on the x axis refers to the centre of the medulla, while positive values are more dorsal and negative values are more ventral. b, Synaptic weight of upstream neurons to all neurons of the different subtypes of MeTu3. MeTu3a_L: n = 20, MeTu3a_R: n = 19, MeTu3b_L: n = 53, MeTu3b_R: n = 46, MeTu3c_L: n = 72, MeTu3c_R: n = 64.
Extended Data Fig. 8
Extended Data Fig. 8. Four MeTu4 subtypes convey widefield visual inputs.
ai–iv, Entire population of MeTu4a, MeTu4b, MeTu4c and MeTu4d neurons respectively of the right hemisphere. Presynapses are red and postsynapses are cyan. Note that MeTu4a/b/c have presynaptic connections in lobula (see Extended Data Fig. 9h for synapse counts in lobula). bi–iv, Top: Single MeTu4a/b/c/d neuron respectively, with a closeup of the AOTU portion in the top-left corner. Bottom: Side view of the same neuron, with the medulla layers labelled on the left. ci–iv, Top view of the same neurons in bi–iv, with the medulla columns it spans as grey circles. di–iv, Top: Synapse distribution of presynapses (red) and postsynapses (cyan) of the neurons in bi–iv with reference to the medulla columns. Bottom: Synapse distribution of all MeTu4a/b/c/d respectively with reference to the medulla layers (relative frequency). ei–iv, Medulla input percentage of top 5 synaptic input types and unidentified types for MeTu4a (ei), MeTu4b (eii), MeTu4c (eiii), and MeTu4d (eiv). Includes analysed neurons (black, MeTu4a n = 10, MeTu4b n = 5, MeTu4c n = 10, MeTu4d n = 5, see Methods) and all MeTu4_R (grey, MeTu4a n = 60, MeTu4b n = 12, MeTu4c n = 48, MeTu4d n = 18); means and SD in red. f, Confocal image of a MeTu4a specific split-GAL4 driver (SS03719). g, MCFO image of MeTu4a neuron (SS03719). h, Confocal image of a MeTu4d specific split-GAL4 driver (SS23880). i, MCFO image of MeTu4d neuron (SS23880). j, Top: dorsal–ventral positions in the AOTU of all MeTu4a (blue), MeTu4b (green), MeTu4c (red) and MeTu4d (yellow) neurons in the right hemisphere as a function of their posterior–anterior positions in the medulla. Bottom: ellipse ratios (semi-major axis to semi-minor axis) of all MeTu4 neurons of the right hemisphere as a function of their ellipse angles. k, Connectivity dendrogram of all analysed MeTu4a/b/c/d neurons (labelled on the bottom). Percentage of output (red) and input (cyan) to their top TuBu and upstream partners respectively. li–iv, All TuBu02_R (li, n = 6), TuBu03_R (lii, n = 12), TuBu04_R (liii, n = 5), and TuBu05_R (liv, n = 5) rendered from the AOTUsu_R lateral side. m, Morphometric analysis of MeTu4a (mi), MeTu4b (mii), MeTu4c (miii) and MeTu4d (miv) neurons. Top-left: Relative frequency of ellipse angles (MeTu4a: Rayleigh Test of Uniformity: p = 3.319e-14, z-value = 0.509, mean ellipse angle=7.4; MeTu4b: Rayleigh Test of Uniformity: p = 3.324e-02, z-value = 0.374, mean ellipse angle=64.4; MeTu4c: Rayleigh Test of Uniformity: p = 1.391e-12, z-value = 0.533, mean ellipse angle=39.8; MeTu4d: Rayleigh Test of Uniformity: p = 1.370e-04, z-value = 0.485, mean ellipse angle=51.6). Top-right: Number of respective MeTu4a/b/c/d neurons each medulla column in the right optic lobe contains within its bounds. Grey columns have zero cells. Color scale is the same as Extended Data Fig. 6o. Bottom-left: Fitted ellipses with their semi-major axes as black lines and the colour of the ellipse as a function of the ellipse angle. Bottom-right: Number of columns spanned by each MeTu4 neuron in the right hemisphere.
Extended Data Fig. 9
Extended Data Fig. 9. Variations across hemisphere and brains.
ad, Comparing neuron counts between both hemispheres in the FAFB and applicable hemispheres in the hemibrain and FIB-SEM datasets, of MeTu (a), TuBu (b), ER (c) and bihemispheric (d) neurons. Note the differences between the datasets. For example, MeTu4e-f, which have been discovered in the male FIB-SEM connectome, but not in the female FAFB or hemibrain connectomes are noted in a. In addition, in FAFB there are only six ER2_a/d neurons (3/side) while the hemibrain has 15 of these neurons (eight on the left, seven on the right) (c). Because there were no verifiable differences among these neurons, we categorized them as a single group. Similarly, although the total number of ER3a_ad neurons was similar between FAFB and hemibrain data, we were unable to identify distinct features to differentiate ER3a_a and ER3a_d in FAFB (c). Thus, we combined them into a single group as well. We did the same with ER3p_ab and ER3w_ab, as potential subtypes were similarly indistinguishable (c). e,f, Comparing the ratios of MeTu to TuBu (e) and TuBu to ER (f) between both datasets in applicable hemispheres. g, Number of lobula presynapses (red) and postsynapses (cyan) of all MeTu4 neurons in the hemibrain dataset, sorted by whether they were previously classified as MC61 (n = 36) or MC64 (n = 242). MeTu4d neurons were generally classified as MC61, due to not having synapses in the lobula. h, Number of lobula presynapses (red) and postsynapses (cyan) of all MeTu4 neurons in both datasets after subclassification. FAFB MeTu4a_L: n = 138, FAFB MeTu4a_R: n = 120, FAFB MeTu4b_L: n = 16, FAFB MeTu4b_R: n = 24, FAFB MeTu4c_L: n = 82, FAFB MeTu4c_R: n = 96, FAFB MeTu4d_L: n = 38, FAFB MeTu4d_R: n = 36, Hemibrain MeTu4a_R: n = 136, Hemibrain MeTu4b_R: n = 26, Hemibrain MeTu4c_R: n = 82, Hemibrain MeTu4d_R: n=34. ii–viii, Comparisons between putative MeTu4e (from MeTu4a) based on the FIB-SEM characterization and other MeTu4a neurons. ii,ii are comparisons between the number of synaptic connections with neurons in the medulla, specifically presynaptic partners (ii) and postsynaptic partners (iii). Dm2: n = 60, LT55: n = 60, LTe22: n = 60, Li12: n = 60, MC65: n = 60, MTe01a: n = 60, MeTu4a: n = 60, Sm08: n = 60, Sm14: n = 60, Sm43: n = 60. iiii–viii are comparisons between various characteristics, including the number of presynapses (iiii) and postsynapses (iiv) in the medulla, the number of columns the neurons occupy in the medulla (iv), the dendritic major axis (ivi) and minor axis (ivii) length in nm and the relative location along the dorsal–ventral axis in the medulla, with respect to the medulla centroid (iviii). Other MeTu4a: n = 39, Putative MeTu4e: n = 21.
Extended Data Fig. 10
Extended Data Fig. 10. Comparisons between MeTu subtypes.
a, Comparisons between all MeTu subtypes in the right hemisphere. Number of presynapses in the medulla (ai), number of postsynapses in the medulla (aii), number of medulla columns that each neuron’s dendritic span occupies (aiii), number of presynapses in the AOTU (aiv), number of postsynapses in the AOTU (av) and the ellipse ratio of the dendrites in the medulla (avi). b, Comparisons among all MeTu subtypes in the right hemisphere with respect to the ventral–dorsal axis (negative values are ventral, positive values are dorsal) and the anterior–posterior axis (negative values are anterior, positive values are posterior) of the medulla. Scatter plots are of all MeTu neurons and their lines of best fit. The colour legend is at the bottom of b. b, The values compared with respect to the V-D and A–P axes are the number of presynapses in the medulla (bi), the number of postsynapses in the medulla (bii), the number of presynapses in the AOTU (biii), the number of postsynapses in the AOTU (biv), the number of medulla columns in the dendritic span (bv), the dendritic ellipse ratio (bvi), the length of the major axis of the dendritic ellipse in nm (bvii) and the length of the minor axis of the dendritic ellipse in nm (bviii). See Extended Data Fig. 11 for the number of neurons of each type.
Extended Data Fig. 11
Extended Data Fig. 11. Overview of neuron counts and synaptic weights in the pathway.
ai–iv, The number of MeTu, TuBu and ER neurons in the pathway. Line width is directly correlated with neuronal counts in the right hemisphere, and coloured shapes represent connected subtypes. This includes the MeTu1 (ai), MeTu2 (aii), MeTu3 (aiii) and MeTu4 (aiv) pathways. bi,ii, The total synaptic weight of a broad neuron type in their dendritic region. The outer rectangles represent the sum of all postsynapses in that region for that neuron type. The relative amount of contribution from various input types is shown. bi shows the synaptic weight of all right hemisphere TuBu neurons in the AOTU from various input types, while bii is the synaptic weight of all right hemisphere ER neurons in the bulb. c, The synaptic weight matrix of ER neuron-to-EPG type connectivity in the ellipsoid body.
Extended Data Fig. 12
Extended Data Fig. 12. Differences in the predicted neurotransmitters.
aj, Average neurotransmitter prediction score over all synapses in each MeTu1 (a), MeTu2a (b), MeTu2b (c), MeTu3a (d), MeTu3b (e), MeTuc3c (f), MeTu4a (g), MeTu4b (h), MeTu4c (i) and MeTu4d (j) neuron, for each type of neurotransmitter. Note that the neurotransmitter of MeTu2b is not clearly predicted as cholinergic. See Extended Data Fig. 11 for the number of neurons of each type.
Extended Data Fig. 13
Extended Data Fig. 13. Overviews of parallel AVPs.
Each panel shows a generalized neural pathway and receptive field of a MeTu subtype. Note that ExR1 is excluded because it integrates information from all TuBu types. From the left to top right side, there is a diagram of the pathway from the medulla to the EB. Medulla inputs to MeTu are shown on the left of the medulla if they come from the retina or medulla, and on the right if they come from the central brain. Photoreceptor inputs in the retina are shown as squares. The AVP from the MeTu to the TuBu and ER neurons are shown, as well as if the MeTu has outputs in the lobula or synapses with TuTuB neurons in the AOTU. The receptive fields of the relevant ER neurons are on the bottom right. Red indicates input from MeTu neurons via direct pathways, whereas blue indicates indirect input via inhibitory TuTuB neurons. AOTU046 is not included because the excitatory or inhibitory nature of the neuron is unknown. The receptive fields of ER neurons represent all inputs to ER neurons. For example, ER3p_ab receives input from both MeTu4c and MeTu4d. Therefore, the receptive field covers the ventral visual field, as can be seen in both panels of MeTu4c and MeTu4d. ER3m and ER3a_ad receive input from both MeTu4b and MeTu4d. But the synaptic weight from MeTu4b dominates. Thus, the ventral visual field is not significantly represented in the MeTu4b panel. The interaction between AVP channels appears to be minimal. In other words, direct interaction between the four major MeTu types is negligible between the medulla and the ellipsoid body.

Update of

References

    1. Dacke, M. et al. Multimodal cue integration in the dung beetle compass. Proc. Natl Acad. Sci. USA116, 14248–14253 (2019). - PMC - PubMed
    1. Keinath, A. T., Julian, J. B., Epstein, R. A. & Muzzio, I. A. Environmental geometry aligns the hippocampal map during spatial reorientation. Curr. Biol.27, 309–317 (2017). - PMC - PubMed
    1. Cheng, K. A purely geometric module in the rat’s spatial representation. Cognition23, 149–178 (1986). - PubMed
    1. Muller, M. & Wehner, R. Wind and sky as compass cues in desert ant navigation. Naturwissenschaften94, 589–594 (2007). - PubMed
    1. Seelig, J. D. & Jayaraman, V. Neural dynamics for landmark orientation and angular path integration. Nature521, 186–191 (2015). - PMC - PubMed

MeSH terms

LinkOut - more resources