. 2024 Oct;634(8032):191-200.
doi: 10.1038/s41586-024-07854-7. Epub 2024 Oct 2.

Neural circuit mechanisms underlying context-specific halting in Drosophila

Affiliations

Neural circuit mechanisms underlying context-specific halting in Drosophila

Neha Sapkal et al. Nature. 2024 Oct.

Abstract

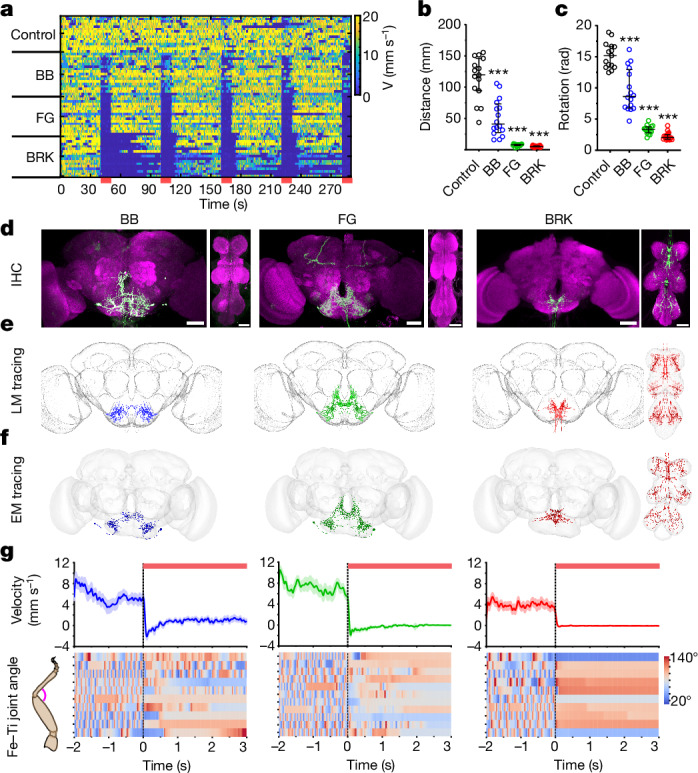
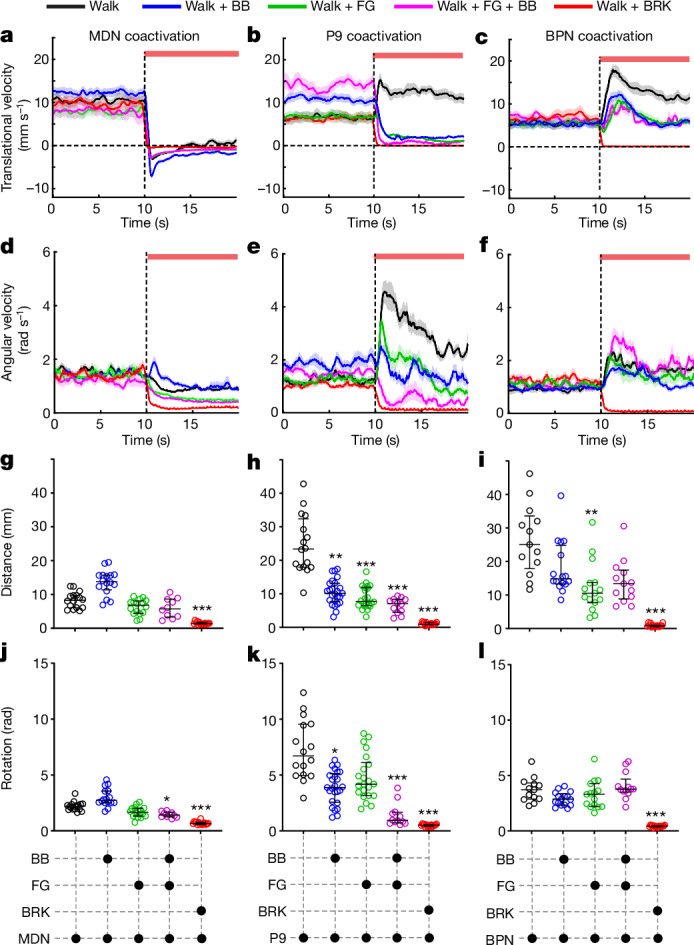
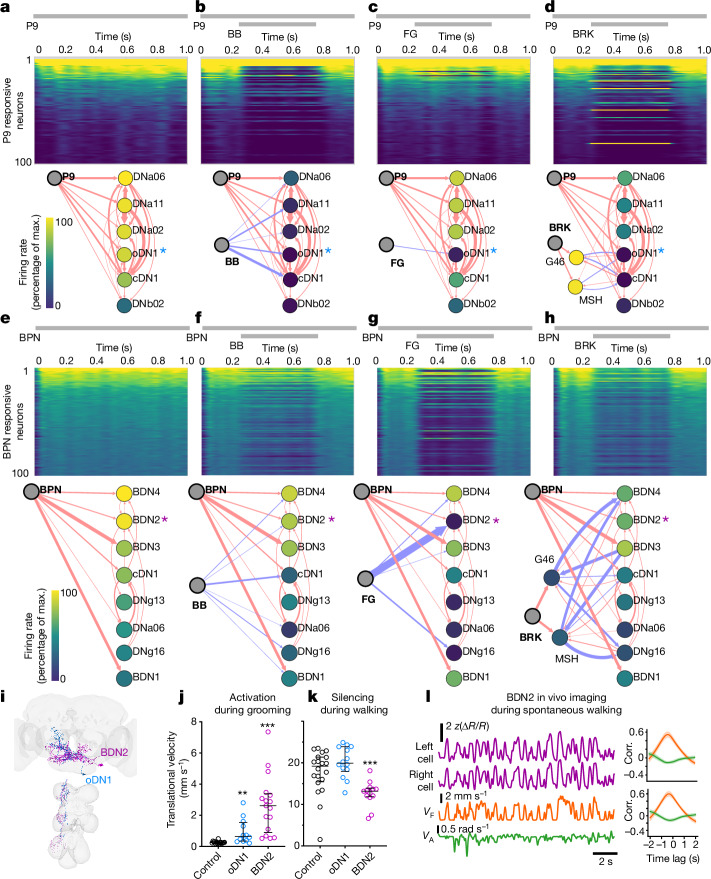
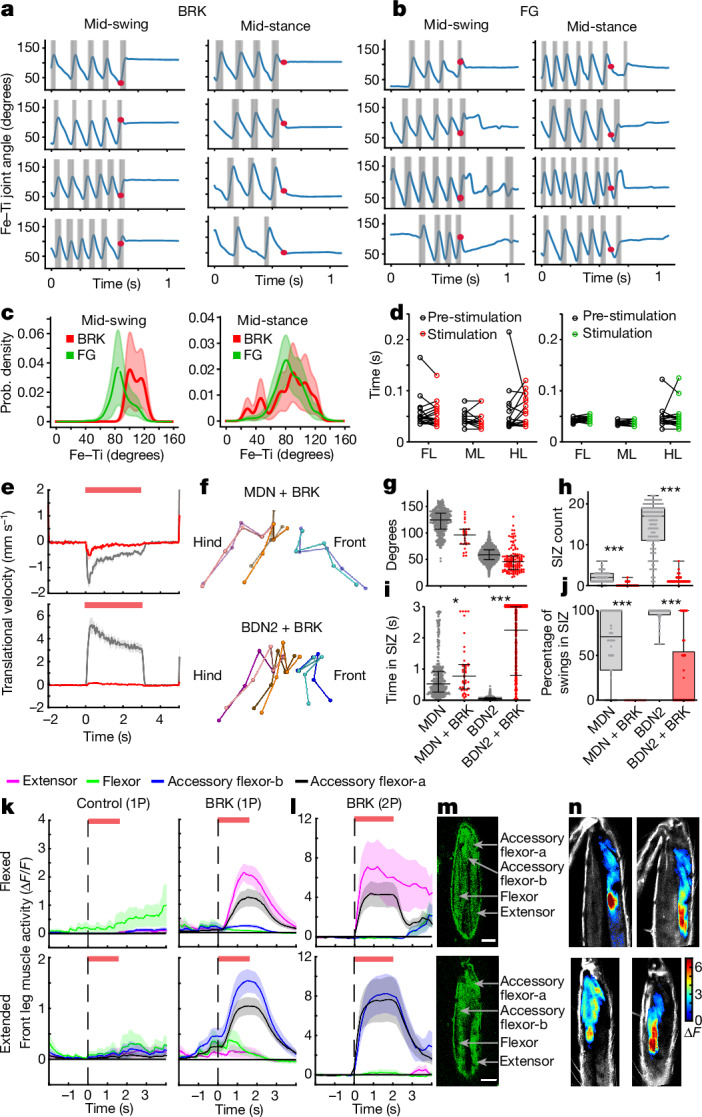
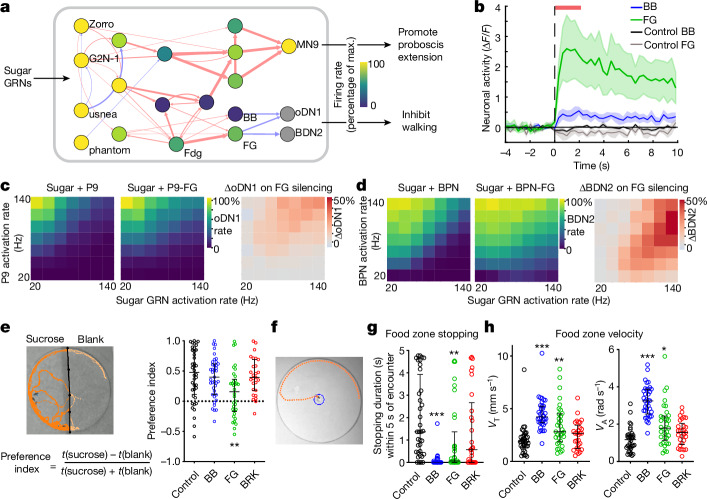
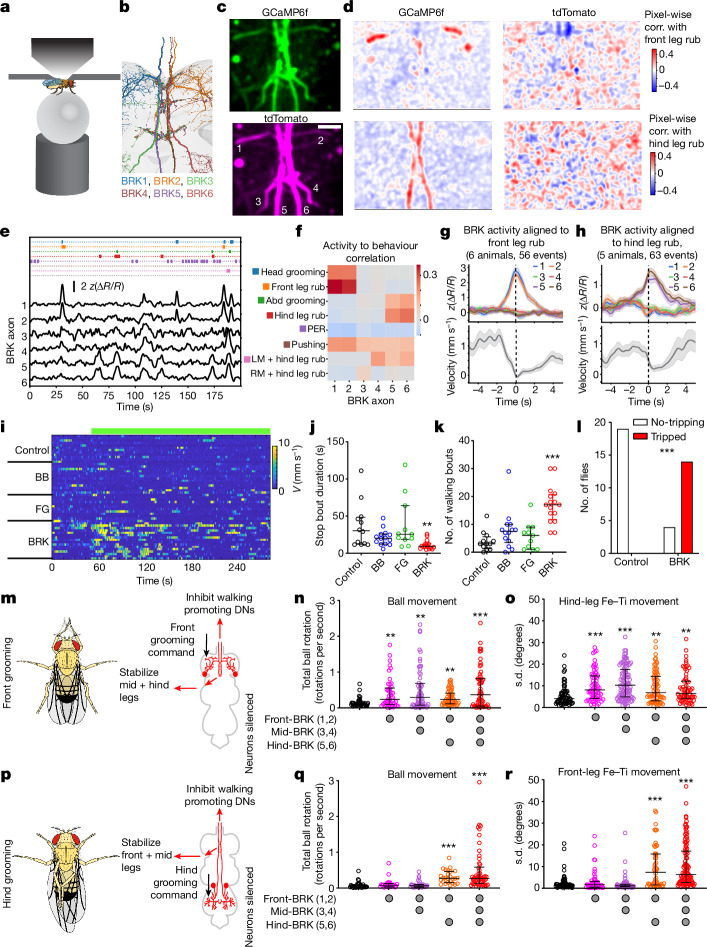
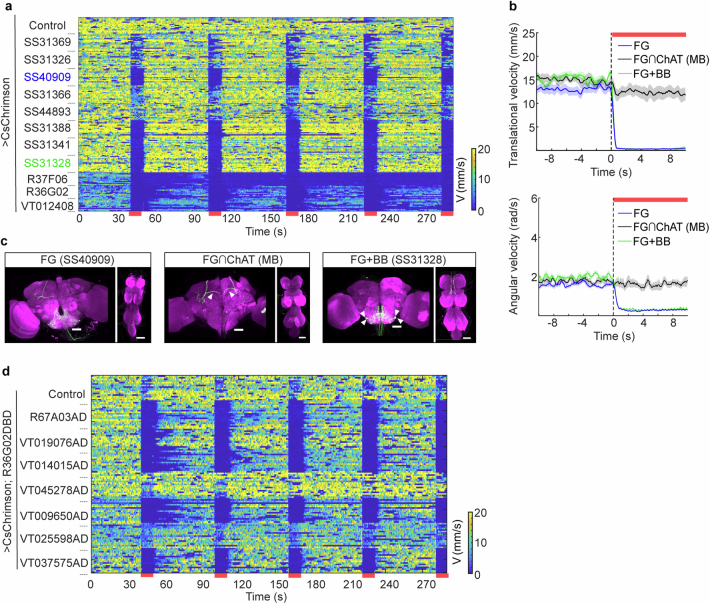
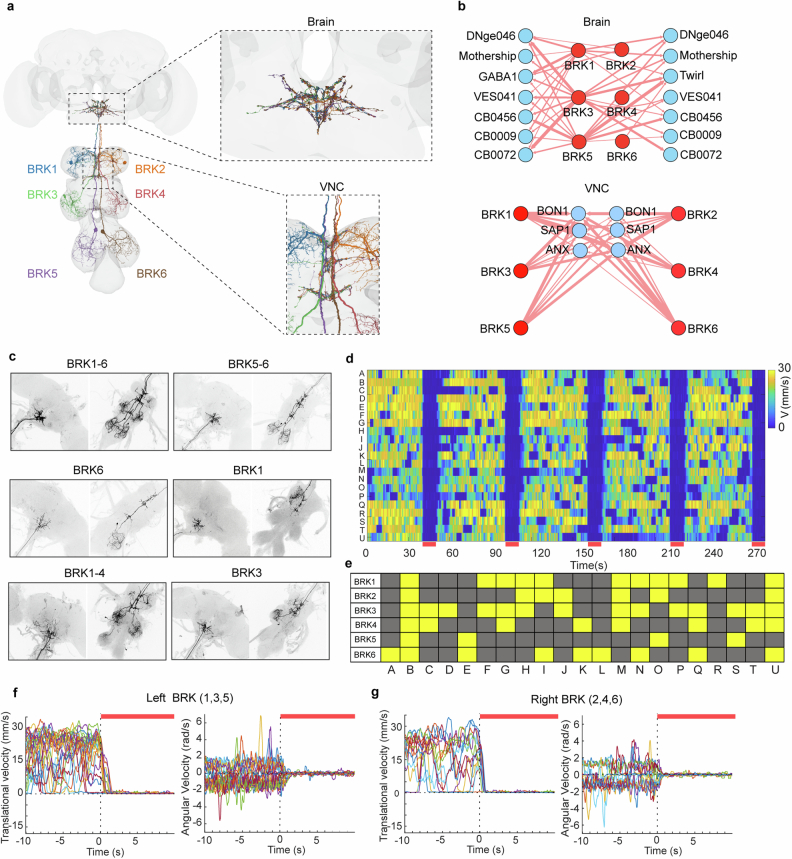
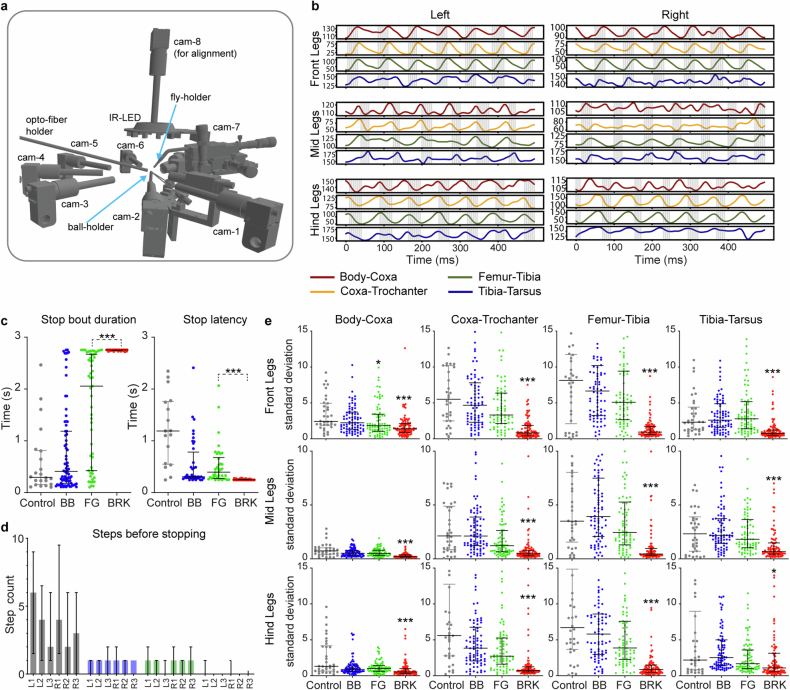
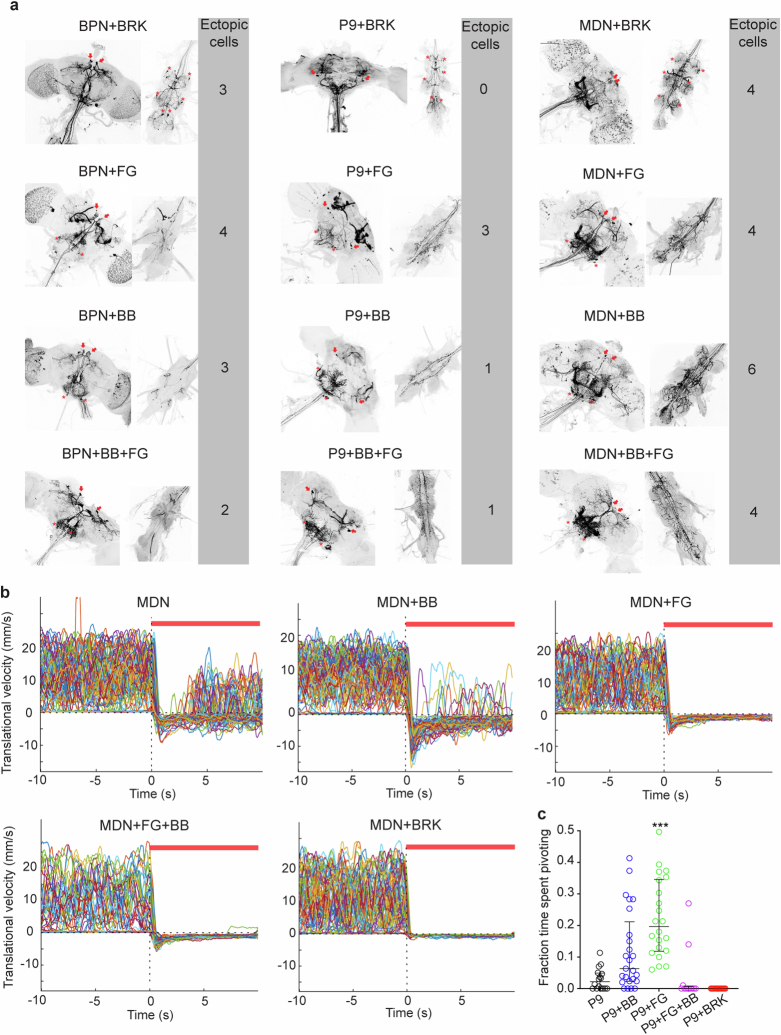
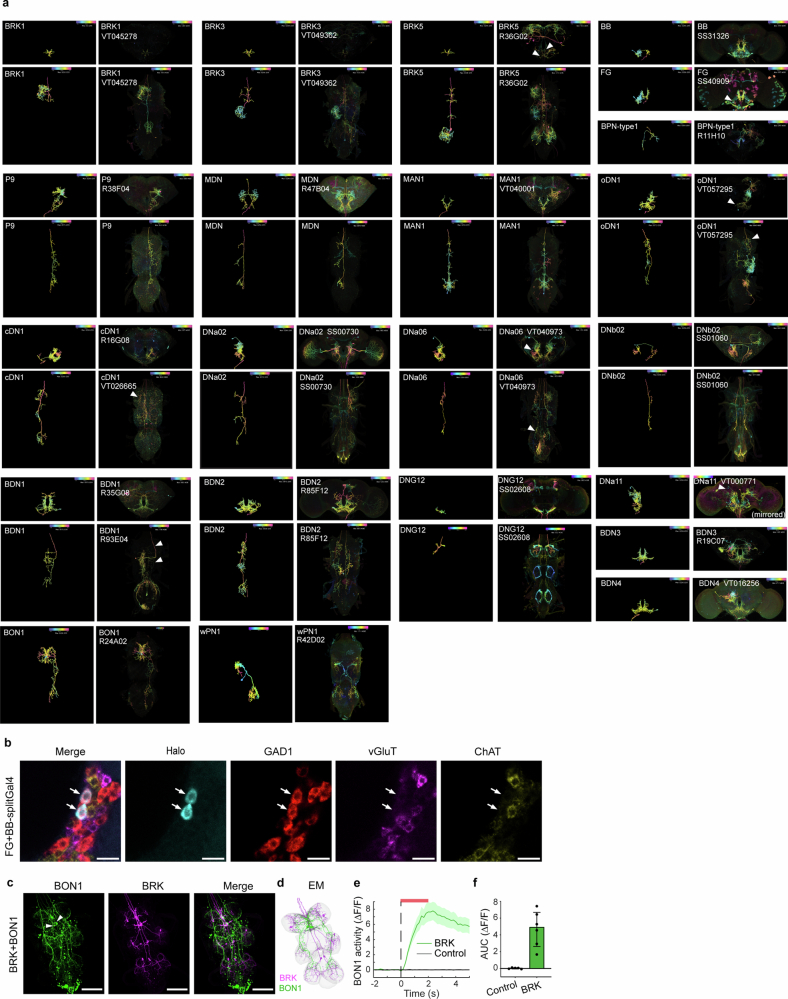
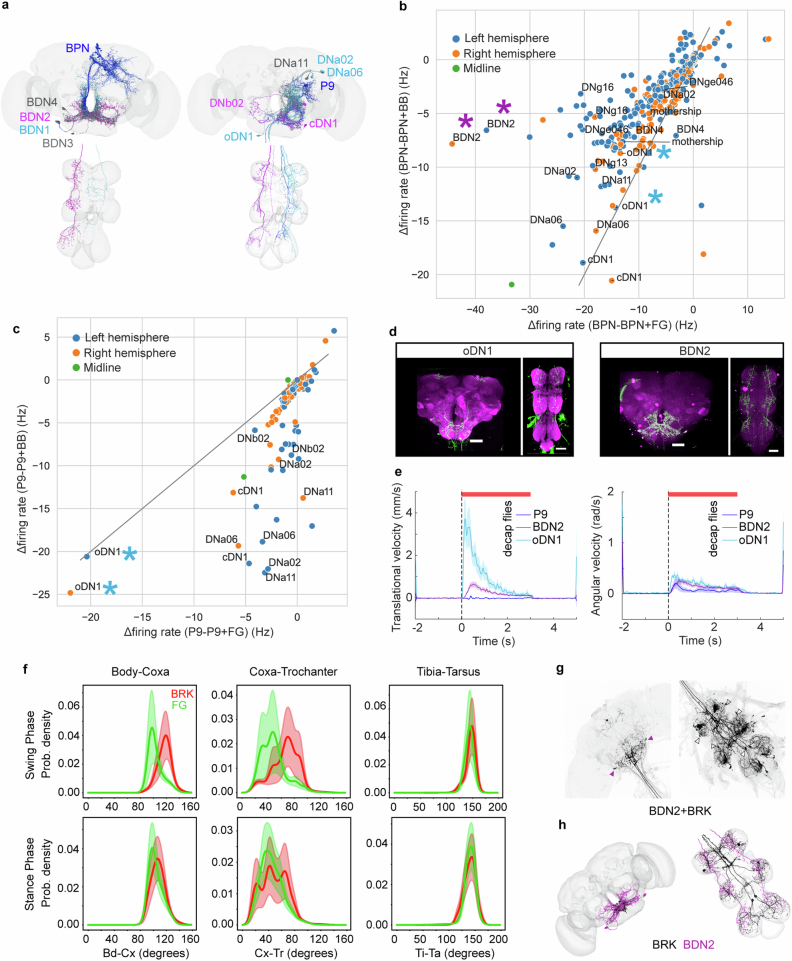
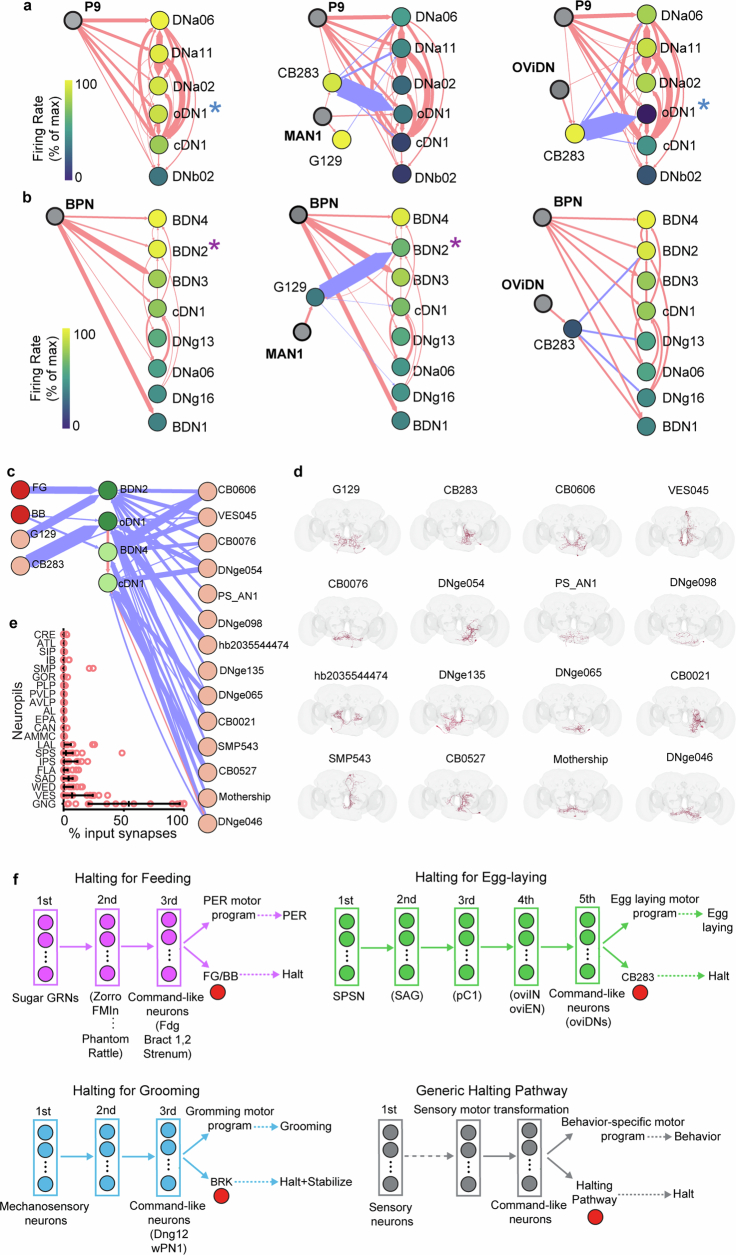
Walking is a complex motor programme involving coordinated and distributed activity across the brain and the spinal cord. Halting appropriately at the correct time is a critical component of walking control. Despite progress in identifying neurons driving halting1-6, the underlying neural circuit mechanisms responsible for overruling the competing walking state remain unclear. Here, using connectome-informed models7-9 and functional studies, we explain two fundamental mechanisms by which Drosophila implement context-appropriate halting. The first mechanism ('walk-OFF') relies on GABAergic neurons that inhibit specific descending walking commands in the brain, whereas the second mechanism ('brake') relies on excitatory cholinergic neurons in the nerve cord that lead to an active arrest of stepping movements. We show that two neurons that deploy the walk-OFF mechanism inhibit distinct populations of walking-promotion neurons, leading to differential halting of forward walking or turning. The brake neurons, by constrast, override all walking commands by simultaneously inhibiting descending walking-promotion neurons and increasing the resistance at the leg joints. We characterized two behavioural contexts in which the distinct halting mechanisms were used by the animal in a mutually exclusive manner: the walk-OFF mechanism was engaged for halting during feeding and the brake mechanism was engaged for halting and stability during grooming.


Conflict of interest statement

The authors declare no competing interests.

Figures

Fig. 1
Fig. 1. Identification of halt neurons.
ac, Translational velocity heatmap (a) (every row shows velocity of single fly, red bars indicate optogenetic stimulation), trial averaged travelled distance (b, median ± interquartile) and rotation (c, median ± interquartile) of free-walking control flies and flies expressing CsChrimson in halting neurons (BB, FG and BRK). n = 15–18 flies per genotype, Mann–Whitney test compared to genetic-background control (***P < 0.001). df, Immunohistochemistry (IHC) images of the selected genetic drivers (CsChrimson-mVenus, green; neuropil, magenta; scale bars, 50 µm) (d), light microscopy (LM)-based segmentation (e) and electron microscopy (EM)-based segmentation (f) of the BB (left), FG (middle) and BRK (right) halt neurons. g, Forward velocity (top, mean ± s.e.m) and Fe–Ti joint angle heatmap (bottom, every row represents a different fly) of tethered walking flies during optogenetic stimulation of BB (left), FG (middle) and BRK (right) neurons. Here, 3 s of stimulation (top red bar) starts at dotted vertical line in velocity plots (also Supplementary Video 1). Supplementary Table 1 shows full experimental genotypes and exact sample sizes. Source Data
Fig. 2
Fig. 2. Walk–halt interactions.
al, Trial averaged (mean ± s.e.m) translational velocity (ac), angular velocity (df), distance covered in 2 s after stimulation onset (gi), median ± interquartile) and rotations in 2 s after stimulation onset (jl, median ± interquartile) of free-walking flies with pairs of walk and halt neurons optogenetically stimulated. Stimulation (red bar) starts at dotted vertical line in velocity plots. Each graph represents quantification for MDN (a,d,g,j), P9 (b,e,h,k) and BPN (c,f,i,l) coactivation experiments. n = 10–25 flies per genotype, Kruskal–Wallis test followed by Dunn’s multiple comparison with genetic-background control (***P < 0.001, **P < 0.01, *P < 0.05) (also Supplementary Videos 2 and 3). Supplementary Table 1 shows full experimental genotypes and exact sample sizes. Source Data
Fig. 3
Fig. 3. Modelling and functional data uncover critical walking-promotion nodes inhibited by halting pathways in the walk-OFF mechanism.
ah, Simulation results for activating P9 (a), P9 + BB (b), P9 + FG (c), P9 + BRK (d), BPN (e), BPN + BB (f), BPN + FG (g) and BPN + BRK (h), activation paradigm indicated with grey bars on top. Trial averaged firing rate heatmap of top 100 neurons responding to in silico P9 (ad) or BPN (eh) coactivation with halt neurons, is shown on top and connectome-based wiring diagram for strongly recruited DNs is shown on bottom. Nodes in the wiring diagrams are colour-coded based on firing rate in the full simulation as in the heatmaps; the colour scale is normalized to the maximum (max.) trial averaged firing rate achieved in the case of the respective walk neuron activation simulation. Red arrows indicate predicted excitatory connections, and blue arrows indicate predicted inhibitory connections; arrow width corresponds to synaptic count, and scales from five (thinnest) to 400 (thickest) synapses. Asterisks indicate neurons selected for further analysis in il. i, EM segmentation of oDN1 and BDN2 neurons. j, Trial averaged translational velocity of stationary grooming flies induced to walk on optogenetic activation of oDN1 or BDN2. n = 12–17 flies per genotype, median ± interquartile, Mann–Whitney test (**P < 0.01, ***P < 0.001). k, Trial averaged translational velocity of free-walking flies with oDN1 or BDN2 optogenetic silenced (GtACR1). n = 13–20 flies per genotype, median ± interquartile, Mann–Whitney test (***P < 0.001). l, BDN2 activity (top two traces corresponding to left and right BDN2, respectively) in a tethered fly spontaneously walking with forward velocity (VF) and angular velocity (VA), bottom traces. Right panels show cross-correlation (Corr.) of pooled data across three flies for activity of BDN2 left cell (top) and BDN2 right cell (bottom) with VF (orange) and VA (green) (Supplementary Video 4). Supplementary Table 1 shows full experimental genotypes and exact sample sizes. Source Data
Fig. 4
Fig. 4. VNC-specific halting pathway for increasing resistance to leg movements in the brake mechanism.
a,b, Front-leg Fe–Ti joint angle during optogenetic stimulation of BRK (a) or FG (b) in tethered walking flies (each row is one example fly) grouped by stimulation onset mid-swing (left) or mid-stance (right). Swing phase indicated by grey background c, Probability (prob.) density of front-leg Fe–Ti joint angle if BRK or FG was stimulated mid-swing (left) or mid-stance (right). d, Average swing duration before and on mid-swing stimulation of BRK (left) or FG (right) for front legs (FL), mid-legs (ML) and hind legs (HL). n = 13–21 flies per genotype, multiple paired t-test. e, Averaged translational velocity during BRK + MDN (top) or BRK + BDN2 stimulation in decapitated flies (bottom). n = 7–11 flies per genotype, mean ± s.e.m., top red bar indicates optogenetic stimulation. f, 3D reconstructed leg joints during BRK + MDN or BRK + BDN2 stimulation. g, Fe–Ti joint angle values at swing initiation onset, median ± interquartile. h, Number of times per trial when front-leg Fe–Ti joint angle value entered the swing initiation zone (SIZ). i, Time spent with Fe–Ti joint angle in SIZ. j, Percentage of swings initiated after the front-leg Fe–Ti joint entered SIZ. hj show median ± interquartile, Mann–Whitney test (***P < 0.001, **P < 0.01) (also Supplementary Video 5). k, Femoral muscle activity (1P) in Fe–Ti joint kept flexed (top) or extended (bottom) in control (left) or BRK>CsChrimson (right) flies. Top red bar indicates 1.6 s optogenetic stimulation. Mean ± s.e.m., n = 8–9 flies per group. l, Muscle activity (2P) in BRK>CsChrimson flies. Mean ± s.e.m., n = 7–8 flies per group. m, Femoral muscle anatomy with Fe–Ti flexed (top) or extended (bottom) in MHC-tau::GFP flies. Scale bars, 50 µm. n, Averaged trial ∆F images of two BRK>CsChrimson flies with Fe–Ti joint flexed (top) or extended (bottom) (Supplementary Video 6). Supplementary Table 1 shows full experimental genotypes and exact sample sizes. Source Data
Fig. 5
Fig. 5. FG and BB recruited for halting in the context of feeding.
a, In silico stimulation of sugar GRNs showing recruitment of FG and BB by sucrose sensory-motor pathway. Nodes are colour-coded by firing rate, and arrows weighted by synapse number as in Fig. 3. b, FG or BB activity (in vivo GCaMP7b imaging, mean ± s.e.m.) during 2 s of optogenetic stimulation (top red bar) of sugar GRNs (Gr5a), in starved flies. n = 4–9 flies per genotype. c,d, Simulation of oDN1 (c) or BDN2 (d) firing rate while coactivating P9 (c) or BPN (d) with sugar GRNs across range of stimulation rates in intact model (left) or with FG silenced model (middle). Difference between middle and left panels in both c and d, is depicted in respective right panels. e, Example fly trajectory from two-choice assay (left) and preference index (right) of sucrose over blank, for flies with BB, FG or BRK silenced (GtACR1). n = 27–40 flies per genotype, median ± interquartile, Kruskal–Wallis test followed by Dunn’s comparison with control (**P < 0.01). f. Example fly trajectory in the food-blob interaction assay showing the food-interaction zone (blue). g, Stopping-bout duration within 5 s of food encounter for flies with halt neurons silenced (GtACR1). h, Translational (left, VT) or angular (right, VA) velocity of flies in the food-zone within 5 s of food encounter for flies in g. g,h, n = 29–36 flies per genotype, median ± interquartile, Kruskal–Wallis test followed by Dunn’s comparison with control (***P < 0.001, **P < 0.01, *P < 0.05). Supplementary Video 8. Supplementary Table 1 shows full experimental genotypes and exact sample sizes. Source Data
Fig. 6
Fig. 6. BRK is recruited for halting during grooming.
a, Schematic of in vivo VNC imaging. b, Electron microscopy segmentation of BRK neurons near the output zone in VNC tectulum region. c, Averaged image of green (GCaMP6f) and magenta (tdTomato) channels with BRK neuron 1–6 juxtaposed to their respective axons (1, 2, front-leg BRK; 3, 4, mid-leg BRK; 5, 6, hind-leg BRK). d, Pixel-wise correlation map from c, showing pixels with intensity correlated to front-leg rubbing events (top) or hind-leg rubbing events (bottom). e, Imaging session showing all ethograms (top) and z-scored ∆R/R (bottom) for each BRK neuron. f, Correlation (corr.) between BRK activity and annotated behaviours (data pooled across six flies; Abd, abdomen; PER, proboscis extension response). g,h, z-scored ∆R/R (top) aligned with respect to initiation of front-leg rubs (g) or hind-leg rubs (h), and corresponding forward velocity of the fly (bottom). Colour code as in b (also Supplementary Video 9). ik, Translational velocity heatmap (i), stop bout duration (j) and number of walking bouts (k) of grooming flies with BB, FG or BRK silenced (GtACR1; top green bar in (i) depicts optogenetic silencing), n = 11–16 flies per group, median ± interquartile, Kruskal–Wallis test followed by Dunn’s comparison (***P < 0.001, **P < 0.01). l, Number of flies that tripped versus remained stable while grooming in control or BRK silenced flies (GtACR1), n = 18–19 flies per group, Fisher’s exact test (***P < 0.001) (also Supplementary Video 10). m, Proposed role of BRK1-2 in stabilizing the mid- and hind legs during front grooming. n,o, Ball movement (n) and standard deviation of Fe–Ti flexion angle of the hind legs (o) during front grooming in decapitated flies, with subsets of silenced BRK neurons (GtACR1). n = 46–60 bouts, median ± interquartile, Kruskal–Wallis test followed by Dunn’s comparison (***P < 0.001, **P < 0.01).  p, Proposed role of BRK 5-6 in stabilizing the front- and mid-legs during hind grooming. q,r, Ball movement (q) and standard deviation of Fe–Ti flexion angle of the front legs (r) during hind grooming in decapitated flies, with subsets of silenced BRK neurons (GtACR1). n = 35–73 bouts, median ± interquartile, Kruskal–Wallis test followed by Dunn’s comparison (***P < 0.001). (See also Supplementary Video 11). Supplementary Table 1 shows full experimental genotypes and exact sample sizes. Source Data
Extended Data Fig. 1
Extended Data Fig. 1. Neural activation screen to identify halting neurons.
a. Translation velocity heat map of free-walking, control flies and broad lines expressing CsChrimson. Red bars at bottom of heatmap indicate 5 trials of 10 s red light driven optogenetic stimulation. n = 16 flies per genotype. b. From (a), showing trial averaged (mean ± s.e.m.) translational velocity (top) and angular velocity (bottom) of FG (SS40909), FG∩ChAT (MB), FG + BB (SS31328). c. Immunohistochemistry images of genetic reagents used in (b); white arrowheads show mushroom bodies (MB) (CsChrimson-mVenus: green, neuropil: magenta, scale bars: 100 μm (brain), 50 μm (VNC)). d. Translation velocity heat map (every row shows velocity of single fly) of free-walking flies with a focus on sparse genetic lines labelling BRK. Red bars at bottom of heatmap indicate five trials of 10 s red light driven optogenetic stimulation. Source Data
Extended Data Fig. 2
Extended Data Fig. 2. Activating any BRK neuron is sufficient to drive halting.
a. EM segmentation of all 6 BRK neurons. Insets show BRK axonal projections in the brain (top) and VNC (bottom). b. Connectome-based wiring diagram showing BRK major post-synaptic partners in the brain and VNC. Arrow thickness indicates synaptic strength (top: 5-100 synapses; bottom: 5-400 synapses); red indicates predicted excitatory connections. c. Stochastic expression of CsChrimson-mVenus in distinct subsets of BRK neurons. d. Translation velocity heat map of free-walking flies (every row shows velocity of single fly labelled from A-U) with different BRK segments stochastically labelled. Red bars at bottom of heat map indicate 5 trials of 10 s red light driven optogenetic stimulation. e. Each column represents stochastic CsChrimson expression (for same flies in (d)) in the indicated BRK neurons in a single fly (yellow: show expression; grey: absent/no expression). Translational angular (left) and angular velocity (right) of individual, free-walking flies with only left-BRK (1,3,5) (f) and only right-BRK (2,4,6) (g) optogenetically activated (red bars) using CsChrimson. Data in (f) and (g) are part of the dataset shown in (d). Supplementary Table 1 shows full genotypes and exact sample sizes. Source Data
Extended Data Fig. 3
Extended Data Fig. 3. High resolution 3D leg kinematics analysis.
a. Schematic of the eight-camera setup. A fly tethered to a pin at its thorax is mounted on an air supported ball at the center. The fly is illuminated using a custom-made IR-LED ring from above. Seven synchronized high-speed cameras image the fly from different sides. The top-down camera is used to guide the alignment of the fly on the surface of the ball such that it is centered. Two motion sensors track the rotations of the ball allowing the reconstruction of the fly’s virtual trajectory and velocity. Red light for optogenetic activation is supplied through an optical fibre in front of the fly. b. Example traces of the four flexion angles (body-coxa, coxa-trochanter, femur-tibia and tibia-tarsus) for all 6 legs in a tethered walking fly. Grey shading indicates swing phase of the step cycle. c. Stopping bout durations (left) (n = 22–75 bouts per genotype, median ± interquartile) and stopping latency (right) (n = 17–40 trials per genotype, median ± interquartile) during optogenetic activation of BB, FG and BRK. Mann-Whitney Test to compare between FG and BRK (***p < 0.001). d. Number of steps before the flies stop upon optogenetic activation of BB, FG and BRK, compared to control flies e. Standard deviation of all flexion angles calculated over the whole light-ON period, for the respective genotypes. Kruskal–Wallis test followed by Dunn’s multiple comparison with control (median ± interquartile, *p < 0.05, ***p < 0.001). Supplementary Table 1 shows full genotypes and exact sample sizes. Source Data
Extended Data Fig. 4
Extended Data Fig. 4. Walk-Halt Co-activation.
a. Light microscopy images of combined split-Gal4 lines comprising walk neurons (P9, BPN, MDN) and halt neurons (BRK, FG, BB, and the FG + BB line). Arrows indicate walk neurons, and asterisks show halt neurons. Ectopic expression is indicated as cell numbers. b. Per-trial translational velocity across all flies (n = 10-16 flies per genotype, 4 trials per fly) with MDN coactivated with BB, FG, BB + FG, or BRK. 10 s light stimulation (red bars) starts at vertical stippled line in velocity plots. c. Fraction of time free-walking flies spent pivoting of upon P9 co-activation with BB, FG, FG + BB, or BRK. Dots indicate individual flies. n = 12-25 flies per genotype, median ± interquartile range. Kruskal-Wallis test followed by Dunn’s multiple comparison with genetic-background control (***p < 0.001). See Supplementary Video 2 and 3. Supplementary Table 1 shows full genotypes and exact sample sizes. Source Data
Extended Data Fig. 5
Extended Data Fig. 5. Validating morphology and neurotransmitter profiles across light and electron microscopy data.
a. MCFO-colormip (color-coded maximum intensity projection) comparison (brain and VNC) for neurons of major interest in this study, grouped by halt and walk neuronal types, and by their major downstream synaptic partners. Nomenclatures to annotations given in light- and electron-microscopy datasets. White arrowheads show neuron of interest. b. Neurotransmitter profile for the combined FG + BB split-Gal4 using FISH. Arrows indicate BB/FG soma. c. Light-microscopy images of genetic line co-labelling BRK and BON1; (GCaMP6s: green, ChrimsonR-mCherry: magenta, scale bars: 100 μm, white arrowheads indicate BON1 soma). d. EM segmentation of BRK and BON1 in the VNC. e. BON1(Brake Output Neuron 1) activity (GCaMP6s) in explant brains without or with BRK activated (ChrimsonR). 2 s optogenetic activation (red bar) starts at vertical stipple line. n = 5-6 brains per genotype, mean ± s.e.m. f. Area under the curve (AUC) for 0-2 s after stimulation onset both in control and BRK activated groups from (e), median±interquartile, dots indicate number of brains. Source Data
Extended Data Fig. 6
Extended Data Fig. 6. Analysis pertaining to Walk-OFF and Brake mechanisms.
a. DNs recruited by BPN and P9 (magenta: contralateral descending; blue: ipsilateral descending; grey: unidentified descending arbors). b,c. Scatter plot showing DNs downstream of (b) BPN and (c) P9 differentially affected by FG versus BB. d. Expression pattern of split-Gal4 lines covering oDN1 and BDN2. (CsChrimson-mVenus: green, neuropil: magenta, scale bars: 50 μm). e. Trial averaged translational velocity (left) and angular velocity (right) of decapitated, tethered flies while activating P9, oDN1, or BDN2. 3 s light stimulation (red bars) starts at vertical stippled lines in velocity plots. n = 7-10 flies per genotype, mean ± s.e.m. f. Probability density of front leg joint angle (body-coxa, coxa-trochanter and tibia-tarsus) if BRK or FG was optogenetically activated during swing phase (top) or during stance phase (bottom). n = 7-33 trials averaged across 6-17 flies on the ball. g. Light microscopy images of combined split-Gal4 lines for co-labelling BRK and BDN2. Magenta arrowheads in the brain indicate BDN’s soma (left), empty arrowhead in the VNC indicate BRK’s soma (right). h. EM segmentation of BRK and BDN2 in the brain (left) and VNC (right). Supplementary Table 3 describes all connectome IDs. Supplementary Table 1 shows full genotypes and exact sample sizes. Source Data
Extended Data Fig. 7
Extended Data Fig. 7. Different halt neurons have distinct effects on muscle activity.
a. Left front leg femoral muscle activity (MHC>GCaMP6f, color coding as in Fig. 4k) measured under epifluorescence (1 P) while Fe-Ti joint is restrained in a flexed (top) or extended (bottom) position in control (left) and BRK-activated flies (right), with optogenetic stimulation (red bar) delivered during high baseline muscle activity. Light stimulation starts at vertical stippled line in velocity plots. n = 5-9 flies per group (flexed or extended), mean ± s.e.m. b. Same dataset as in (a), but plotted as variance-normalized ΔF/F for better visualization of change in accessory flexors and extensors (i.e. the high ΔF/F pre-stimulus values of flexors in (a) expand the Y-Axis). n = 5-9 flies per group (flexed or extended), mean ± s.e.m. c. Left front leg femoral muscle activity measured under epifluorescence (1 P) while the Fe-Ti joint is forcibly flexed (top) or extended (bottom) in control (left) or BRK-activated flies (right) during light stimulation (red bar). 1 s passive flexion/extension start at vertical stippled lines in plots. n = 32-40 trials pooled across 5 flies per genotype, mean ± s.e.m. d. Femoral muscle activity (1 P) in Fe-Ti joint kept flexed (top) or extended (bottom) in FG- (left) or BB-activated flies (right). Top red bar indicates 1.6 s optogenetic stimulation. mean ± s.e.m., n = 6-7 flies per group (flexed or extended). e,f. As in (a,b), but for FG (left) and BB activation (right) upon high baseline muscle activity, with calcium traces shown as ΔF/F (e) and variance-normalized ΔF/F (f), n = 6-7 flies per group (flexed or extended). Supplementary Table 1 shows full genotypes and sample sizes. Source Data
Extended Data Fig. 8
Extended Data Fig. 8. Evaluating the role of different halt neurons in the context of feeding.
a. FG activity (GCaMP7b) during activation (ChrimsonR) of sweet gustatory sensory neurons (Gr5a, in fed or starved flies) or bitter gustatory sensory neurons as controls (Gr66a, in fed flies). 2 s optogenetic activation (red bar) starts at vertical stipple line. n = 5-9 flies per genotype, mean ± s.e.m. b. Area under the curve (AUC) for 0-1 s after stimulation onset in each group in (a), median ± interquartile, dots indicate number of flies, Kruskal-Wallis test followed by Dunn’s comparison with control (**p < 0.01). c. BB activity (GCaMP7b) with Gr5a activated (in fed or starved flies) or without Gr5a neurons activated (fed flies). 2 s optogenetic activation (red bar) starts at vertical stipple line. n = 4-5 flies per genotype, mean ± s.e.m. Traces from starved flies (Gr5a and control groups) are also plotted in Fig. 5b. d. Area under the curve (AUC) for 0-2 s after stimulation onset in each group from (c), median ± interquartile, dots indicate number of flies, Kruskal-Wallis test followed by Dunn’s comparison with control (*p < 0.05). e. Top: change in activity of oDN1 while co-stimulating P9 and sugar GRNs across a range of stimulation rates in model with BB silenced. Bottom: change in activity of BDN2 while co-stimulating BPN and sugar GRNs across a range of stimulation rates in model with BB silenced. Normalization of firing rate as in model with FG silencing in Fig. 5c, d. f, g. Translational velocity (f) and angular velocity (g) heatmaps of starved, free-walking flies with BB, FG and BRK silenced (GtACR1), compared to control flies. Green bar on top indicates green light stimulation. Arrowheads indicate the time point when the fly first encounters sucrose (arrowheads). n = 29-36 flies per genotype. h,i. Data from (f, g) showing translational velocity (h, mean ± s.e.m.) and angular velocity (i, mean ± s.e.m.) during the 5 s post-food encounter. j. Proboscis extension response (PER) upon sucrose presentation in flies with FG, BB, BRK, or Gr64f (sugar sensory neurons used as positive controls) silenced (GtACR1) compared to control flies. n = 26-34 flies per genotype, mean with 95%CI, Fisher’s exact test for comparison with control (***p < 0.001). Also see Supplementary Video 8. k. Overlay of trajectories of 3 flies in the two-choice assay for BB, FG or BRK silenced flies (GtACR1), compared to controls. Red line demarcates the blank side from the sucrose side. Supplementary Table 1 shows full genotypes and exact sample sizes. Source Data
Extended Data Fig. 9
Extended Data Fig. 9. Connectome and behavior-based segment-specific analysis of BRK neurons.
a. EM visualization of head-grooming command neurons DNg12 that connect with BRK1-2 with 674 synapses (left) and wing-grooming command neurons wPN1 that connect with BRK5-6 with 284 synapses (right). b. Connectivity diagram showing segment-specific grooming command inputs to BRK from head-grooming pathway (DNg12), wing-grooming pathway (wpN1) or potential leg-grooming pathway. (BL: Bristle, HP: hairplate, CS: Campaniform sensilla). c. Simulation of feeding or grooming contexts by modeling sugar GRNs and eye bristles activation in the connectome-constrained network model, respectively. Colors and associated values in heatmap indicate firing rate (Hz) of FG, BB and grooming command DNs (DNg12s), which project to the front-BRK 1-2 neurons. d. Immunohistochemistry images of the genetic drivers used in Fig. 6n–r, showing targeting of segment-specific BRK neurons in the brain and VNC. (GTACR1-EYFP - expression; scale bars: 100 μm). e. Trial averaged translational velocity (mean ± s.e.m.) of free-walking flies with CsChrimson expressed only in BRK1-2, BRK1-4, BRK1-2,5-6 or BRK 1-6. 10 s optogenetic stimulation (red bars) starts at vertical stippled lines in velocity plots. n = 5–16 flies per genotype. f. 2nd order outputs of BRK in the VNC receive input from sensory neurons (mostly proprioceptive, blue) and provide output to accessory tibia flexor motor neurons (Acc. Ti flexor MN, yellow). In (b,f) arrow thickness indicates synaptic strength (5-400 synapses, 5-300 synapse resp.). Red indicates excitatory connections; blue indicates predicted inhibitory connections. g. Examples of femur-tibia flexion angle heatmaps for front (top) and hind (bottom) legs in tethered, decapitated flies where front-grooming was induced, while silencing different subsets of BRK neurons. Quantified in Fig. 6o. h. As in (g), for tethered, decapitated flies where hind-grooming was induced. Quantified in Fig. 6r. Also see Supplementary Video 11. Supplementary Table 1 shows full genotypes and exact sample sizes. Source Data
Extended Data Fig. 10
Extended Data Fig. 10. Connectome-guided prediction of novel halting pathways.
a,b. Simulated firing rate for activating P9, P9 + MAN1, P9+OViDN (a) and BPN, BPN + MAN1, BPN+OViDN (b). Nodes in the wiring diagram are color-coded based on firing rate in the full simulation, identical to the heatmap; color-scale is normalized to the maximum trial averaged firing rate achieved in the case of the respective walk neuron activation simulation. Arrow thickness indicates synaptic strength (5-400 synapses). Red indicates excitatory connections; blue indicates inhibitory connections. Asterisks indicate neurons (oDN1, BDN2) selected for further analysis in Fig. 3. c. Connectome based prediction of halting neurons. Dark red filled circles indicate empirically verified halt neurons and light red filled circles indicate predicted halt neurons. Dark green filled circles indicate empirically verified walk neurons and light green filled circles indicate predicted walk neurons. Arrow thickness indicates synaptic strength (i.e. synaptic counts). Red indicates excitatory connections; blue indicates predicted inhibitory connections. d. EM segmentation of predicted halt neurons in the brain. e. Input brain region for predicted stop neurons. f. Sensory-motor circuit layout for stationary behaviors including feeding, egg-laying, grooming and for a generic halting pathway (grey). Distinct sensory pathways recruit specific command-like neurons – such as Fdg for feeding (magenta), oviDNs for egg-laying (green) and DNg12/wPN1 for grooming (blue) – that initiate context appropriate behaviors, by recruiting context-specific halting pathways (red) and motor programs. Filled circles represent neurons; solid arrows indicate monosynaptic connections; dotted arrows indicate indirect connections. Source Data

References

    1. Bouvier, J. et al. Descending command neurons in the brainstem that halt locomotion. Cell163, 1191–1203 (2015). - PMC - PubMed
    1. Goñi-Erro, H., Selvan, R., Caggiano, V., Leiras, R. & Kiehn, O. Author correction: Pedunculopontine Chx10+ neurons control global motor arrest in mice. Nat. Neurosci.26, 1651 (2023). - PMC - PubMed
    1. Ferreira-Pinto, M. J. et al. Functional diversity for body actions in the mesencephalic locomotor region. Cell184, 4564–4578.e18 (2021). - PMC - PubMed
    1. Howard, C. E. et al. Serotonergic modulation of walking in Drosophila. Curr. Biol.29, 4218–4230 (2019). - PMC - PubMed
    1. Lee, K. & Doe, C. Q. A locomotor neural circuit persists and functions similarly in larvae and adult Drosophila. eLife10, e69767 (2021). - PMC - PubMed

LinkOut - more resources