. 2024 Oct;634(8032):153-165.
doi: 10.1038/s41586-024-07968-y. Epub 2024 Oct 2.

Network statistics of the whole-brain connectome of Drosophila

Affiliations

Network statistics of the whole-brain connectome of Drosophila

Albert Lin et al. Nature. 2024 Oct.

Abstract

Brains comprise complex networks of neurons and connections, similar to the nodes and edges of artificial networks. Network analysis applied to the wiring diagrams of brains can offer insights into how they support computations and regulate the flow of information underlying perception and behaviour. The completion of the first whole-brain connectome of an adult fly, containing over 130,000 neurons and millions of synaptic connections1-3, offers an opportunity to analyse the statistical properties and topological features of a complete brain. Here we computed the prevalence of two- and three-node motifs, examined their strengths, related this information to both neurotransmitter composition and cell type annotations4,5, and compared these metrics with wiring diagrams of other animals. We found that the network of the fly brain displays rich-club organization, with a large population (30% of the connectome) of highly connected neurons. We identified subsets of rich-club neurons that may serve as integrators or broadcasters of signals. Finally, we examined subnetworks based on 78 anatomically defined brain regions or neuropils. These data products are shared within the FlyWire Codex ( https://codex.flywire.ai ) and should serve as a foundation for models and experiments exploring the relationship between neural activity and anatomical structure.


Conflict of interest statement

The authors declare no competing interests.

Figures

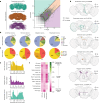
Fig. 1
Fig. 1. Whole-brain network properties.
a, The FlyWire dataset is an electron microscopy reconstruction of the whole brain of an adult female Drosophila. Conn., connection. b, The distribution of synapses per connected neuron pair. c, In-degrees plotted against out-degrees, with log-scale x and y axes. d, A giant SCC contains 93.3% of all neurons. The distribution of path lengths within this SCC is plotted. e, A giant WCC contains 98.8% of all neurons. The distribution of path lengths between neuron pairs within this WCC is plotted. f, The sizes of the two largest SCCs as neurons are removed by total degree (2,500 neurons per step). The brain splits into two SCCs when neurons of approximately degree 50 start to be removed, a deviation from when neurons are removed randomly (dotted lines). The largest surviving total degree as a function of the number of remaining neurons is plotted in grey. g, Removal of neurons starting with the smallest degree results in a single giant SCC until most neurons are removed (2,500 neurons per step). The smallest surviving total degree as a function of the number of remaining nodes is plotted in grey. For each graph in f and g, the red and blue curves are read with the left y axis and the grey curve is read with the right y axis. h, The relative rich-club coefficient (coef.) as a function of total degree, computed relative to CFG models. We take neurons with total degree >37 to be within the rich-club regime.
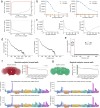
Fig. 2
Fig. 2. Characterizing reciprocal connections in the brain.
a, The average (avg.) reciprocal and unidirectional edge weights. b, Breakdown of unidirectional and reciprocal edges by neurotransmitter. c, The frequency of neurotransmitter pairs forming reciprocal connections (grey) compared with the expected frequency of neurotransmitter pairs under the assumption of independent neurotransmitter choice (pink). d, The relative strengths (synapse (syn.) counts) of the two connections forming ach–GABA reciprocal pairs (left), ach–glutamate reciprocal pairs (centre) and ach–ach reciprocal pairs (right). e, The distributions of reciprocal degree for cholinergic neurons (left), GABAergic neurons (middle) and glutamatergic neurons (right). f, Scatter plot of 2× reciprocal degree against total degree. The dotted lines indicate a factor of 2 around the x = y line. g, Visualizations of exemplar reciprocal neuron pairs.
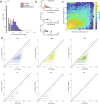
Fig. 3
Fig. 3. Examining three-node motifs.
a, The distribution of three-node motifs across the whole brain. Absolute counts of each motif are shown on the left, and the frequency of each motif relative to that in an ER null model is plotted on the right, together with the average motif frequencies of 100 CFG models (grey violin plots). b, The average strength of three-node motif edges. The dotted line is the average connection strength in the brain. c, Breakdown by neurotransmitter of edges participating in two motifs: feedforward loops (motif 4) and 3-unicycles (motif 7). d,e, Neurotransmitter compositions of feedforward loops (motif 4) (d) and 3-unicycles (motif 7) (e). f, Visualizations of exemplar three-node motifs.
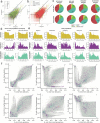
Fig. 4
Fig. 4. Large-scale neuron connectivity in the brain.
a, We grouped the intrinsic rich-club neurons into three categories by in-degree/out-degree ratio: broadcasters, integrators and large balanced neurons. b,c, Comparison of the prevalence of neurotransmitters (b) and super classes (c) of all intrinsic neurons, rich-club neurons, integrators and broadcasters. opt. int., optic lobe intrinsic; vis. cent., visual centrifugal; vis. proj., visual projection. d, Examples of rich-club neurons in these three categories. e, Applying the information flow model from refs. ,, we determined the percentile rank distributions of rich-club, integrator and broadcaster neuron populations from all inputs to the brain, as well as to specific modalities (Extended Data Fig. 4e). f, The average percentile rank of rich-club, integrator and broadcaster neurons for different modalities. JO, Johnston’s organ; Mech., mechanosensory.
Fig. 5
Fig. 5. Neuropil-specific differences in connectivity.
a, An exploded view of the brain showing the neuropils of the Drosophila brain. Each synapse is assigned to a neuropil based on its location. b, Schematic of how neuropil subnetworks are identified for motif analyses. c, Reciprocity within each neuropil subnetwork. d,e, The differences in the percentage of cholinergic (d) and GABAergic (e) edges between reciprocal and unidirectional connections across different neuropils. The absolute percentages are shown in Extended Data Fig. 6. f, The relationship between excitatory and inhibitory connection strengths in reciprocal connections in different brain regions. g, The number of NSRNs in different neuropils. Examples of NSRNs are shown to the right. h, Map of the total number of reciprocal pairs between different neuropils. Examples of such pairs are shown in Extended Data Fig. 7e. Definitions for neuropils are provided in Supplementary Fig. 1. L and R in parentheses indicate the left and right side of the brain.
Fig. 6
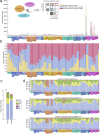
Fig. 6. Differences in three-node motifs across neuropils.
a, Three-node motif distributions for three example neuropils: the EB, AL(R) and right mushroom body medial lobe (MB-ML(R)). The frequency of each motif relative to that in an ER null model is plotted on the right, together with the average motif frequencies of 100 CFG models (grey violin plots). Further examples of other neuropils are shown in Extended Data Fig. 8a. b, The motif frequencies for the three-node motifs across all 78 neuropil subnetworks, normalized to their respective CFG models. c, The average strengths of edges participating in three-node motifs in the different neuropil subnetworks relative to the average three-node motif strength in each subnetwork. Average strengths relative to the average neuropil subnetwork edge strength are shown in Extended Data Fig. 8b.
Extended Data Fig. 1
Extended Data Fig. 1. Thresholding, connections as a function of distance, and spectral analyses.
The effects of edge percolation on the size of the largest WCC when (a) large connections are removed first and when (b) small connections are removed first. (c) The sizes of the first two SCCs as a function of the synapse threshold. (d) Synapse probability (left) and connection probability (right) as a function of the average distance between neuronal arbours. Plots are of a drawn from a subsample of 700 million pairs (5% of the total 14 billion pairs). (e) The probability of random connection of the two-zone spatial null model, with one close regime with high connection probability and a distant regime with low connection probability. Spectral analysis of the whole-brain network with (f) forward and (g) reverse walks. In each case, the stationary probability distributions are shown, as well as the distribution of neuropils in which the inputs and outputs of the top 3000 most visited neurons are located. Renders of the top 3% attractor (red) and repeller (green) neurons are also shown. The top 0.3% are rendered in darker colours.
Extended Data Fig. 2
Extended Data Fig. 2. Additional connected components and rich club analyses.
(a) The sizes of the first two weakly connected components (WCCs) as nodes are removed by total degree (1 neuron per step). Removal of neurons starting with those with largest degree results in the brain splitting into two WCCs when neurons of approximately degree 50 start to be removed, a deviation from when neurons are removed in a random order (dotted lines). The largest surviving total degree as a function of the number of remaining nodes is plotted in grey. (b) Removal of neurons starting with those with smallest degree results in a single giant WCC until all neurons are removed. The smallest surviving total degree as a function of the number of remaining nodes is plotted in grey. (c) The sizes of the first two strongly connected components (SCCs) as nodes are removed by in-degree or out-degree (2500 neurons per step). Removal of neurons starting with those with largest in-degree (top left) or largest out-degree (top right) result in the brain splitting into two SCCs when neurons of approximately degree 50 start to be removed, a deviation from when neurons are removed in a random order (dotted lines). Removal of neurons starting with those with smallest in-degree (bottom left) or smallest out-degree (bottom right) results in a single giant SCC until all neurons are removed. (d) The sizes of the first two weakly connected components (WCCs) as nodes are removed by in-degree or out-degree (1 neuron per step). Removal of neurons starting with those with largest in-degree (top left) or largest out-degree (top right) result in the brain similarly splitting into two WCCs when neurons of approximately degree 50 start to be removed, a deviation from when neurons are removed in a random order (dotted lines). Removal of neurons starting with those with smallest in-degree (bottom left) or smallest out-degree (bottom right) results in a single giant WCC until all neurons are removed. (e) The relative rich club coefficient (Φnorm=Φ/ΦCFG, blue) as a function of total degree (left). The absolute observed rich-club coefficient (Φ) is plotted in solid red, and the rich-club coefficient from a CFG model (ΦCFG) is plotted in dotted red. To the right is plotted the degree distribution showing the rich club regime cutoff. (f) The rich club coefficient plotted as a function of in-degree (left) and out-degree (right), relative to CFG models. (g) The relative rich club coefficient (Φnorm(NPC)=Φ/ΦNPC, orange) as a function of total degree. The absolute observed rich-club coefficient (Φ) is plotted in solid red, and the rich-club coefficient from a NPC model (ΦNPC) is plotted in dotted red. (h) Survival curves for the percentages of ach, GABA, and glut neurons remaining as a function of total degree.
Extended Data Fig. 3
Extended Data Fig. 3. Reciprocal connectivity and degree.
(a) Distribution of reciprocal degree (grey) alongside distributions of in-degree (red) and out-degree (blue). (b) Distributions of reciprocal degree for glut, da, oct, and ser neurons. (c) Heatmap showing the fraction of reciprocal incoming connections versus the fraction of reciprocal outgoing connections. (d) Scatterplots of 2 times the reciprocal degree of neurons versus their total degree, divided by neurotransmitter. Dotted lines indicate a factor of 2 around the x = y line.
Extended Data Fig. 4
Extended Data Fig. 4. Additional large-scale connectivity analyses.
In-degree vs. out-degree scatterplots showing broadcaster, rich balanced, and integrator regimes, with neurons plotted by (a) the putative neurotransmitter of each neuron and (b) the super class of each neuron. (c) Comparing the input and output sides of all intrinsic neurons, rich club neurons, integrators, and broadcasters. The asymmetry in L/R percentages for broadcaster neurons is due to the large number of medulla-intrinsic broadcasters which connect with photoreceptors (Proofreading of photoreceptors was incomplete in Snapshot v630). (d) Percentile rank distributions of central and optic lobe intrinsic neuron populations to all inputs. (e) Percentile rank distributions of rich club, integrator, and broadcaster neuron populations from various input modalities. (f) Scatterplots of percentile rank from one sensory modality on each axis. Broadcaster neurons are highlighted in teal and integrator neurons are highlighted in purple.
Extended Data Fig. 5
Extended Data Fig. 5. Internal and external connections across neuropils.
(a) The number and (b) relative fraction of neuron weights in each neuropil making connections internal to that neuropil, external incoming connections, and external outgoing connections. Each neuron contributes a total weight of 1, computed based on the fraction of incoming and outgoing synapses the neuron has in each neuropil. (c) Comparing the neurotransmitter composition of all internal and all external neuron weights across the whole brain and (d) by neuropil.
Extended Data Fig. 6
Extended Data Fig. 6. Additional neuropil-specific connectivity differences.
(a) The number of neurons included in each neuropil subnetwork. (b) The average connection strength (synapse threshold of 5 synapses/connection applied) of connections made in each neuropil (above), and the connection probability of each neuropil (below). (c) Reciprocity normalized by connection density for all 78 neuropils. (d) Average reciprocal connection strength normalized by average unidirectional connection strength in all neuropils. (e) The relative fraction of glutamatergic neurons participating in reciprocal and unidirectional connections. Absolute percentages of (f) acetylcholine, (g) GABA, and (h) glutamate occurrence in unidirectional and reciprocal connections within each neuropil subnetwork.
Extended Data Fig. 7
Extended Data Fig. 7. Reciprocal connections within and between neuropils.
(a) Heatmaps showing the relationship between excitatory (ach) and inhibitory (GABA) connection strengths in reciprocal connections in different brain regions. (b) Ach-GABA reciprocal connection strength correlations (Pearson r-score) for all neuropils. (c) These correlations do not appear to be correlated with neuropil subnetwork size. (d) The neurotransmitter composition of the population of neuropil-specific highly reciprocal neurons (NSRNs). (e) Examples of inter-neuropil reciprocal neuron pairs, one neuron in blue and one neuron in gold. (f) Map of the total number of ach-GABA reciprocal pairs between different neuropils.
Extended Data Fig. 8
Extended Data Fig. 8. Additional differences in three-node motifs across neuropils.
(a) Three-node motif distributions for additional neuropils. The frequency of each motif relative to that in an ER null model is plotted to the right, together with the average motif frequencies of 100 CFG models (grey violin plots). (b) Average strengths of edges participating in 3-node motifs in the different neuropil subnetworks relative to the average edge strength in each subnetwork.

Update of

References

    1. Zheng, Z. et al. A complete electron microscopy volume of the brain of adult Drosophila melanogaster. Cell174, 730–743 (2018). - PMC - PubMed
    1. Dorkenwald, S. et al. Flywire: online community for whole-brain connectomics. Nat. Methods19, 119–128 (2022). - PMC - PubMed
    1. Dorkenwald, S. et al. Neuronal wiring diagram of an adult brain. Nature10.1038/s41586-024-07558-y (2023). - PMC - PubMed
    1. Eckstein, N. et al. Neurotransmitter classification from electron microscopy images at synaptic sites in Drosophila melanogaster. Cell187, 2574–2594 (2024). - PMC - PubMed
    1. Schlegel, P. et al. Whole-brain annotation and multi-connectome cell typing of Drosophila. Nature10.1038/s41586-024-07686-5 (2024). - PMC - PubMed

MeSH terms

Substances

LinkOut - more resources