. 2024 Nov;16(11):2946-2975.
doi: 10.1038/s44321-024-00145-8. Epub 2024 Oct 2.

Jag1 insufficiency alters liver fibrosis via T cell and hepatocyte differentiation defects

Affiliations

Jag1 insufficiency alters liver fibrosis via T cell and hepatocyte differentiation defects

Jan Mašek et al. EMBO Mol Med. 2024 Nov.

Abstract

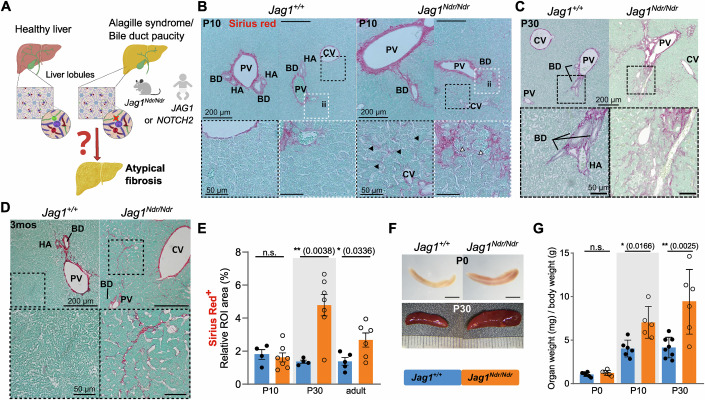
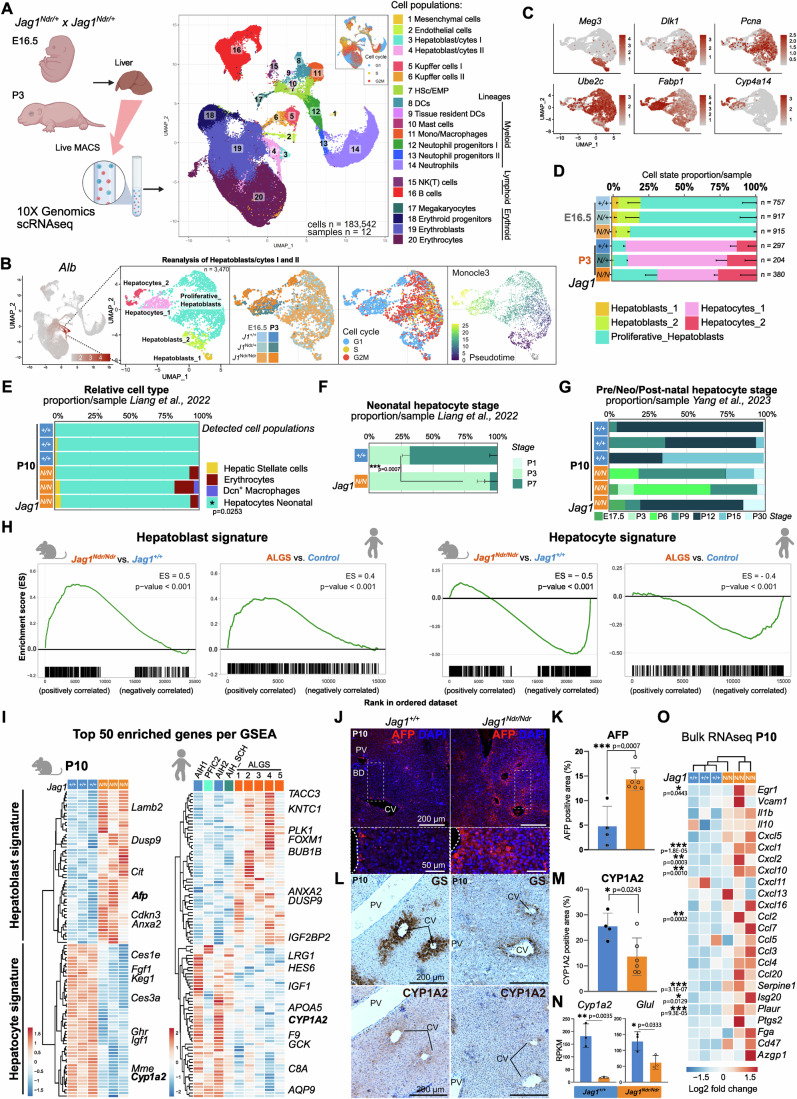
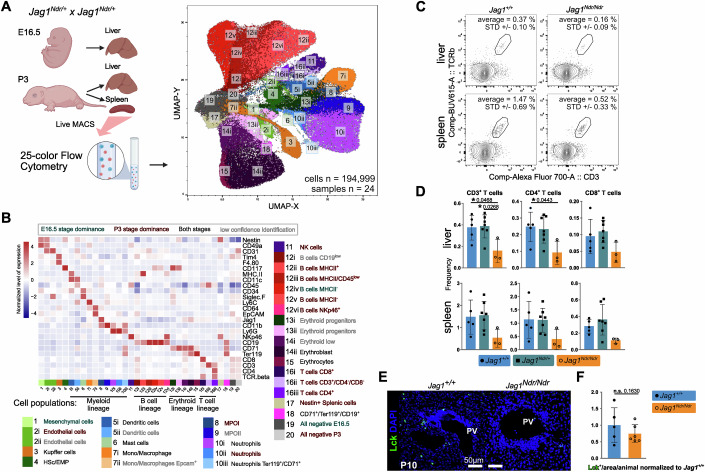
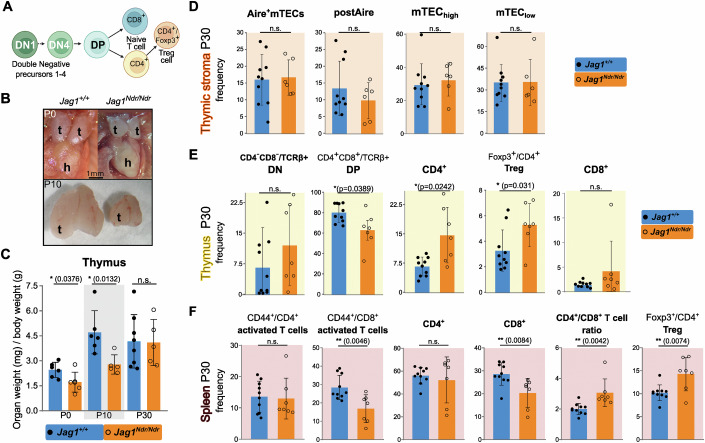
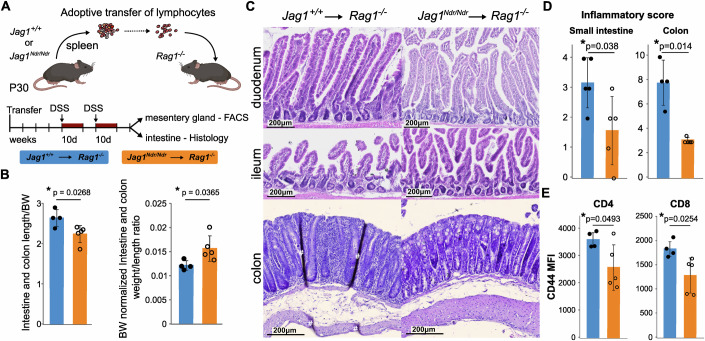
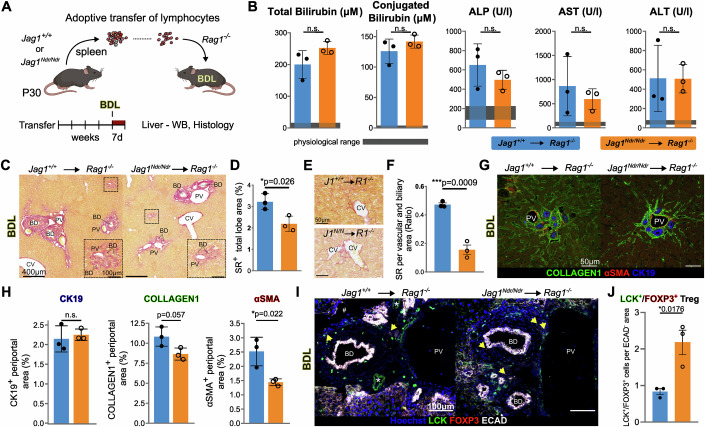
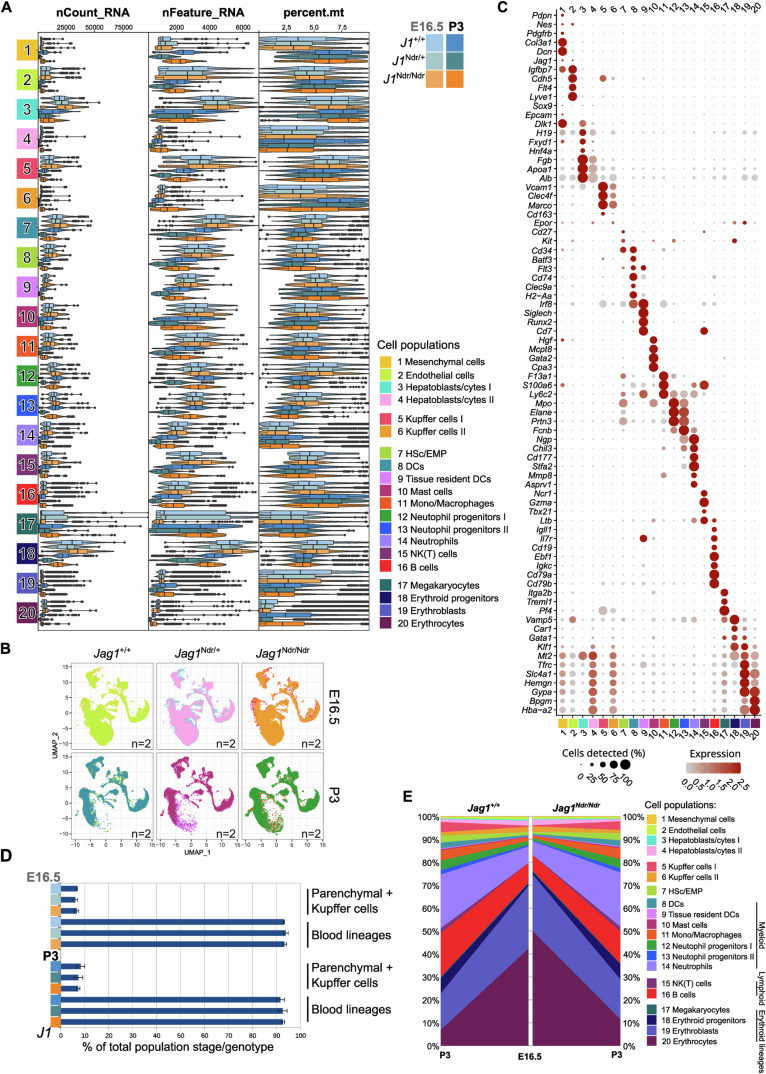
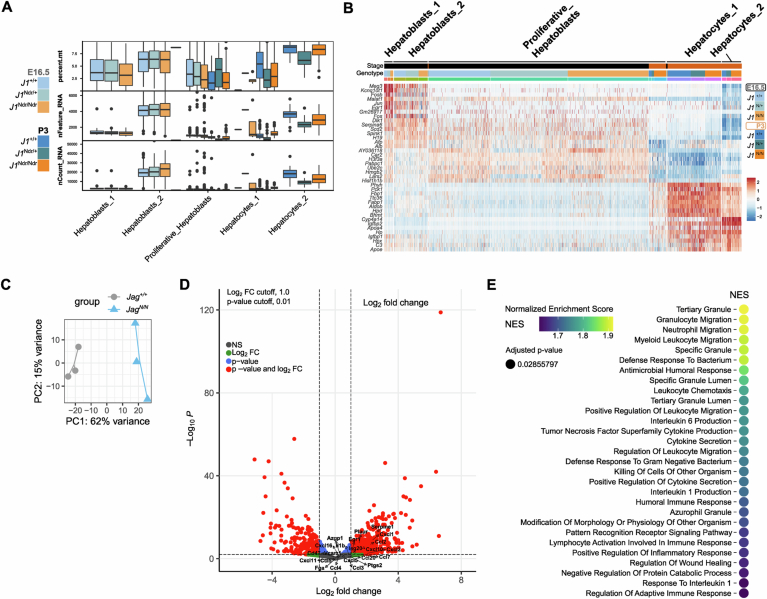
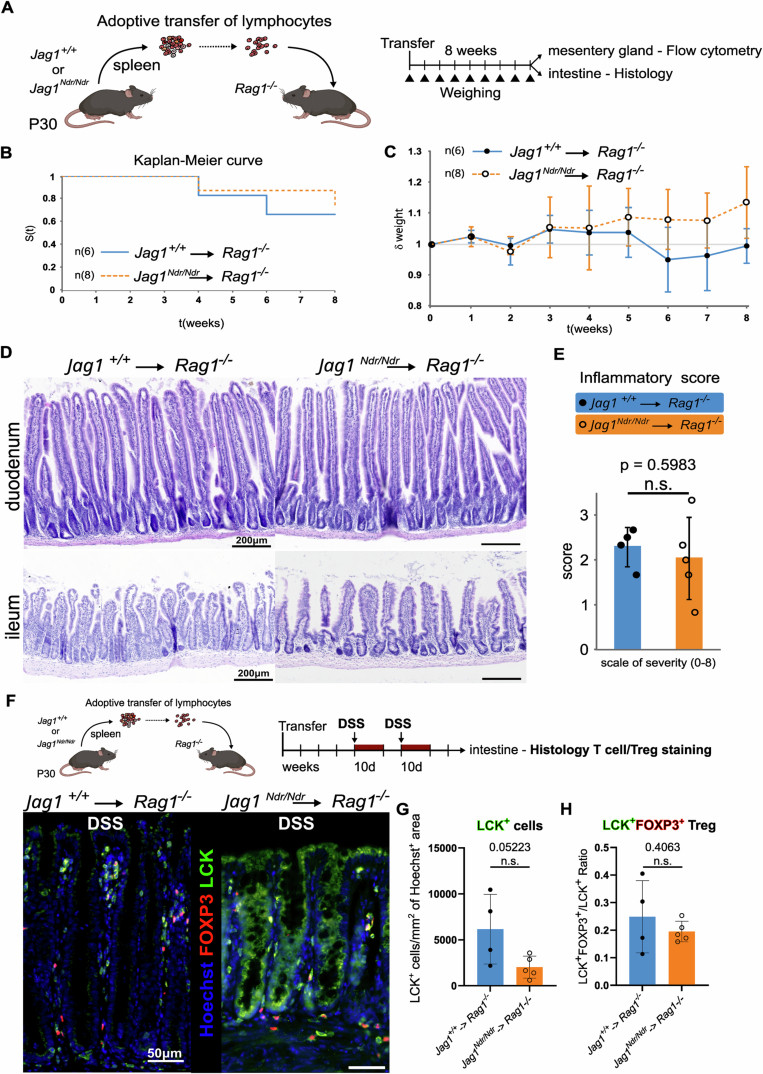
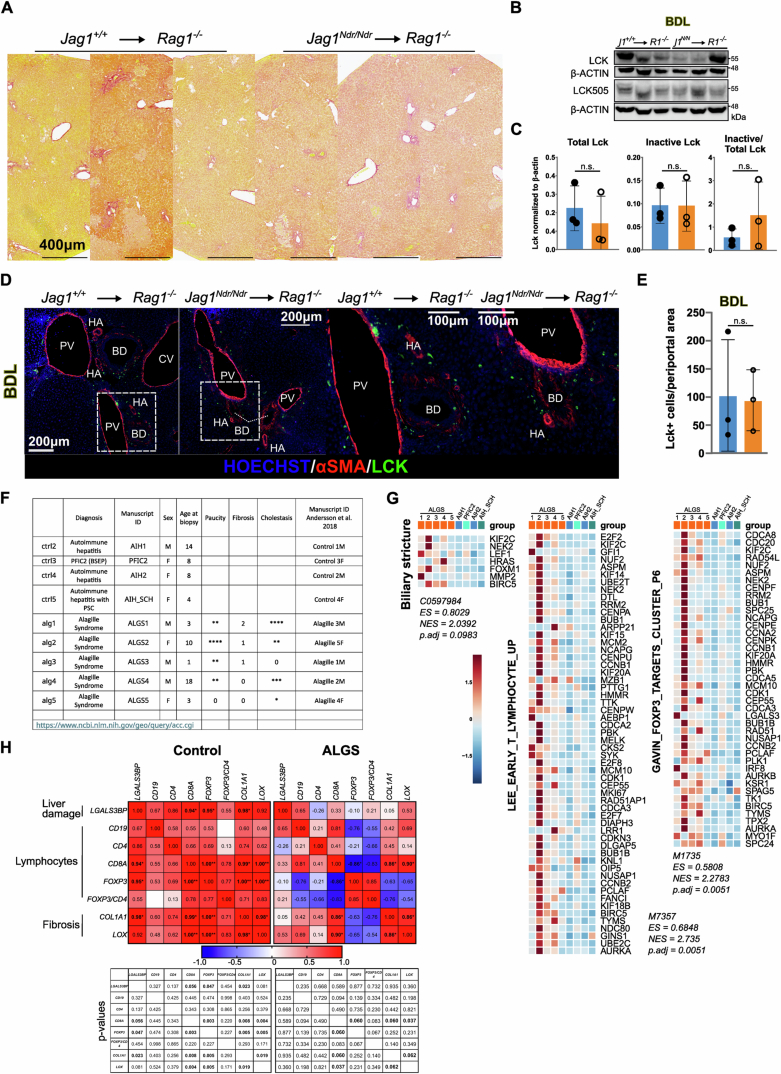
Fibrosis contributes to tissue repair, but excessive fibrosis disrupts organ function. Alagille syndrome (ALGS, caused by mutations in JAGGED1) results in liver disease and characteristic fibrosis. Here, we show that Jag1Ndr/Ndr mice, a model for ALGS, recapitulate ALGS-like fibrosis. Single-cell RNA-seq and multi-color flow cytometry of the liver revealed immature hepatocytes and paradoxically low intrahepatic T cell infiltration despite cholestasis in Jag1Ndr/Ndr mice. Thymic and splenic regulatory T cells (Tregs) were enriched and Jag1Ndr/Ndr lymphocyte immune and fibrotic capacity was tested with adoptive transfer into Rag1-/- mice, challenged with dextran sulfate sodium (DSS) or bile duct ligation (BDL). Transplanted Jag1Ndr/Ndr lymphocytes were less inflammatory with fewer activated T cells than Jag1+/+ lymphocytes in response to DSS. Cholestasis induced by BDL in Rag1-/- mice with Jag1Ndr/Ndr lymphocytes resulted in periportal Treg accumulation and three-fold less periportal fibrosis than in Rag1-/- mice with Jag1+/+ lymphocytes. Finally, the Jag1Ndr/Ndr hepatocyte expression profile and Treg overrepresentation were corroborated in patients' liver samples. Jag1-dependent hepatic and immune defects thus interact to determine the fibrotic process in ALGS.

Keywords: Alagille syndrome; Fibrosis; Jagged1; Notch; Treg.


Conflict of interest statement

Disclosure and competing interests statement The authors declare no competing interests. ERA has formerly collaborated with Travere, and Moderna, with no personal remuneration and no conflict of interest.

Figures

Figure 1
Figure 1. Jag1Ndr/Ndr mice display pericellular fibrosis and signs of portal hypertension.
(A) Schematic of healthy liver architecture and liver architecture with bile duct paucity in patients with ALGS or in Jag1Ndr/Ndr mice. Bile duct paucity results in cholestasis and liver disease, which in ALGS results in atypical fibrosis by unknown mechanisms and associated portal hypertension. (BD) H&E and Sirius red staining at P10 (B), P30 (C) and 3 months (D) in Jag1+/+ and JagNdr/Ndr livers, with boxed regions magnified. Black arrowheads indicate pericellular and perisinusoidal fibrosis, white arrowheads indicate immune infiltration. (E) Quantification of the Sirius Red+ at P10, P30 and 3 months in Jag1+/+ and JagNdr/Ndr LLL liver sections. (F, G) Images (F) and weights (G) of spleens from Jag1+/+ and JagNdr/Ndr mice at the indicated ages. The scalebar in (F) is 1 mm for P0, and at P30 a ruler indicates 1 mm increments. (Each data point represents a biological replicate). Mean ± SD, Unpaired, two-tailed Student’s t-test, *p  ≤  0.05, **p  ≤  0.01, n.s. not significant. For (BD), scalebar lengths are specified within each panel, and are identical within panels. LLL left lateral lobe, mos months, ROI region of interest, BD bile duct, PV portal vein, CV central vein, HA hepatic artery, ii immune infiltrate.
Figure 2
Figure 2. Hepatocytes are less mature in neonatal liver of Jag1Ndr/Ndr mice and patients with ALGS.
(A) Livers were collected at E16.5 or P3 and single-cell suspensions were analyzed by 10xGenomics scRNA sequencing. UMAP projection of 183,542 sequenced cells in cell type-annotated clusters, and cell cycle phase. (B) UMAP of the Hepatoblast/cytes I and II subset, reflecting their subclusters, genotypes, developmental stage, cell cycle status, and differentiation trajectory. (C) Feature plots with hepatoblast (Meg3, Dlk1), proliferation (Pcna, Ube2c), and hepatocyte (Fabp1, Cyp4a14) marker mRNA expression. (D) Average proportion of hepatic cell types per stage and genotype, for data in (B, C). (EG) MuSiC deconvolution of P10 JagNdr/Ndr and Jag1+/+ whole liver bulk RNA seq using scRNAseq reference datasets (E), and stage-specific hepatocyte expression profile (F, G). (H) GSEA for hepatoblast and hepatocyte signatures in Jag1Ndr/Ndr vs Jag1+/+ mice (left of each subpanel) or in patients with ALGS vs other liver diseases (right of each subpanel). Enrichment score (ES) reflects the degree to which a gene set is overrepresented at the top or bottom of a ranked list of genes. p-value was calculated using gene set permutation test (1000 permutations), p-value < 0.001 indicates the actual p-value of less than 1/(number of permutations), see methods for further details. (I) Heatmap of top 50 enriched genes from each GSEA in (H) for mouse (left) and human (right) liver. (J, K) Staining for AFP and DAPI at P10 in Jag1+/+ (n = 4) and Jag1Ndr/Ndr (n = 7) livers (J), with quantification (K). Scalebar lengths are specified within the panel and are identical for Jag1+/+ and Jag1Ndr/Ndr mice. (LN) Staining for GS and CYP1A2, with H&E counterstain (L), in consecutive sections at P10 in Jag1+/+ (n = 4) and Jag1Ndr/Ndr (n = 6) livers, with quantification of CYP1A2 protein (M), and P10 whole liver Cyp1a2 and Glu1 mRNA expression (n = 3 each) (N). Scalebar lengths in (L) are specified within the panel and are identical for Jag1+/+ and Jag1Ndr/Ndr mice. (O) Heatmap of Egr1-induced pro-inflammatory genes expressed by hepatocytes in Jag1Ndr/Ndr and Jag1+/+ mice at P10. HSc Hematopoietic Stem cells, EMP erythroid-myeloid progenitors, DCs dendritic cells, NK natural killer, AIH autoimmune hepatitis, PFIC2 progressive familial intrahepatic cholestasis type 2, SCH sclerosing cholangitis (mean ± SD; (E) was analyzed with 2-way ANOVA with Sidak multiple comparison). Interaction between cell type proportion and genotype is significant with p-value = 0.0139, graph indicates p-value of the multiple comparison. Data in (F), (K), (M), and (N) were analyzed by unpaired, two-tailed Student’s t-test, *p < 0.05, **p < 0.01, ***p < 0.001, in (O) was significance confirmed via Benjamini–Hochberg P value correction (Log2 FC > 0.5).
Figure 3
Figure 3. Flow cytometry analyses reveal a reduction of T cells in Jag1Ndr/Ndr liver.
(A) UMAP projection of 194,999 randomly selected sub-sampled cells from E16.5 and P3 liver and P3 spleens, analyzed by 25-color flow cytometry, with cell type-annotated clusters, matched to (Fig. 2A) insofar as possible. (B) Heatmap showing a row z-score of median protein expression levels of cell type markers in the aggregated 25-color flow cytometry dataset from E16.5 and P3 livers, and P3 spleens of Jag1+/+ (n = 7), Jag1Ndr/+ (n = 11), and Jag1Ndr/Ndr (n = 6) animals. (C, D) Representative flow cytometry plots (C) and relative frequency of the CD3+, CD4+/CD3+, and CD8+/CD3+ T cells in livers and spleens from the Jag1+/+, Jag1+/Ndr and Jag1Ndr/Ndr mice at P3 (D). (E, F) Representative immunofluorescent staining (E) and quantification (F) of LCK+ T cells in periportal areas in Jag1Ndr/Ndr and Jag1+/+ livers at P10 (n = 5 Jag1+/+, and 6 JagNdr/Ndr animals). PV, portal vein. Scalebar lengths in (E) are specified within the panel and are identical for Jag1+/+ and Jag1Ndr/Ndr mice. HSc hematopoietic stem cells, EMP erythroid-myeloid progenitors, MPO myeloid progenitors, NK natural killer. All graphs represent mean ± SD. Statistical test in (D) is one-way ANOVA with Dunnett’s multiple comparison test, (Jag1+/+ vs. Jag1Ndr/Ndr) Jag1+/Ndr and Jag1Ndr/Ndr, and in (F) is an unpaired, two-tailed Student’s t-test, *p < 0.01); Each data point represents a biological replicate.
Figure 4
Figure 4. Thymic developmental delay and excess Tregs in postnatal Jag1Ndr/Ndr mice.
(A) Schematic of thymocyte development in the thymus. (B) Macroscopic images of Jag1+/+ and Jag1Ndr/Ndr thymi at P0 and P10. (C) Thymic weights at P0, P10 and P30, normalized to body weight. (DF) Flow cytometric analyses of cell frequencies of thymic epithelial cells, TECs (D), thymic thymocytes/T cells (E), and splenic T cells (F) in Jag1+/+ and Jag1Ndr/Ndr mice at P30. Each data point represents a biological replicate. Mean ± SD, Unpaired, two-tailed Student’s t-test, *p  ≤  0.05, **p  ≤  0.01, n.s. not significant. t thymus, h heart, DN double negative, DP double positive, Mac macrophage, NK natural killer cell, TEC thymic epithelial cell, mTEC medullary TEC, cTEC cortical TEC, Treg regulatory T cell.
Figure 5
Figure 5. Jag1Ndr/Ndr T cells do not mount an adequate response to DSS-induced colitis.
(A) Scheme of the Dextran sodium sulfate (DSS)-induced colitis. (B) Length, and weight/length ratios of the intestines and colons from DSS-treated Jag1+/+→ Rag1−/− (n = 4) and Jag1Ndr/Ndr→Rag1−/− (n = 5) mice, normalized to body weight. (C, D) Representative H&E-stained intestinal (top), and colonic (bottom) sections from Rag1−/− mice transplanted with Jag1+/+ or Jag1Ndr/Ndr T cells, upon DSS treatment (C), and their inflammatory scores (D). (E) Flow cytometry analysis of the mean fluorescence intensity (MFI) of CD44 staining of CD4+ and CD8+ T cells from DSS-treated Jag1+/+→Rag1−/− and Jag1Ndr/Ndr→Rag1−/− mesenteric lymph nodes. Each data point represents a biological replicate. mean ± SD, Unpaired, two-tailed Student’s t-test, *p  ≤  0.05. # - tissue folding artifact.
Figure 6
Figure 6. Jag1Ndr/Ndr Tregs limit the extent of bile duct ligation-induced periportal fibrosis.
(A) Scheme of the BDL experimental model. (B) Liver biochemistry of the Jag1+/+→Rag1−/− and Jag1Ndr/NdrRag1−/− mice after BDL (n = 3 each). Gray area indicates physiological ranges. (C, D) Representative images of Sirius red (SR) staining in Jag1+/+→Rag1−/− (left) and Jag1Ndr/Ndr→Rag1−/− (right) liver after BDL (C), and corresponding quantification (D), (n = 3 each). (E) Representative pericentral SR staining in Jag1+/+→Rag1−/− and Jag1Ndr/Ndr→Rag1−/− mice after BDL. (F) Quantification of SR staining in periportal areas of Jag1+/+→Rag1−/− and Jag1Ndr/Ndr→Rag1−/− livers after BDL, (n = 3 each). (G, H) CK19, aSMA, and Collagen1 staining of Jag1+/+Rag1−/− and Jag1Ndr/NdrRag1−/− livers after BDL (G), and quantification in periportal areas (H), (n = 3 each). (I, J) Representative immunofluorescent images of liver from Jag1+/+Rag1−/− (left) and Jag1Ndr/NdrRag1−/− (right) mice after BDL, stained for LCK, FOXP3, ECAD and nuclei (Hoechst). Yellow arrows mark LCK+/FOXP3+ Tregs (I), with LCK+/FOXP3+ Treg quantification in ECAD- periportal area (J), (n = 3 each). Graphs represent means ± SD, unpaired, two-tailed Student’s t-test); # - tissue-folding artifact; * in (I) denotes staining artifact of the LCK antibody. Scalebar lengths are specified for each panel and are identical within panels. BD bile duct, BDL bile duct ligation, CV central vein, HA hepatic artery, PV portal vein.
Figure EV1
Figure EV1. Single-cell profiling of the developing and postnatal liver reveals a cell population shift from embryonic erythropoiesis to postnatal immune surveillance in Jag1+/+, Jag1Ndr/+, and Jag1Ndr/Ndr mice.
(A) Violin plots of read counts (nCount_RNA), unique gene counts (nFeature_RNA), and percentage of mitochondrial mRNA (percent-mt) across the cell types identified in the Jag1+/+, Jag1Ndr/+, and Jag1Ndr/Ndr livers at E16.5 and P3 (n = 2 each). (B) Genotype, stage, or organ contribution to the composition of the scRNAseq dataset of E16.5 and P3 Jag1+/+, Jag1Ndr/+, and Jag1Ndr/Ndr mice. (C) Dot plot of the SCT-normalized mRNA marker expression of 78 DEGs characteristic for the individual cell types identified in (B). (D) Bar graph representing the relative proportion of parenchymal and Kupffer cells (clusters 1–6) versus non-parenchymal cells (clusters 7–20) in dissociated Jag1+/+, Jag1Ndr/+, and Jag1Ndr/Ndr livers at E16.5 and P3 (n = 2 each). Graph represents mean ± SD. (E) Graph depicting relative cell type contribution in dissociated Jag1+/+, Jag1Ndr/+, and Jag1Ndr/Ndr livers at E16.5 and P3 normalized to the total sample cell count.
Figure EV2
Figure EV2. Altered gene expression profile of hepatocytes and whole livers in Jag1Ndr/Ndr animals.
(A) Box and whiskers plot of the percentage mitochondrial mRNA (percent.mt), unique gene counts (nFeature_RNA), and read counts (nCount_RNA) across the hepatocyte-like cell types identified in the Jag1+/+, Jag1Ndr/+, and Jag1Ndr/Ndr livers by scRNA seq at E16.5 and P3 (n = 2 each). Center line indicates Median (50th percentile). The lower and upper bound of box indicate Q1, and Q3 (25th and 75th percentiles), respectively. Lower and upper whisker indicate min and max values within 1.5 * IQR below Q1 and above Q3, respectively. (B) Heatmap of the top 8 mRNA markers for each cluster. (C) PCA distribution of the bulk RNAseq samples from Andersson et al, , re-analyzed in Fig. 2 and Fig. EV2. (D) Volcano plot of the DEGs of Jag1Ndr/Ndr vs. Jag1+/+ liver at P10. Pro-inflammatory markers of activated hepatocytes are highlighted. Significance was confirmed via Benjamini–Hochberg P value correction. (E) Top29 GO pathways enriched in the Jag1Ndr/Ndr livers, NES (normalized enrichment score) indicates overlap of genes across the pathways. Significance was confirmed via false-discovery rate (FDR) statistic with 25% cutoff.
Figure EV3
Figure EV3. The proportions of early embryonic hematopoietic progenitor populations are not altered in Jag1Ndr/Ndr embryo proper (EP) and yolk sac (YS).
(A) Schematic of the experiment. E9.5 embryos were harvested and yolk sac (YS) and embryo proper (EP) were processed separately for flow cytometry analysis. (B) Gating strategy for identification of the Erythrocyte progenitors (Eryp), Macrophage progenitors (MFp), Megakaryocyte progenitors (MKp), and Erythro-myeloid progenitors (EMP) after dead cell exclusion. (C, D) Relative proportion of live Eryp, EMP, MFp, and MKp cells from Jag1Ndr/Ndr (n = 7), Jag1Ndr/+ (n = 9), and Jag1+/+ (n = 8) yolk sac (C) and whole E9.5 embryos (D). Graph represents mean ± SD. (E, F) Dot plot of the re-analyzed median scaled ln-normalized mRNA expression of Notch signaling components in human (E) and mouse (F’) thymic cell populations from Park et al, . One-way ANOVA, multiple comparison with Bonferroni method; n.s., no significant difference.
Figure EV4
Figure EV4. Jag1Ndr/Ndr T cells are not autoimmune as shown by the transfer to Rag1−/− hosts.
(A) Schematic of the experiment. (B) Survival curve of the Rag1−/− animals over the course of 8 weeks following transfer with Jag1+/+ (n = 6) or Jag1Ndr/Ndr (n = 8) T cells. (C) Relative quantification of Jag1+/+Rag1−/− and Jag1Ndr/NdrRag1−/− mouse weight normalized to its original value on day 0 after T cell transfer over 8 weeks (1 = 100% of original weight, mean ± SD, n = 6–10 mice). (D) Representative H&E staining of intestinal sections (duodenum—top, ileum—bottom) performed 8 weeks after T cell transfer. (E) Comparison of the intestinal inflammatory score calculated using the H&E-stained slides of intestinal sections from the Jag1+/+Rag1−/− (n = 4) and Jag1Ndr/NdrRag1−/− (n = 5) mice. (FH) Representative immunofluorescent images of sections from Jag1+/+Rag1−/− (left) and Jag1Ndr/NdrRag1−/− (right) mice intestine after DSS, stained for LCK and FOXP3, counterstained with Hoechst (F). Quantification of average LCK+ T cell count/Hoechst area (G), and LCK+/FOXP3+ Treg/LCK+ ratio (H) Means ± SD, Statistical analysis was performed by unpaired, two-tailed Student’s t-test.
Figure EV5
Figure EV5. T cells, present in the periportal area after bile duct ligation of Jag1Ndr/Ndr transplanted mice, are enriched in patients with ALGS and anti-correlate with fibrosis.
(A) Representative Sirius red staining in Zone 3 of Jag1+/+→Rag1−/− and Jag1Ndr/Ndr→Rag1−/− mice after BDL. (B, C) Western blot of total LCK, inactive Tyr505 LCK and β-ACTIN levels in LLL lysates from Jag1+/+→Rag1−/− and Jag1Ndr/NdrRag1−/− mice (n = 3 each) after BDL (B) and respective quantification (C). Graph represents mean ± SD. (D, E) Representative immunofluorescent images of cryosections from the left lateral lobe of Jag1+/+Rag1−/− (left) and Jag1Ndr/NdrRag1−/− (right) mice after BDL treatment, stained with antibodies against Lck and SMA (D), and respective quantification of Lck+ in the periportal area (E), (n = 3 each). Graph represents mean ± SD, Statistical analysis was performed by unpaired, two-tailed Student’s t-test. (F) List of patient samples from Andersson et al, , re-analyzed in this study. Asterisk indicates severity not significance. (G) Heatmap of gene sets over- and under-represented in ALGS and control patients. Significance was confirmed via false-discovery rate (FDR) statistic with 25% cutoff. (H) Pearson correlation of liver damage marker LGALS3BP, markers of lymphocytes CD19, CD4, CD8A, FOXP3 and markers of fibrosis COL1A1, LOX mRNA expression in patients with ALGS and control patients (p values *≤0.06; **≤0.005, are indicated below the heatmap). CV central vein, PV portal vein, BD bile duct, HA hepatic artery, AIH autoimmune hepatitis, SCH sclerosing cholangitis, PFIC2 Progressive familial intrahepatic cholestasis type 2, (N)ES (normalized) enrichment score. Fisher Exact test was used for the gene set enrichment analysis; LLL left lateral lobe, CV central vein, PV portal vein, BD bile duct, HA hepatic artery.

References

    1. Alagille D, Odièvre M, Gautier M, Dommergues JPP (1975) Hepatic ductular hypoplasia associated with characteristic facies, vertebral malformations, retarded physical, mental, and sexual development, and cardiac murmur. J Pediatr 86:63–71. 10.1016/S0022-3476(75)80706-2 - PubMed
    1. Allen K, Jaeschke H, Copple BL (2011) Bile acids induce inflammatory genes in hepatocytes. Am J Pathol 178:175–186. 10.1016/j.ajpath.2010.11.026 - PMC - PubMed
    1. Amezquita RA, Lun ATL, Becht E, Carey VJ, Carpp LN, Geistlinger L, Marini F, Rue-Albrecht K, Risso D, Soneson C, Waldron L, Pagès H, Smith ML, Huber W, Morgan M, Gottardo R, Hicks SC (2020) Orchestrating single-cell analysis with Bioconductor. Nat Methods 17:137–145. 10.1038/S41592-019-0654-X - PMC - PubMed
    1. Andersson ER, Chivukula IV, Hankeova S, Sjöqvist M, Tsoi YL, Ramsköld D, Masek J, Elmansuri A, Hoogendoorn A, Vazquez E, Storvall H, Netušilová J, Huch M, Fischler B, Ellis E, Contreras A, Nemeth A, Chien KC, Clevers H, Lendahl U (2018) Mouse model of alagille syndrome and mechanisms of Jagged1 missense mutations. Gastroenterology 154:1080–1095. 10.1053/j.gastro.2017.11.002 - PMC - PubMed
    1. Balounová J, Šplíchalová I, Dobešová M, Kolář M, Fišer K, Procházka J, Sedlacek R, Jurisicova A, Sung HK, Kořínek V, Alberich-Jorda M, Godin I, Filipp D(2019) Toll-like receptor 2 expression on c-kit+ cells tracks the emergence of embryonic definitive hematopoietic progenitors Nat Commun 10:1–14 - PMC - PubMed

LinkOut - more resources