. 2024 Nov;16(11):2882-2917.
doi: 10.1038/s44321-024-00148-5. Epub 2024 Oct 2.

Pre-clinical development of AP4B1 gene replacement therapy for hereditary spastic paraplegia type 47

Affiliations

Pre-clinical development of AP4B1 gene replacement therapy for hereditary spastic paraplegia type 47

Jessica P Wiseman et al. EMBO Mol Med. 2024 Nov.

Abstract

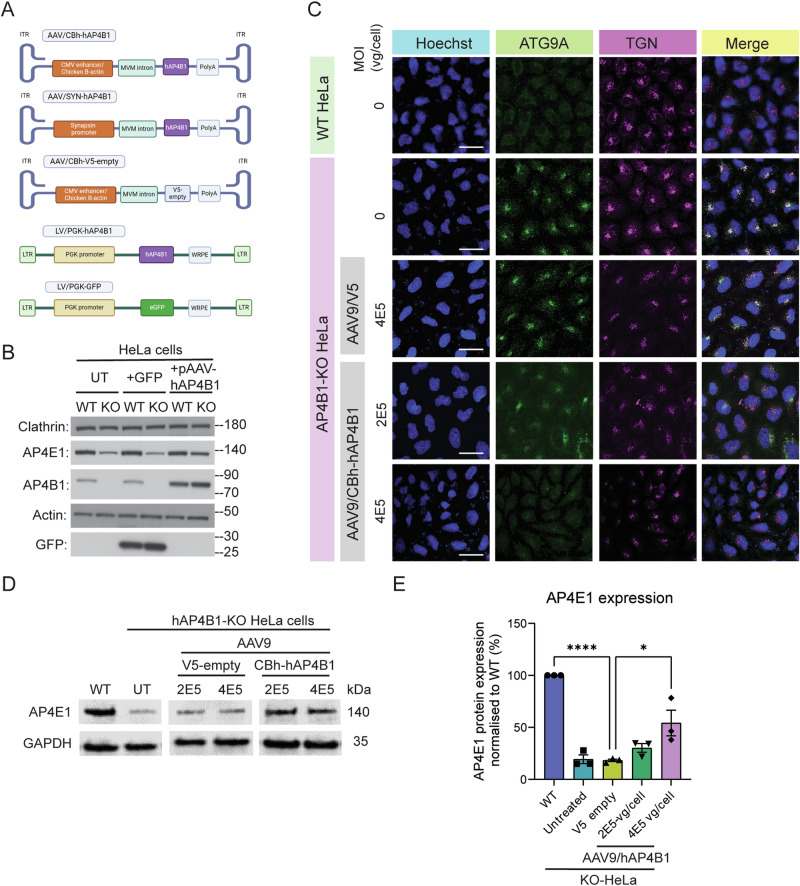
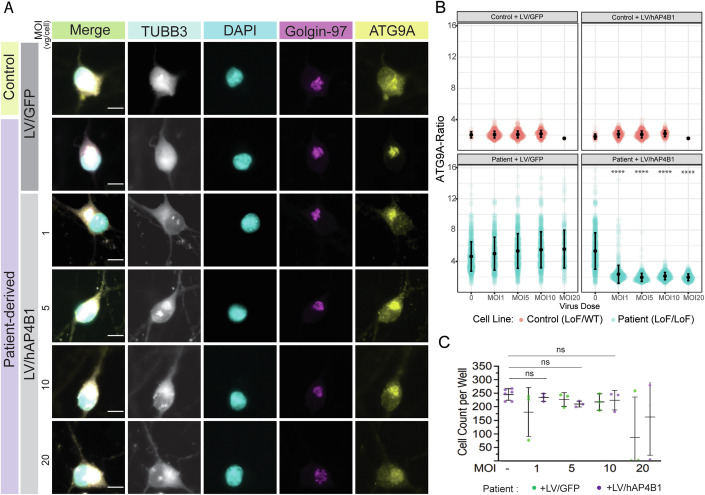
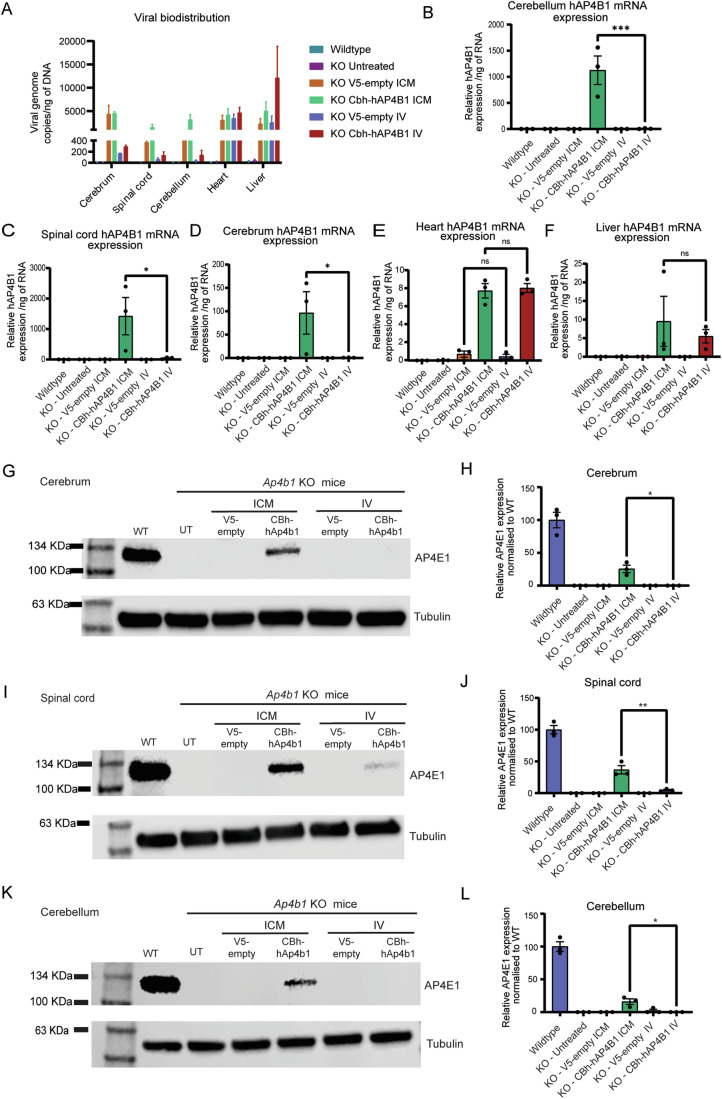
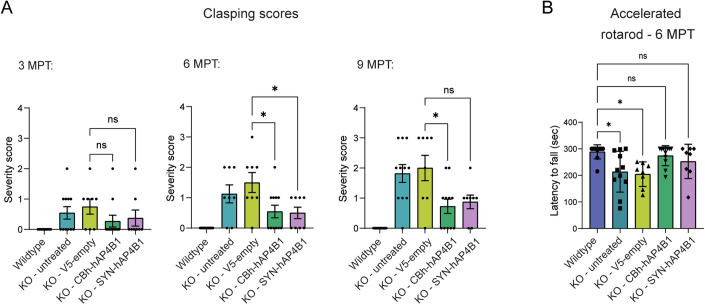
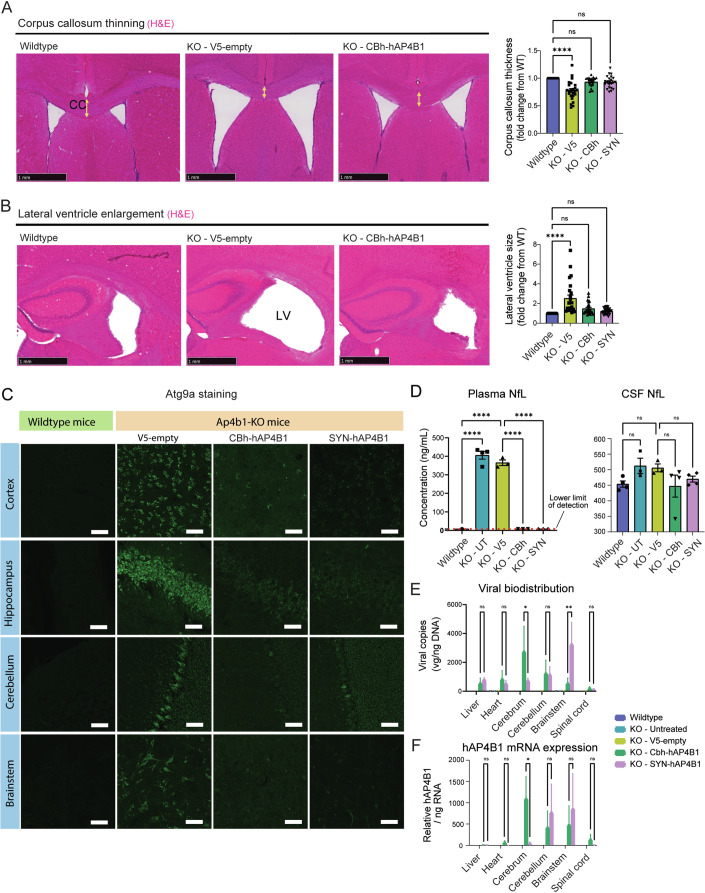
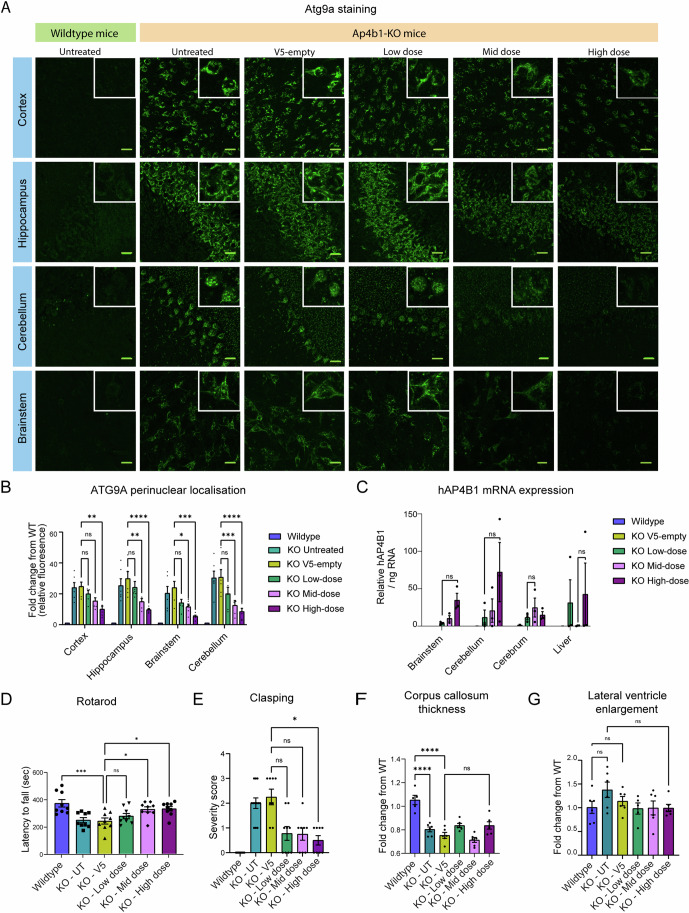
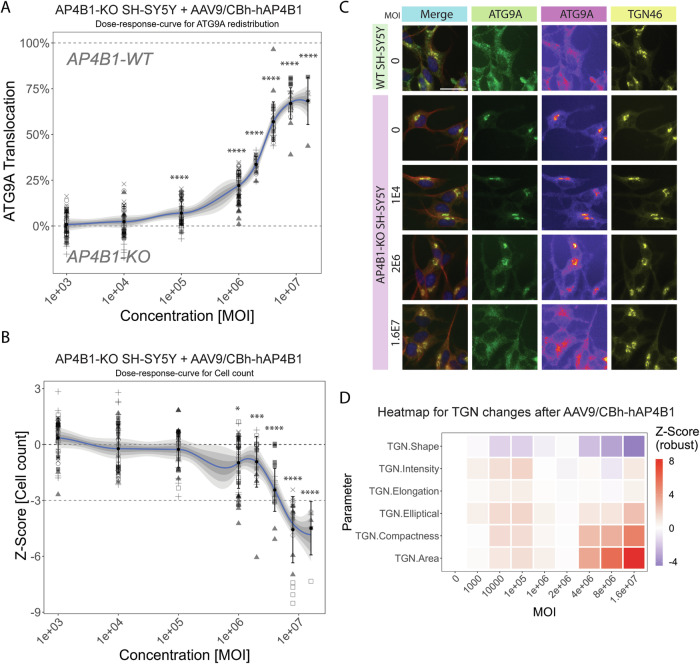
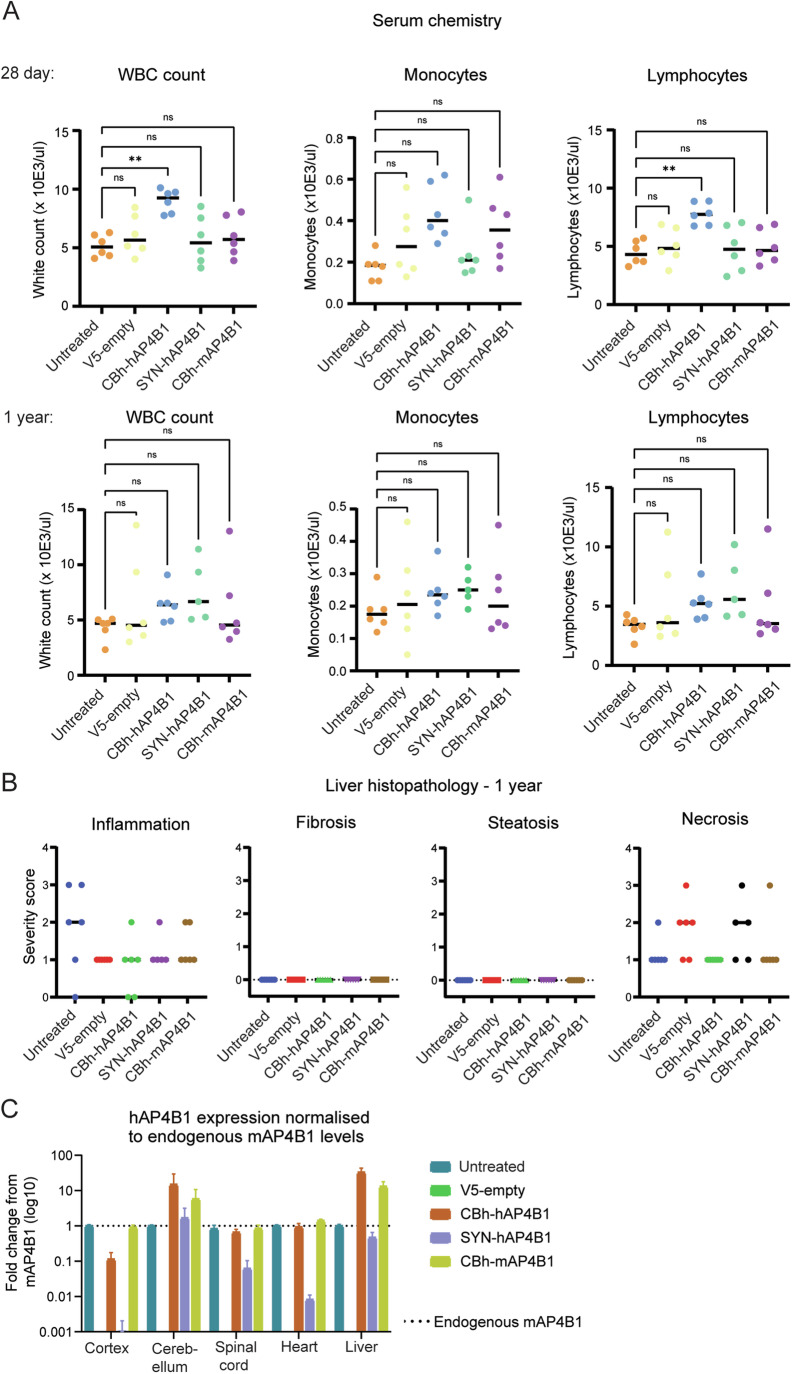
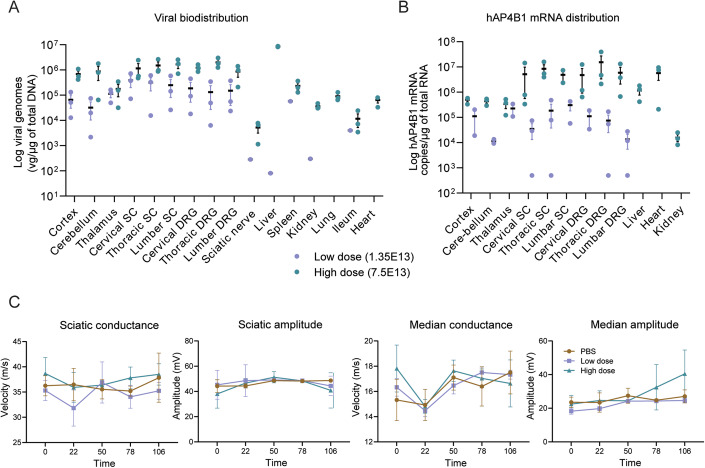
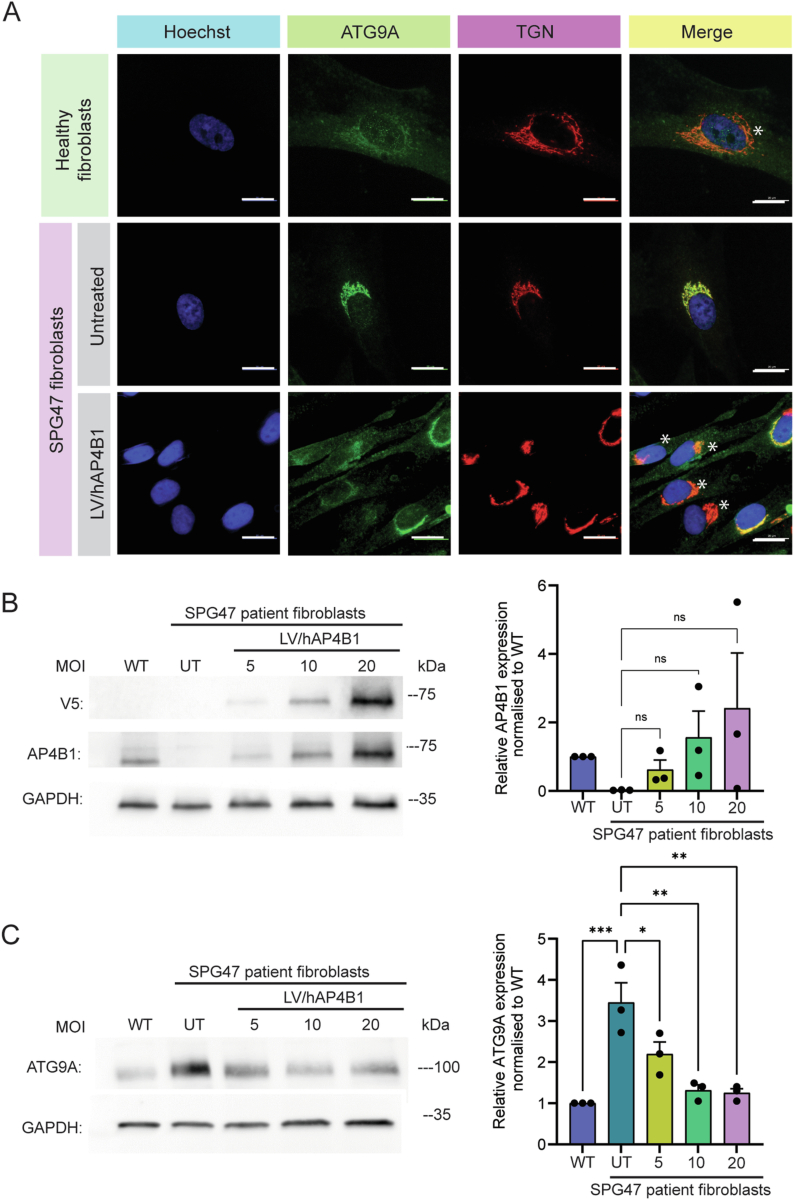
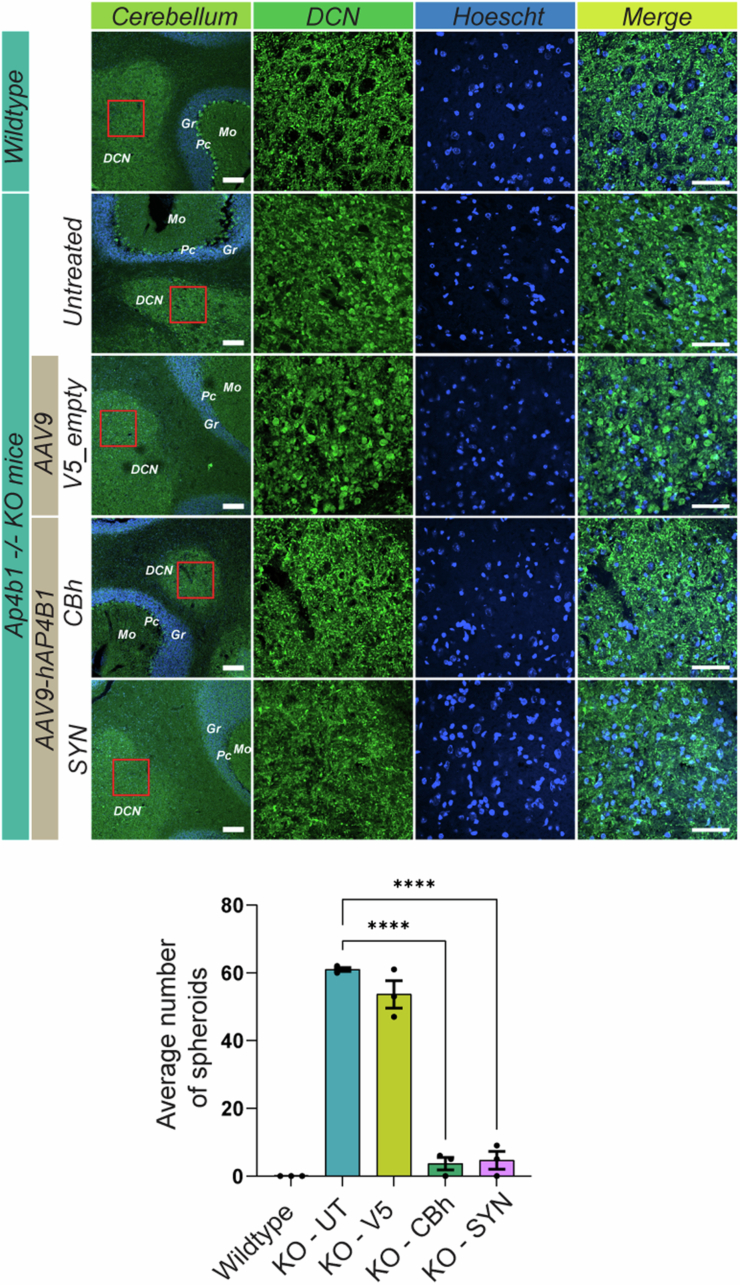
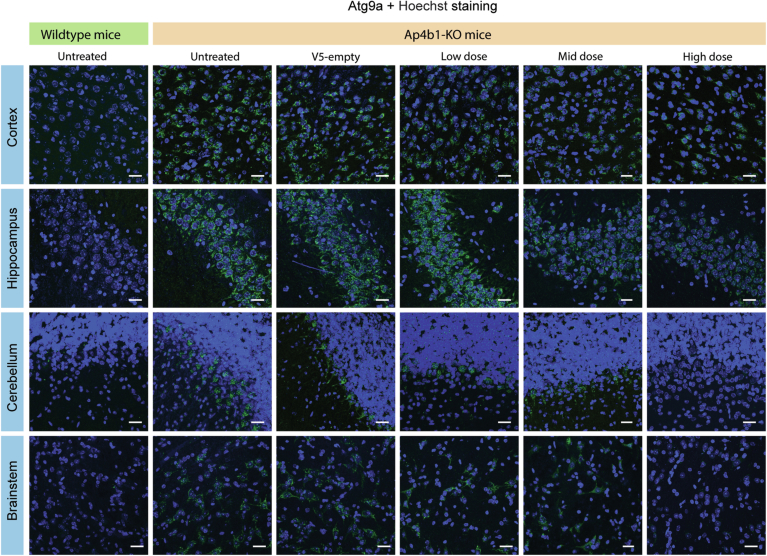
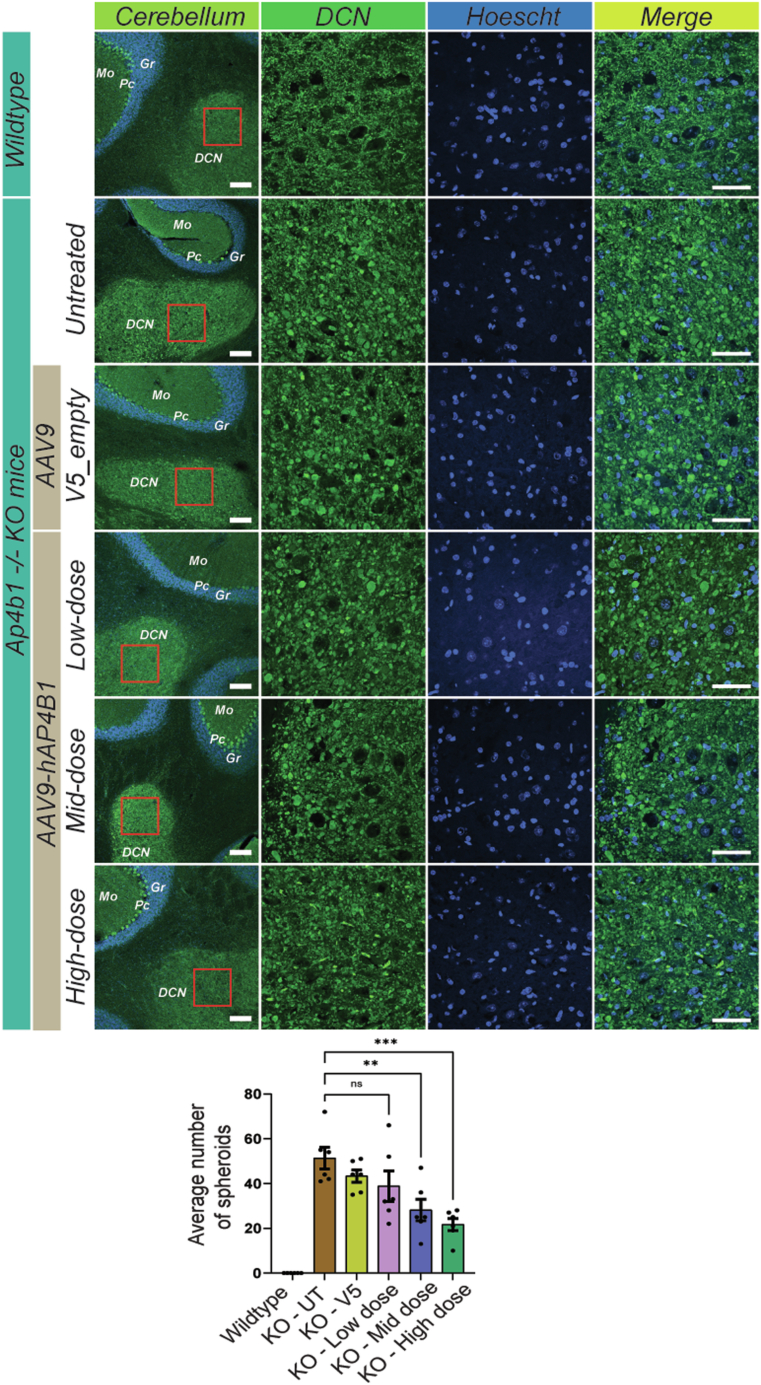
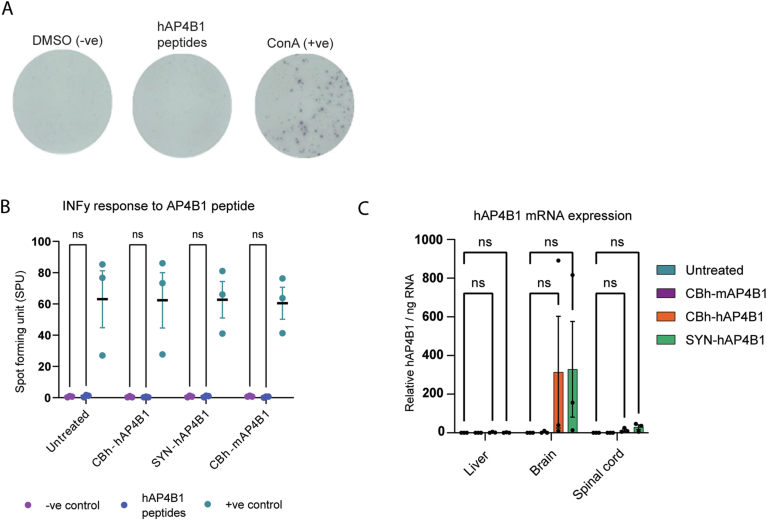
Spastic paraplegia 47 (SPG47) is a neurological disorder caused by mutations in the adaptor protein complex 4 β1 subunit (AP4B1) gene leading to AP-4 complex deficiency. SPG47 is characterised by progressive spastic paraplegia, global developmental delay, intellectual disability and epilepsy. Gene therapy aimed at restoring functional AP4B1 protein levels is a rational therapeutic strategy to ameliorate the disease phenotype. Here we report that a single delivery of adeno-associated virus serotype 9 expressing hAP4B1 (AAV9/hAP4B1) into the cisterna magna leads to widespread gene transfer and restoration of various hallmarks of disease, including AP-4 cargo (ATG9A) mislocalisation, calbindin-positive spheroids in the deep cerebellar nuclei, anatomical brain defects and motor dysfunction, in an SPG47 mouse model. Furthermore, AAV9/hAP4B1-based gene therapy demonstrated a restoration of plasma neurofilament light (NfL) levels of treated mice. Encouraged by these preclinical proof-of-concept data, we conducted IND-enabling studies, including immunogenicity and GLP non-human primate (NHP) toxicology studies. Importantly, NHP safety and biodistribution study revealed no significant adverse events associated with the therapeutic intervention. These findings provide evidence of both therapeutic efficacy and safety, establishing a robust basis for the pursuit of an IND application for clinical trials targeting SPG47 patients.

Keywords: AAV; AP4B1; Gene Therapy; HSP; SPG47.


Conflict of interest statement

Disclosure and competing interests statement MA is co-founder of BlackfinBio and Crucible Therapeutics. NH is a paid consultant to CureAP4. PJS is co-founder of Keapstone Therapeutics and Crucible Therapeutics.

Figures

Figure 1
Figure 1. In vitro development of hAP4B1 viral packaging and transduction of SPG47 cell culture models.
(A) Schematic of the various packaging plasmids used within AAV9 or LV. (B) Western blot indicating the levels of AP4E1/AP4B1 within WT and AP4B1−/− KO Hela untreated or transfected with pGFP or pAAV-hAP4B1. (C) Fluorescent micrographs indicate AP4B1−/− KO HeLa’s exhibit ATG9A accumulation in the TGN and this is reduced with AAV9/CBh-hAP4B1 treatment. Scale bar: 50 µm. (D) Western blot of detection of AP4E1 protein expression in Hela cells transduced with AAV9_CBh-hAP4B1 displayed significant increase of AP4E1 at 4E5 vg/cell multiplicity of infection (MOI) compared with control vector (AAV9/V5-empty). (E) Quantitation of AP4E1 expression level from Western blot (n = 3 biological repeats per group). Data are presented as mean ± SEM. Plot (E) was analysed by one-way ANOVA followed by Tukey’s post hoc multiple comparisons test. Stars indicate p < 0.0001 (****); p = 0.0133 (*). Source data are available online for this figure.
Figure 2
Figure 2. LV/hAP4B1 vector restored AP4B1 levels and ATG9A trafficking in SPG47 patient iPSC-derived neurons.
(A) Patient-derived neurons (LoF/LoF) stained with ATG9A (yellow) and Golgin-97 (purple) show mislocalisation and accumulation of ATG9A at the TGN compared with healthy control neurons (LoF/WT). LV/hAP4B1 caused dispersal of ATG9A and a reduction at the TGN (white asterisks indicate rescued cells). Scale bar: 10 µm. (B) Patient-derived neurons treated with LV/hAP4B1 demonstrated a significant reduction in ATG9A ratio at the TGN at all MOIs (1, 5, 10, and 20). Data are presented as mean ± SD, n = 2 biological repeats. Data analysed by Mann–Whitney U test followed by Benjamini-Hochberg for multiple comparisons. (C) Cell viability is reduced at MOI 20. Data are presented as mean ± SD. n = 3 biological repeats. Data analysed by one-way ANOVA followed by post hoc Dunnett’s multiple comparisons test with respect to control. ns = not significant. Source data are available online for this figure.
Figure 3
Figure 3. Intracisterna magna (ICM) delivery of AAV9/hAP4B1 shows greater transgene expression and the restoration of the AP-4 complex in the CNS compared with intravenous (IV) delivery in a Ap4b1-KO mouse model.
(A) qPCR of total genomic DNA extracted from both peripheral and CNS tissues showing viral distribution of treated mice through ICM or IV delivery; cerebrum, spinal cord, cerebellum, heart, and liver. (BF) RT-qPCR of total RNA extracted from CNS (cerebrum; cerebellum; spinal cord) and peripheral tissues (heart; liver) hAP4B1 mRNA expression in ICM delivery treated mice is elevated in the cerebrum, cerebellum, spinal cord compared to IV delivery. (G) Western blot detection of Ap4e1 showed a partial rescue of the Ap4e1 protein in the cerebrum ICM delivery, and no rescue with IV delivery. (H) Relative expression analysis displayed Ap4e1 was significantly increased in the cerebrum with ICM treatment. (I) Western blot detection of Ap4e1 showed a partial rescue of the Ap4e1 protein in the spinal cord ICM delivery, and no rescue with IV delivery. (J) Relative expression analysis displayed Ap4e1 was significantly increased in the spinal cord with ICM treatment. (K) Western blot detection of Ap4e1 showed a partial rescue of the Ap4e1 protein in the cerebellum ICM delivery, and no rescue with IV delivery. (L) Relative expression analysis revealed Ap4e1 was significantly increased in the cerebellum with ICM treatment. All data are presented as mean ± SEM, n = 3 mice. (BF) were analysed via a one-way ANOVA with Tukey’s multiple comparisons test. (H), (J) and (L) were analysed via unpaired t-test. Stars indicate p ≤ 0.05 (*); p ≤ 0.01 (**); p ≤ 0.001 (***); ns = not significant. (B), p = 0.0001; (C), p = 0.0206; (D), p = 0.0312; (H), p = 0.0111; (J), p = 0.0049; (L), p = 0.0207. Source data are available online for this figure.
Figure 4
Figure 4. Neonatal ICM treatment with AAV9/hAP4B1 in Ap4b1-KO mice showed significant motor function improvements over 9 months post treatment (MPT).
(A) Hind-limb clasping assessment showed an increase in severity from 6 months to 9 months of age. At 6 months treatment with both CBh-hAP4B1 and SYN-hAP4B1 show a significant reduction in clasping severity (CBh, p = 0.0272, SYN p = 0.335). While at 9 months clasping scores are reduced with both vectors only CBh-hAP4B1 vector reaches significance CBh (p = 0.0165, SYN p = 0.0711). (B) Accelerated rotarod performed at ~p180 showed that untreated and control treated KO animals had significantly reduced latency to fall performance compared to WT animals. KO-UT p = 0.0150; KO-V5 p = 0.0115. CBh-hAP4B1 and SYN-hAP4B1 treated animals had improved latency to fall scores with no significant difference from the WT animals. n ≥ 8 per group. All data groups are males. Data are presented as mean ± SEM and are analysed by the Kruskal–Wallis test with Dunn’s multiple comparison test. Stars indicate *p < 0.05; **p ≤ 0.01. MPT: month post treatment. Source data are available online for this figure.
Figure 5
Figure 5. Neonatal ICM treatment with AAV9/hAP4B1 in Ap4b1-KO mice showed significant improvement of anatomical and biomolecular phenotypes.
(A, B) representative haematoxylin and eosin (H&E) stained coronal brain sections revealing corpus callosum (CC) thinning (A) and lateral ventricle (LV) enlargement (B) in control treated Ap4b1-KO mice (AAV9/V5-empty) compared with wild-type mice. CBh-hAP4B1 and SYN-hAP4B1 vectors significantly increased corpus callosum thickness (p < 0.0001) and reduced lateral ventricle size (p = 0.0001) (2 MPT). (C) Representative Atg9a stained micrographs displayed Atg9a accumulation and upregulation at 9 MPT; both CBh and SYN vectors reduced Atg9a expression and perinuclear accumulation in the cerebellum, brainstem cortex and hippocampus. Scale bar 50 µm. (D) Plasma neurofilament light chain (pNfL) S-PLEX assay demonstrated an elevated level of pNfL in Ap4b1-KO mice at 9 months old compared to WT mice (p < 0.0001). CBh and SYN both reduced pNfL levels to WT levels (p < 0.0001). NfL S-PLEX assay to analyse levels in the CSF did not show any significant increase in diseased mice. (E) qPCR of total genomic DNA shows good viral biodistribution in areas of the brain with lower expression in peripheral tissues and the spinal cord. CBh-hAP4B1 showed an increased distribution in the cerebrum compared to SYN-hAP4B1 (p = 0.0360). Whereas SYN-hAP4B1 showed an increased distribution in the brainstem (p = 0.0016). (F) RT-qPCR of total RNA extracted demonstrated that hAP4B1 mRNA was expressed throughout the CNS, with low levels in peripheral tissues with both vectors. CBh vector gave more consistent expression throughout CNS. With significantly higher expression within the cerebrum (p = 0.0246). (A, B) n ≥ 3 per group, 8 measurements for CC (A) or 10 for LV (B) were plotted per mouse. (C), n = 4 per group. (D), n ≥ 3 per group. (E, F) n ≥ 4 per group. All data groups are males. Data are presented as mean ± SEM. and are analysed by a one-way ANOVA with Tukey’s multiple comparison test. Stars indicate *p < 0.05; **p ≤ 0.01, ****p ≤ 0.0001. Source data are available online for this figure.
Figure 6
Figure 6. Dose-dependent improvements 4 months following treatment with AAV9/hAP4B1 in adult (P60) Ap4b1-KO mice.
(A) Representative Atg9a stained micrographs showing a dose-dependent reduction of Atg9a perinuclear accumulation in the brain regions: cortex, hippocampus, cerebellum, brainstem (inset higher magnification shows Atg9a dispersal with increasing dose). See Fig. EV3 for Hoechst images. Scale bar 20 µm. (B) Shows a dose- and location-dependent reduction of ATG9A perinuclear localisation. Only high-dose vector significantly reduced Atg9a expression in all four brain regions (cortex (p = 0.0064), hippocampus (p < 0.0001), brainstem (p = 0.0002) and cerebellum (p < 0.0001)). While mid-dose significantly reduced atg9a expression in the hippocampus (p = 0.0055), brainstem (p = 0.0349) and cerebellum (p = 0.0006)). (n = 6 mice). (C) RT-qPCR of total RNA extracted at 2 MPT displayed a dose-dependent hAP4B1 mRNA expression in brain regions: brainstem, cerebellum and cortex (n = 3 mice). No significance between groups. (D) Rotarod assessment 4 months following mid- (p = 0.0500) and high-dose (p = 0.0350) treatment (~p180) displayed significant improvement of the latency fall compared to that of untreated/control treated Ap4b1-KO mice (p = 0.0006). (E) All treatment doses show reduction in hind-limb clasping severity score at 4 months following treatment however only high dose reaches significance (p = 0.0300). (F) Corpus callosum thinning data demonstrated a significant reduction in KO-UT (p < 0.0001) and KO-V5 (p < 0.0001) treated mice with no clear treatment effect. (G) Lateral ventricle enlargement data did not reach significance although there was a trend reduction in LV size with treatment. Data are presented as mean ± SEM, n = 6 per group (3 males, 3 females) for (B), (F) and (G); n = 3 per group for (C) (3 females); n = 9 per group for (6 males, 3 females) for (D) and (E). Data were analysed in by a one-way ANOVA with Tukey’s multiple comparison test except for (B) which is two-way ANOVA with Tukey’s multiple comparisons and (E) was analysed by the Kruskal–Wallis tests with Dunn’s multiple comparisons. Stars indicate p < 0.05 (*); p ≤ 0.01 (**), p ≤ 0.001 (***), p ≤ 0.0001 (****). Source data are available online for this figure.
Figure 7
Figure 7. AAV9/AP4B1 potency assay in AP4B1-KO SH-SY5Y confirms restoration of ATG9A trafficking.
(A) Potency assay of AAV9/AP4B1 in AP4B1-KO SH-SY5Y cells showing ATG9A translocation, calculated on the percent rescue of the ATG9A distribution in the experimental cells from AP4B1-KO SH-SY5Y (0% Translocation) back to AP4B1-WT SH-SY5Y ATG9A distribution (100% Translocation) depending on transduction with different multiplicity of infection (MOI). Cells were treated 24 h after plating for 72 h. Six individual replicates were analysed each with up to 8 wells. On average 101.800 individual cells were analysed per condition. Shaded areas represent ±1 SD, ±2 SD and ±3 SD. All data points represent per-well means. p < 0.0001 for MOI 1E5 – 16E6. (B) Cell counts, presented as Z-Score relative to untreated AP4B1-KO SH-SY5Y cells (dark-grey dotted line at 0), offer insights into the absence of cell toxicity. A Z-Score larger than −3 is defined as an indication of non-toxicity (light-grey dotted line). p = 0.0237 for MOI 1E6, p = 0.0002 for MOI 2E6, p < 0.0001 for MOI 4E6 – 16E6. (C) Representative images from (A) of SH-SY5Y cells treated with different multiplicity of infections (MOI) for 72 h. The merge images show β-3 tubulin (red), Hoechst (blue), the Trans-Golgi-Network (TGN, yellow) and ATG9A (green). Separate channels for TGN and ATG9A, along with fluorescence intensity representations using a colour lookup table for ATG9A, enhance the visualisation and ATG9A trafficking. The scale is set at 20 μm. (D) Multi-parametric profiling assesses TGN changes, considering TGN intensity and descriptors of TGN shape and network complexity. Heatmap visualisation summarises these measurements across different MOIs, normalised to untreated AP4B1-KO SH-SY5Y cells. N = 6, data presented as mean ± SD. Data were analysed via one-way ANOVA with Turkey’s multiple comparisons test. Statistics are compared to AP4B1 KO UT. Stars indicate p ≤ 0.001 (***), p ≤ 0.0001. Source data are available online for this figure.
Figure 8
Figure 8. Long term in vivo safety study in WT mice at 28 days or 365 days following treatment at P42 highlighted no adverse events or histopathology were present.
Various vector promoter sequences were tested including the our treatment vector (CBh-hAP4B1). (A) Serum chemistry, including: white blood cell, lymphocyte and monocyte counts were analysed at 28 days post treatment (DPT) and 1 year post treatment. (B) Histopathological assessments of WT mouse livers at 1 year following treatment with hAP4B1 vectors showed no adverse effects on inflammation, necrosis, steatosis or fibrosis compared to untreated the cohort. No adverse effects were observed in heart, brain and spinal cord (see Appendix Table S1 for data set). (C) RT-qPCR of total RNA extracted from mice at 28 DPT demonstrated that the CBh promoter gave consistently higher levels of hAP4B1 mRNA expression across the CNS compared to the SYN promoter. Data shows high hAP4B1 mRNA expression within the liver and heart, which indicates CSF leakage in this study. Data are presented as mean ± SEM, 28-day sacrifice n = 6 per group (3 males and 3 females); 1-year sacrifice n = 6 per group (3 males and 3 females) and were analysed via a one-way ANOVA with Tukey’s multiple comparisons test. Stars indicate p ≤ 0.01 (**), ns = not significant, WBC: p = 0.0014, Lymphocyte: p = 0.0028. Source data are available online for this figure.
Figure 9
Figure 9. In vivo safety study in WT NHPs showed good viral biodistribution and hAP4B1 expression across the CNS, minimal-mild macroscopic changes in DRG, spinal cord and sciatic nerve 1 and 4 months following ICM treatment of AAV9/hAP4B1, with no adverse effect on nerve conductance.
V5-empty, low (3.2 × 10¹² vg/kg), and high (1.7 × 10¹³ vg/kg) doses of AAV9/hAP4B1 vector were administered intra-cisternal to aged matched NHPs (n = 2 NHPs for V5-empty, n = 3 NHPs per treatment group (low or high dose). At 29 days and 113 days after injection, NHP organs were harvested. (A) Viral vector distribution assessment by qPCR of total DNA extracted from tissues at 16 weeks post vector administration. (B) hAP4B1 transgene expression in various tissues by RT-qPCR of total RNA extracted from NHPs at 16 weeks post vector administration. (C) Nerve conduction velocity (NCV) tests were performed at baseline and demonstrated no difference between test article and control (see Appendix Table S2 for data set). All data are presented at mean ± SEM. Source data are available online for this figure.
Figure EV1
Figure EV1. SPG47 patients’ fibroblasts show a rescue in ATG9A expression when treated with LV/hAP4B1.
(A) Patients’ fibroblast stained with ATG9A (green) and TGN46 (red) show mislocalisation of ATG9A compared with healthy fibroblasts. SPG47 patient cells marked with white asterisks show rescue of mislocalised ATG9A after treatment with LV/V5-hAP4B1. Scale bar 20 µm (B) Representative western blot confirms expression of the hAP4B1 within the fibroblasts with increasing viral MOI. (C) Representative western blot shows the increase in ATG9A expression in KO fibroblasts (p = 0.0005) compared to WT and demonstrates the reduction in ATG9A expression when treated with increasing MOI of LV/hAP4B1 (p = 0.0443 for MOI 5, p = 0.0014 MOI 10, p = 0.0011 MOI 20). Corresponding quantification shows MOI 10 and 20 both rescue the ATG9A phenotype to healthy fibroblasts (control) levels. Data is presented as mean +/− standard error of the mean (SEM), n = 3 biological repeats. Data analysed by one-way ANOVA followed by post hoc Dunnett’s multiple comparisons test with respect to Ctrl. Stars indicate p ≤ 0.05 (*); p ≤ 0.01 (**), p ≤ 0.001 (***); ns = not significant.
Figure EV2
Figure EV2. Neonatal ICM treatment with AAV9/hAP4B1 in Ap4b1-KO mice rescue Calbindin-positive spheroids in the DCN 9 months following treatment.
The image panel depicts representative micrographs of the DCN within the cerebellum, stained with Calbindin (green) and Hoechst (blue). The first column shows low magnification images of the DCN and surrounding areas, with labels for the Molecular layer (Mo), Purkinje cell layer (Pc), Granular layer (Gr), and deep cerebellar nuclei (DCN). Scale bar 100 µm. A red box indicates the area of higher magnification within the DCN shown in the second column. The micrographs in the second column demonstrate a clear reduction of calbindin-positive spheroids with both AAV9-CBh-hAP4B1 and AAV9-SYN-hAP4B1 vectors. The third column shows nuclear staining with Hoechst, and the fourth column presents a merge of Calbindin and Hoechst stains. Scale bar 50 µm. The bar graph reveals a larger number of spheroids in untreated and control-treated Ap4b1 KO mice compared to no spheroids in the WT mice. These spheroids are significantly reduced with both CBh (p < 0.0001) and SYN (p < 0.0001) treatment vectors 9 months following treatment. Data are presented as mean ± standard error of the mean (SEM), with n = 3. The data were analysed using one-way ANOVA followed by Dunnett’s multiple comparisons test. Stars indicate p ≤ 0.0001 (****).
Figure EV3
Figure EV3. Corresponding Hoechst staining to Fig. 6A to show the nuclear organisation within the separate brain regions.
Atg9a staining (green), Hoechst staining (blue). Representative micrographs showing a dose-dependent reduction of Atg9a perinuclear accumulation in the brain regions: cortex, hippocampus, cerebellum, brainstem. Scale bar 20 µm.
Figure EV4
Figure EV4. Adult ICM treatment with AAV9-CBh-hAP4B1 significantly reduces Calbindin-positive spheroids in the DCN of Ap4b1-KO mice 9 months following treatment.
The image panel depicts representative micrographs of the DCN within the cerebellum, stained with Calbindin (green) and Hoechst (blue). The first column shows low-magnification images of the DCN and surrounding areas, with labels for the Molecular layer (Mo), Purkinje cell layer (Pc), Granular layer (Gr), and deep cerebellar nuclei (DCN). Scale bar 100 µm. A red box indicates the area of higher magnification within the DCN shown in the second column. The micrographs in the second column demonstrate a clear dose-dependent reduction of calbindin-positive spheroids with increasing dose of the therapeutic vector (CBh-hAP4B1). The third column shows nuclear staining with Hoechst, and the fourth column presents a merge of Calbindin and Hoechst stains. Scale bar 50 µm. The bar graph reveals spheroids are reduced on a dose-dependent basis with mid- and high-dose significantly reducing the presence of spheroids (p = 0.0066 and p = 0.0004, respectively). Data are presented as mean ± standard error of the mean (SEM), with n = 6. The data were analysed using one-way ANOVA followed by Dunnett’s multiple comparisons test. Stars indicate p ≤ 0.001 (***), p ≤ 0.01 (**), ns = not significant.
Figure EV5
Figure EV5. In vivo safety study in WT mice through ELISpot assay, AAV9/hAP4B1 treatment generated no B cell response to the hAP4B1 peptides.
Vectors CBh-hAP4B1 and SYN-hAP4B1 were tested, alongside the vector containing the mouse Ap4b1 gene (mAP4B1). Splenocytes that were prepared from WT mice following were assessed through an ELISpot assay for IFN-γ responses to AP4B1 peptides. (A) Representative images of the spot forming detection revealed following the exposure to the negative control (DMSO), the hAP4B1 peptides and the positive control (Concanavalin A). (B) Treated mice did not show any inflammatory response to the peptides. (C) RT-qPCR of total RNA extracted demonstrated elevated hAP4B1 mRNA expression in the brain, liver and spinal cord of treated WT mice with lower expression within the liver. Data are presented as mean ± SEM, n = 3 per group. Data are analysed by a two-way ANOVA with Tukey’s post hoc multiple comparison test. ns = not significant.

References

    1. Abou Jamra R, Philippe O, Raas-Rothschild A, Eck SH, Graf E, Buchert R, Borck G, Ekici A, Brockschmidt FF, Nöthen MM, Munnich A, Strom TM, Reis A, Colleaux L (2011) Adaptor protein complex 4 deficiency causes severe autosomal-recessive intellectual disability, progressive spastic paraplegia, shy character, and short stature. Am J Hum Genet 88(6):788–795 - PMC - PubMed
    1. Adamson-Small L, Potter M, Falk DJ, Cleaver B, Byrne BJ, Clément N (2016) A scalable method for the production of high-titer and high-quality adeno-associated type 9 vectors using the HSV platform. Mol Ther Methods Clin Dev 3:16031 - PMC - PubMed
    1. Alecu JE, Saffari A, Ziegler M, Jordan C, Tam A, Kim S, Leung E, Szczaluba K, Mierzewska H, King SD, Santorelli FM, Yoon G, Trombetta B, Kivisäkk P, Zhang B, Sahin M, Ebrahimi-Fakhari D (2023) Plasma neurofilament light chain is elevated in adaptor protein complex 4-related hereditary spastic paraplegia. Mov Disord 38(9):1742–1750 - PMC - PubMed
    1. Bauer P, Leshinsky-Silver E, Blumkin L, Schlipf N, Schröder C, Schicks J, Lev D, Riess O, Lerman-Sagie T, Schöls L (2012) Mutation in the AP4B1 gene cause hereditary spastic paraplegia type 47 (SPG47). Neurogenetics 13(1):73–76 - PubMed
    1. Behne R, Teinert J, Wimmer M, D’Amore A, Davies AK, Scarrott JM, Eberhardt K, Brechmann B, Chen IP, Buttermore ED et al (2020) Adaptor protein complex 4 deficiency: a paradigm of childhood-onset hereditary spastic paraplegia caused by defective protein trafficking. Hum Mol Genet 29(2):320–334 - PMC - PubMed

MeSH terms

Substances