. 2024 Oct 2;25(1):252.
doi: 10.1186/s13059-024-03402-8.

A genome-wide association study reveals molecular mechanism underlying powdery mildew resistance in cucumber

Affiliations

A genome-wide association study reveals molecular mechanism underlying powdery mildew resistance in cucumber

Xuewen Xu et al. Genome Biol. .

Abstract

Background: Powdery mildew is a disease with one of the most substantial impacts on cucumber production globally. The most efficient approach for controlling powdery mildew is the development of genetic resistance; however, few genes associated with inherent variations in cucumber powdery mildew resistance have been identified as of yet.

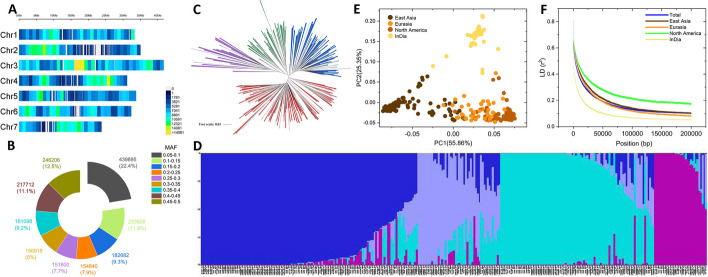
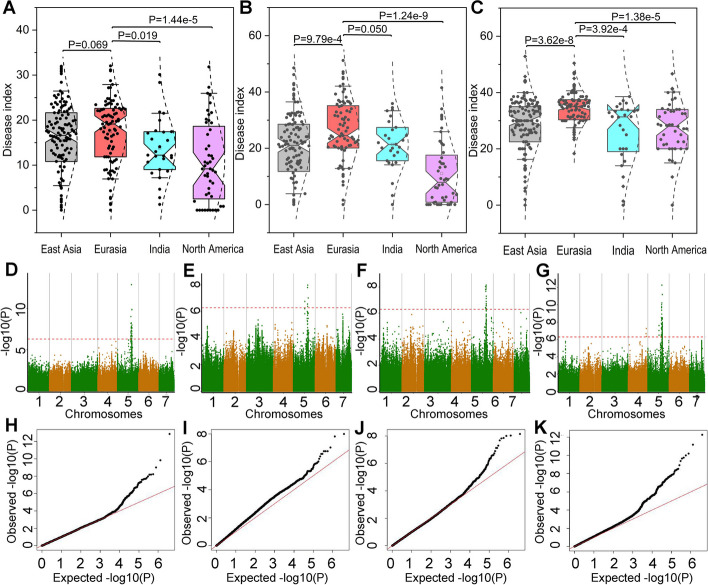
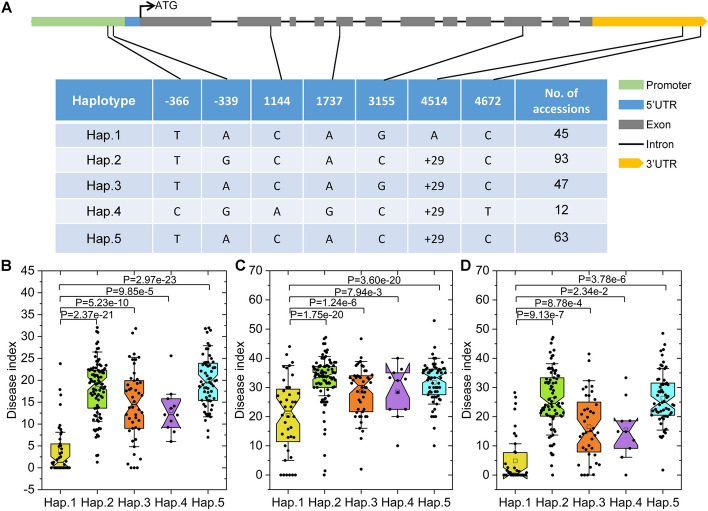
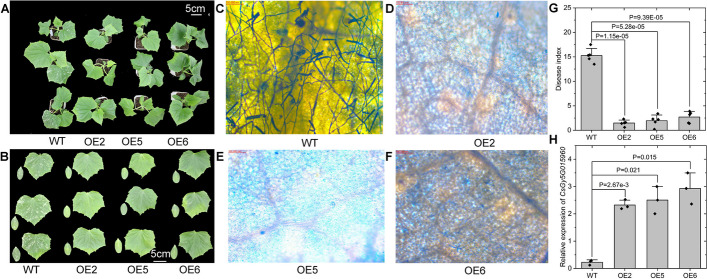
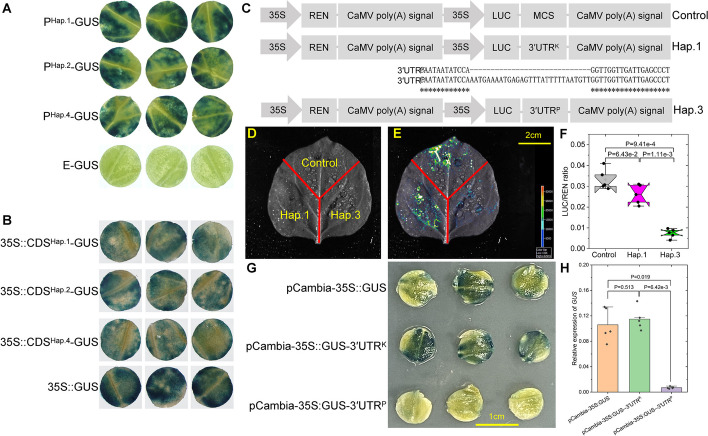
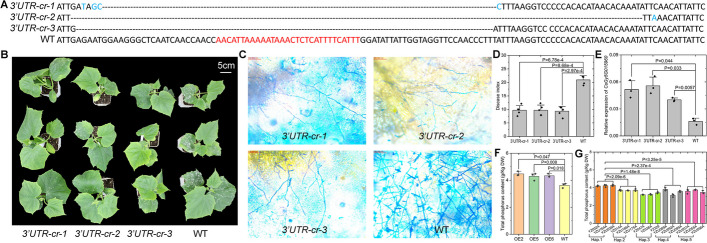
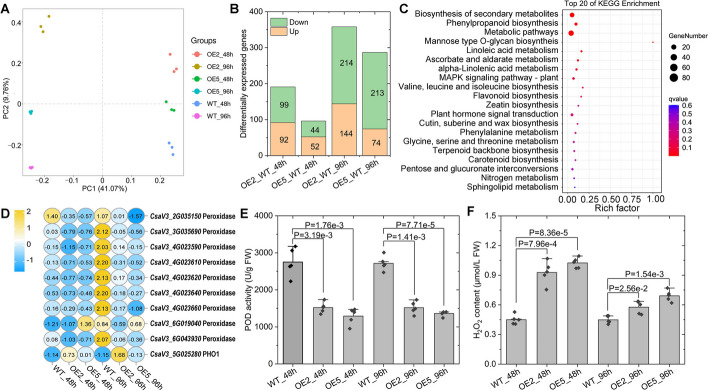
Results: In this study, we re-sequence 299 cucumber accessions, which are divided into four geographical groups. A genome-wide association study identifies 50 sites significantly associated with natural variations in powdery mildew resistance. Linkage disequilibrium analysis further divides these 50 sites into 32 linkage disequilibrium blocks containing 41 putative genes. Virus-induced gene silencing and gene expression analysis implicate CsGy5G015960, which encodes a phosphate transporter, as the candidate gene regulating powdery mildew resistance. On the basis of the resequencing data, we generate five CsGy5G015960 haplotypes, identifying Hap.1 as the haplotype most likely associated with powdery mildew resistance. In addition, we determine that a 29-bp InDel in the 3' untranslated region of CsGy5G015960 is responsible for mRNA stability. Overexpression of CsGy5G015960Hap.1 in the susceptible line enhances powdery mildew resistance and phosphorus accumulation. Further comparative RNA-seq analysis demonstrates that CsGy5G015960Hap.1 may regulate cucumber powdery mildew resistance by maintaining a higher H2O2 level through the depletion of multiple class III peroxidases.

Conclusions: Here we identify a candidate powdery mildew-resistant gene in cucumber using GWAS. The identified gene may be a promising target for molecular breeding and genetic engineering in cucumber to enhance powdery mildew resistance.

Keywords: Cucumber; GWAS; H2O2; Phosphate transporter; Powdery mildew.


Conflict of interest statement

The authors declare that they have no competing interests.

Figures

Fig. 1
Fig. 1
Population structure analysis of the cucumber accessions using high-quality SNPs and InDels. A SNP and InDel densities across the seven cucumber chromosomes. The number of SNPs and InDels in each 1-Mb non-overlapping window is provided. B Distribution of the minor allele frequency for the high-quality SNPs and InDels. C Phylogenetic tree for the resequenced accessions. The four groups, India (31 accessions), North America (49 accessions), Eurasia (91 accessions), and East Asia (128 accessions), are colored in violet, green, blue, and red, respectively. D Population structure plot for the 299 cucumber accessions with K = 4. Each color represents one subgroup, the Y axis quantifies subgroups membership, and the X axis shows the different cucumber accessions. E Principal component analysis of the resequenced accessions. Each plot indicated by a specific color represents an accession from the corresponding group. F Genome-wide average linkage disequilibrium (r2) decay for the accessions in the India, North America, Eurasia, and East Asia groups and for all accessions
Fig. 2
Fig. 2
GWAS for cucumber powdery mildew resistance. Phenotypic variations in powdery mildew resistance based on the disease index among the India, North America, Eurasia, and East Asia groups over the following three cropping seasons: fall 2022 (A), winter 2022 (B), and spring 2023 (C). Each black dot represents the average disease index of a cucumber accession. Student’s t-test was used to calculate the P value. D Manhattan plot for the GWAS results using fall 2022 data. E Manhattan plot for the GWAS results using winter 2022 data. F Manhattan plot for the GWAS results using spring 2023 data. G Manhattan plot for the GWAS results using the BLUP (best linear unbiased prediction) values; H quantile–quantile (Q-Q) plot for the GWAS results using fall 2022 data. I Q-Q plot for the GWAS results using winter 2022 data. J Q-Q plot for the GWAS results using spring 2023 data. K Q-Q plot for the GWAS results using the BLUP (best linear unbiased prediction) values. Red dashed lines in the Manhattan plots indicate the significance threshold (− log10 P = 6.29). Black dots in the Q-Q plots represent the distribution of P values
Fig. 3
Fig. 3
Haplotypes of CsGy5G015960. A Graphical representation of the gene structure and details regarding the 5 haplotypes detected in 260 cucumber accessions. The SNP and InDel positions are provided in the first row. + 29, insertion of AATGAAAATGAGAGTTTATTTTTAATGTT. B Phenotypic effect of each haplotype for the fall 2022 data. C Phenotypic effect of each haplotype for the winter 2022 data. D Phenotypic effect of each haplotype for the spring 2023 data. Each black dot represents the average disease index of a cucumber accession. Student’s t-test was used to calculate the P value
Fig. 4
Fig. 4
Functional characterization of CsGy5G015960. A Representative whole-plant phenotypes of the CsGy5G015960 overexpressing lines (OE2, OE5, and OE6) and the wild-type (WT) control at 8 days post inoculation (dpi) with the powdery mildew pathogen. B Phenotype of the first true leaves and cotyledons of the CsGy5G015960 overexpressing lines and the WT control at 8 dpi of powdery mildew pathogen. Coomassie blue staining of WT (C), OE2 (D), OE5 (E), and OE6 (F) at 8 dpi of powdery mildew pathogens. G Disease indices of OE2, OE5, OE6, and the WT control at 8 dpi of powdery mildew pathogen. Each black dot represents one biological replicate that is an average of 15 plants. Bar = 100 nm. H Confirmation of CsGy5G015960 expression in the transgenic CsGy5G015960 overexpressing cucumber lines (OE2, OE5, and OE6) and the WT control by qRT-PCR. Each black dot represents one biological replicate. Student’s t-test was used to calculate the P value
Fig. 5
Fig. 5
Transient expression assays show that the 29-bp InDel in the 3′UTR region of CsGy5G015960 affects the mRNA stability. A Qualitative analyses of the activities of the CsGy5G015960 promoters cloned from YZ002A (PHap.1-GUS), YZ014A (PHap.2-GUS), and YZU089A (PHap.4-GUS) in cucumber cotyledons based on GUS histochemical staining. The empty vector (E-GUS) was used as a control. The diameter of each cucumber cotyledon sample is 1 cm. B Histochemical GUS staining of cucumber cotyledons inoculated with the coding sequence of CsGy5G015960 cloned from YZ002A (CDSHap.1-GUS), YZ014A (CDSHap.2-GUS), and YZU089A (CDSHap.4-GUS). The empty vector (35S::GUS) was used as a control. The diameter of each cucumber cotyledon sample is 0.6 cm. C Schematic diagram of the constructs used in the transient expression assay. The sequences alignment highlights the location of the mutation. MCS multiple cloning site, 35S CaMV 35S promoter, REN Renilla luciferase, LUC firefly luciferase, 3′UTRK 3′ UTR sequences cloned from powdery mildew-resistant YZ020A (KP2, Hap.1), 3′UTRP 3′ UTR sequences cloned from powdery mildew-susceptible YZ038A (PW, Hap.3). D A schematic representation of the different N. benthamiana leaf regions infiltrated with different constructs. E The representative luminescence image of one N. benthamiana leaf transiently expressing the three constructs. The signal intensity is indicated with different colors from low (blue) to high (red) as shown in the light spectrum bar. F Measurement of the LUC/REN ratio after transiently expression of the constructs in tobacco leaves. The black dots are given as the LUC/REN ratio of each replicate. G Histochemical staining of GUS in cucumber cotyledons transiently expressing the three constructs. H Quantitative analysis of the effects of the 29-bp InDel in the 3′ UTR region of CsGy5G015960 in cucumber leaves based on GUS gene expression. Each black dot represents one biological replicate. Student’s t-test was used to calculate the P value
Fig. 6
Fig. 6
CRISPR/Cas9 induced mutations for the 29-bp insertion in the 3′ UTR of CsGy5G015960. A Comparison of 3′ UTR sequences among the three CRISPR/Cas9 induced mutants (3’UTR-cr-1, 3’UTR-cr-2, and 3’UTR-cr-3) and wild type (WT). Nucleotide deletions are indicated by dashes and nucleotide substitutions by blue color. The 29-bp insertion is indicated by red color. B Representative whole-plant phenotypes of the three CRISPR/Cas9 induced mutants and the WT control at 8 days post inoculation (dpi) of the powdery mildew pathogens. C Coomassie blue staining of powdery mildew fungal structures on leaves of the three CRISPR/Cas9-induced mutants (3’UTR-cr-1, 3’UTR-cr-2, and 3’UTR-cr-3) and WT at 8 dpi of powdery mildew pathogens. D Disease indices of 3’UTR-cr-1, 3’UTR-cr-2, 3’UTR-cr-3, and the WT control at 8 dpi of powdery mildew pathogen. Each black dot represents one biological replicate that is an average of 15 plants. E Confirmation of CsGy5G015960 expression in the three CRISPR/Cas9 induced mutants and the WT control by qRT-PCR. Each black dot represents one biological replicate. F Total phosphorus content in cucumber leaves of the transgenic CsGy5G015960 overexpressing cucumber lines (OE2, OE5, and OE6) and the WT control. G Total phosphorus content in cucumber leaves of the 15 selected cucumber inbred lines. Student’s t-test was used to calculate the P value
Fig. 7
Fig. 7
Transcriptomic analysis of CsGy5G015960 overexpressed line (OE2 and OE5) and wild-type (WT). A Principal components (PC) analysis of the RNA-seq data. Each point represents the whole-gene profile of one biological replicate. Numbers in parentheses on the axes represent the percentage of total variance explained by each PC. B Number of differentially expressed genes (DEGs) in leaves of OE2 and OE5 compared to WT. C KEEG enrichment analysis of the 647 non-overlapping DEGs. D Heatmap showing the expression changes of CsGy5G015960 (CsaV3_5G025280) and the nine DEGs encoding peroxidase in leaves of OE2 and OE5 compared to WT upon 48 and 96 h of powdery mildew pathogen inoculation. The average FPKM value for each gene across three libraries was resized to row Z-score scale with blue for low expression and yellow for the high expression levels. E Comparison of peroxidase activities of WT, OE2, and OE5 leaves at 48 and 96 h of powdery mildew inoculation. Each dot denotes the mean activity of three replicates. F Comparison of H2O2 contents of WT, OE2, and OE5 leaves at 48 and 96 h of powdery mildew inoculation. Each dot denotes the mean content of three replicates. Student’s t-test was used to calculate the P value

References

    1. Block C, Reitsma K. Powdery mildew resistance in the U.S. national plant germplasm system cucumber collection. Hortscience. 2005;40:414–20.
    1. Lebeda A, Mieslerová B. Taxonomy, distribution and biology of lettuce powdery mildew (Golovinomyces cichoracearum sensu stricto). Plant Pathol. 2011;60(3):400–15.
    1. Keinath AP, Dubose VB. Controlling powdery mildew on cucurbit rootstock seedlings in the greenhouse with fungicides and biofungicides. Crop Prot. 2012;42:338–44.
    1. Hafez YM, Attia KA, Kamel S, Alamery SF, Abdelaal K. Bacillus subtilis as a bio-agent combined with nano molecules can control powdery mildew disease through histochemical and physiobiochemical changes in cucumber plants. Physiol Mol Plant Pathol. 2020;11:101489.
    1. Wang Y, Bo K, Gu X, Pan J, Li Y, Chen J, Wen C, Ren Z, Ren H, Chen X, Grumet R, Weng Y. Molecularly tagged genes and quantitative trait loci in cucumber with recommendations for QTL nomenclature. Hortic Res. 2020;7:3. - PMC - PubMed

LinkOut - more resources