. 2025 Jan;30(1):25-40.
doi: 10.1111/resp.14833. Epub 2024 Oct 2.

Inflammation-induced loss of CFTR-expressing airway ionocytes in non-eosinophilic asthma

Affiliations

Inflammation-induced loss of CFTR-expressing airway ionocytes in non-eosinophilic asthma

Ling Chen et al. Respirology. 2025 Jan.

Abstract

Background and objective: Severe asthma is a heterogeneous disease with subtype classification according to dominant airway infiltrates, including eosinophilic (Type 2 high), or non-eosinophilic asthma. Non-eosinophilic asthma is further divided into paucigranulocytic or neutrophilic asthma characterized by elevated neutrophils, and mixed Type 1 and Type 17 cytokines in the airways. Severe non-eosinophilic asthma has few effective treatments and many patients do not qualify for biologic therapies. The cystic fibrosis transmembrane conductance regulator (CFTR) is dysregulated in multiple respiratory diseases including cystic fibrosis and chronic obstructive pulmonary disease and has proven a valuable therapeutic target. We hypothesized that the CFTR may also play a role in non-eosinophilic asthma.

Methods: Patient-derived human bronchial epithelial cells (hBECs) were isolated and differentiated at the air-liquid interface. Single cell RNA-sequencing (scRNAseq) was used to identify epithelial cell subtypes and transcriptional activity. Ion transport was investigated with Ussing chambers and immunofluorescent quantification of ionocyte abundance in human airway epithelial cells and murine models of asthma.

Results: We identified that hBECs from patients with non-eosinophilic asthma had reduced CFTR function, and did not differentiate into CFTR-expressing ionocytes compared to those from eosinophilic asthma or healthy donors. Similarly, ionocytes were also diminished in the airways of a murine model of neutrophilic-dominant but not eosinophilic asthma. Treatment of hBECs from healthy donors with a neutrophilic asthma-like inflammatory cytokine mixture led to a reduction in ionocytes.

Conclusion: Inflammation-induced loss of CFTR-expressing ionocytes in airway cells from non-eosinophilic asthma may represent a key feature of disease pathogenesis and a novel drug target.

Keywords: CFTR; airway epithelium; ionocytes; mucous; neutrophils; severe asthma; single cell RNA‐sequencing.


Conflict of interest statement

G. E. K. and L. C. have performed university contract research for Krystal Biotech on CFTR in cystic fibrosis but not related to this work, and not involved in the funding of this work. P. A. B. W. has received honoraria from GSK, Astra Zeneca, Sanofi, Novartis and Vertex but not for this work. P. A. B. W. is a committee member of the National Asthma Council of Australia. The other authors declare no conflicts of interest.

Figures
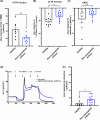
FIGURE 1
FIGURE 1
Ion transport measurements in healthy and non‐eosinophilic asthma human bronchial epithelial cells (hBECs) at air–liquid interface (ALI). The delta values of short circuit currents (∆Isc) for (A) CFTR‐Forskolin + 3‐isobutyl‐1‐methylxanthine (IBMX) stimulated, (B) CFTRinh‐172 inhibitor specifically blocking CFTR‐dependent activity, and (C) Amiloride‐sensitive ENaC currents for healthy (n = 8) and non‐eosinophilic asthma (n = 10) hBECs grown at ALI for 28 days. (D) Representative Isc responses of hBECs (circle line represents a healthy subject, and square line represents a non‐eosinophilic asthma subject) after sequentially stimulated with amiloride (100 μM), forskolin (10 μM) + IBMX (100 μM), carbachol (100 μM) and CFTRinh‐172 (25 μM). INN, indomethacin; A, amiloride; Fsk, forskolin; IBMX, 3‐isobutyl‐1‐methylxanthine; CCH, carbachol; CFTRinh, CFTRinh‐172 inhibitor. (E) ∆Isc for response to calcium activated carbachol channels for healthy (n = 8) and non‐eosinophilic asthma (n = 10) hBECs grown at ALI for 28 days. Each circle or square represents one individual subject. Error bars represent standard error of the mean (Mean ± SEM). Unpaired t test (A–C) or Mann–Whitney t test (E) was used to determine statistical significance, *p < 0.05, **p < 0.01.
FIGURE 2
FIGURE 2
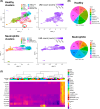
Single‐cell RNA‐seq analysis of hBECs. Single‐cell RNA‐seq was performed on bronchial epithelial cells at ALI generated from healthy subjects and neutrophilic asthma patients (n = 4 each). (A) Cells were clustered by using a graph‐based shared nearest neighbour method and plotted by UMAP together with heatmaps of gene UMI counts. Nine clusters of cells were identified in all samples and then known cell types were classified using classical gene markers enriched in the clusters through leadingEdge. Transitory progenitors or non‐classified cell types were identified by common transcriptional signatures SERPINB+ prog, LAMB3+ prog or Undefined. (B) The proportion of each cell subtype in healthy (8173 cells) and neutrophilic asthma (7077 cells) subjects are expressed (ionocytes cluster indicated in red circle has a proportion in healthy = 2%, ionocytes absent in neutrophilic asthma). (C) Unsupervised hierarchical clustering of all patient samples and cell subtypes (columns) by known ionocyte marker genes (rows), visualized using a heatmap plot.
FIGURE 3
FIGURE 3
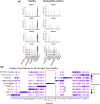
Identification of top ionocyte expressed genes in scRNAseq. (A) Violin plots of expression of ionocyte gene markers (PDE1C, FOXI1, ASLC3 and CFTR) in each of the 9 cell subtype clusters from healthy subjects versus neutrophilic asthma patients. (B) Weighted dot plot showing top 10 features of each cluster from the scRNAseq data derived from cells of healthy subjects. Each dot is sized to represent the percent of cells in each cluster expressing the corresponding top 10 gene, and colours represent the average expression of each maker gene across within that cluster.
FIGURE 4
FIGURE 4
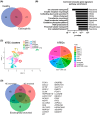
Pathway analysis of ionocyte gene signature and conservation throughout conducting airways. (A) Venn diagram of the 73 common ionocyte genes between hBECs from healthy subjects and eosinophilic asthma patients. (B) Pathway over‐representation analysis using ConsensusPathDB of the 73 common ionocyte gene signature. (C) Human tracheal epithelial cells (hTECs) cultured at ALI from healthy donors (n = 4), were clustered by using a graph‐based shared nearest neighbour method and plotted by UMAP. Eleven clusters of cells were identified and then known cell types were classified using classical gene markers enriched in the clusters through leadingEdge. Transitory progenitors or non‐classified cell types were identified by transcriptional signatures SERPINB+ prog, or as Undefined. The proportion of each cell type among hTECs was expressed in a pie chart (2464 cells). (D) Venn diagram of the conserved 30 common ionocyte gene signature among healthy hBECs, healthy hTECs and hBECs from eosinophilic asthma. HC, healthy control.
FIGURE 5
FIGURE 5
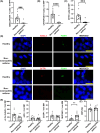
Quantification of ionocytes in hBECs by dual protein marker expression. Transwell membranes of ALI hBEC cultures from healthy or non‐eosinophilic asthma were used for dual marker immunofluorescent quantification of ionocytes and other airway epithelial subtypes. (A) Dual ASCL3 + FOXI1+ cells or (B) CFTR + FOXI1+ cells or (C) total CFTR+ cells were quantified by immunofluorescence in hBECs from healthy donors (n = 11) or non‐eosinophilic asthma (n = 10). Values expressed per 10 high‐powered fields (HPF), mean ± SEM. (D) Representative immunofluorescent images for (A) and (B), scale bars represent 20 μm. (E) Quantification of common airway epithelial cell subtypes; ciliated (Ac‐tubulin+), basal stem cells (p63+), club cells (CCSP+) and goblet (MUC5AC+) by immunofluorescence in hBECs from healthy donors (n = 8) or non‐eosinophilic asthma (n = 10–13). Values expressed per mm of basement membrane (BM), mean ± SEM. (F) Cilia beat frequency (CBF) measured in live images from hBECs of healthy (n = 11) versus non‐eosinophilic asthma (n = 10). Values expressed in Hz as mean ± SEM. Unpaired t test was used to determine statistical significance, **p < 0.01, ***p < 0.001 and ****p < 0.0001.
FIGURE 6
FIGURE 6
Inflammatory cytokine‐induced loss of ionocytes. Transwell membranes of ALI hBEC cultures from healthy donors were used for dual marker immunofluorescent quantification of ionocytes. (A and C) Dual ASCL3 + FOXI1+ cells or (B and D) CFTR + FOXI1+ cells were quantified by immunofluorescence in healthy hBECs treated with vehicle control, a cytokine mixture representative of non‐eosinophilic asthma airway secretions including IFN‐γ, IL‐17A, IL‐22 and TNF‐α (n = 11 each), or (C and D) with the individual cytokines indicated (n = 7 each). Values expressed per 10 high‐powered fields (HPF), mean ± SEM. Paired t test (A, B) and Kruskal–Wallis with Dunn's multiple comparison test (C, D) were used to determine statistical significance. *p < 0.05, ***p < 0.001 and ****p < 0.0001.

References

    1. Brusselle GG, Koppelman GH. Biologic therapies for severe asthma. N Engl J Med. 2022;386(2):157–171. - PubMed
    1. Peters MC, Kerr S, Dunican EM, Woodruff PG, Fajt ML, Levy BD, et al. Refractory airway type 2 inflammation in a large subgroup of asthmatic patients treated with inhaled corticosteroids. J Allergy Clin Immunol. 2019;143(1):104–113.e14. - PMC - PubMed
    1. Baines KJ, Simpson JL, Wood LG, Scott RJ, Fibbens NL, Powell H, et al. Sputum gene expression signature of 6 biomarkers discriminates asthma inflammatory phenotypes. J Allergy Clin Immunol. 2014;133(4):997–1007. - PubMed
    1. Svenningsen S, Nair P. Asthma endotypes and an overview of targeted therapy for asthma. Front Med. 2017;4:158. - PMC - PubMed
    1. Barnes PJ. Inflammatory mechanisms in patients with chronic obstructive pulmonary disease. J Allergy Clin Immunol. 2016;138(1):16–27. - PubMed

Substances