. 2024 Sep 25:2024:9944426.
doi: 10.1155/2024/9944426. eCollection 2024.

4,5-Diamino-2-Thiouracil-Powered Dual-Mode Biosensor for Sensitive, Nonenzymatic Determination of Saliva Uric Acid Levels

Affiliations

4,5-Diamino-2-Thiouracil-Powered Dual-Mode Biosensor for Sensitive, Nonenzymatic Determination of Saliva Uric Acid Levels

Zipeng Wu et al. Int J Anal Chem. .

Abstract

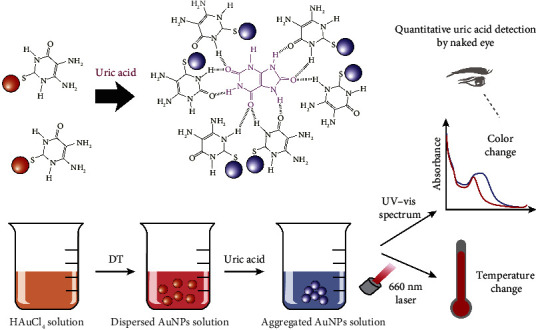
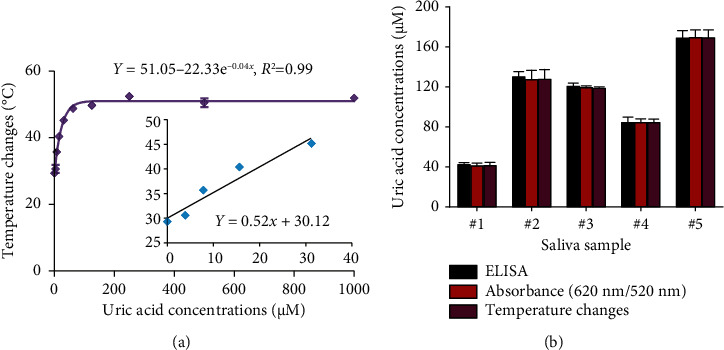
Nonenzymatic and rapid monitoring of uric acid levels is of great value for early diagnosis, prevention, and management of oxidative stress-associated diseases. However, fast, convenient, and low-cost uric acid detection remains challenging, especially in resource-limited settings. In this study, a novel and rapid biosensing approach was developed for the simultaneous visualization and quantification of uric acid levels by using the unique surface plasmon resonance and photothermal property of 4,5-diamino-2-thiouracil (DT)-capped gold nanoparticles (AuNPs). With the presence of uric acid, DT-capped AuNPs rapidly aggregated, and a visible color/photothermal change was used for uric acid quantification within 15 min. The limit of detection was determined to be 11.3 and 6.6 μM for the dual-mode biosensor, leveraging the unique structure of DT to optimize reaction kinetics. Moreover, the sensor exhibited excellent anti-interference capabilities and demonstrated potential for detecting a wide range of uric acid concentrations in complex samples, thereby reducing the need for extensive sample dilution and complex material synthesis procedures. Furthermore, validation against gold standard testing indicates that this biosensor could serve as a highly sensitive assay for quantifying uric acid levels in point-of-care applications, particularly in resource-limited settings.

Keywords: 4,5-diamino-2-thiouracil; colorimetric; nonenzymatic; photothermal; uric acid.


Conflict of interest statement

The authors declare that they have no known competing financial interests or personal relationships that could have appeared to influence the work reported in this paper.

Figures

Scheme 1
Scheme 1
Schematic illustration of the nonenzymatic, dual-mode colorimetric/photothermal biosensing approach for rapid determination of uric acid levels. Gold nanoparticles (AuNPs) capped with 4,5-diamino-2-thiouracil (DT) were first synthesized and applied for quick uric acid recognition via possible hydrogen-bonding interaction, inducing a decreased distance among AuNPs which could be characterized by a visible color change using a UV–visible spectroscopy and a temperature change induced by the photothermal effects of AuNPs due to aggregation-induced plasmon resonance change.
Figure 1
Figure 1
Characterization of the DT-functionalized AuNPs with the presence of uric acid. The transmission electron micrograph of (a) pure AuNPs, (b) pure AuNPs + PBS, (c) DT@AuNPs + PBS, and (d) DT@AuNPs + uric acid. (e) The dynamic light scattering (DLS) analysis for the AuNPs with the absence (red) and presence of 500 μM uric acid (purple) after incubation for 10 min. (f) The zeta potential of nanoparticles showed the negative value with the presence of uric acid (500 μM). The scale bar is 100 nm.
Figure 2
Figure 2
Performance of the DT-functionalized AuNPs for detecting uric acid. (a) UV–vis spectrums of DT-functionalized gold nanoparticles after incubation with different concentrations of uric acid in 1 × PBS buffer for 10 min, illustrating the concentration-dependent color change in AuNPs solution. (b) Relationship of uric acid concentrations with absorbance ratios (620 nm/520 nm) of AuNPs in 1 × PBS buffer. Each data point is calculated from at least three replicate measurements, and the error bars indicate the standard deviations.
Figure 3
Figure 3
Colorimetric method based on DT-functionalized AuNPs for detection of uric acid. (a) Absorbance ratios (620 nm/520 nm) of DT-functionalized AuNPs with the addition of various interferents (250 μM) including 4-acetamidophenol (AP), L-DOPA, ascorbic acid (AA), glutathione (GSH), L-cysteine (L-Cys), and metal ions Na+ and Ca2+ at different temperatures. Noted that no visual color changes were observed with or without the presence of various interferents. (b) Photos of DT-functionalized AuNPs with the addition of various interferents (250 μM) at different temperatures. (c) Absorbance ratios (620 nm/520 nm) of DT-functionalized AuNPs after reaction with different mixtures of interfering substances (250 μM) with uric acid (0.25 mM). Noted the distinct visible color (red) of AuNPs without the presence of uric acid. (d) Photos of DT-functionalized AuNPs after reaction with different mixtures of interfering substances (250 μM) with uric acid (250 μM) at different temperatures. ∗∗p < 0.01. Each data point is calculated from at least three replicate measurements, and the error bars indicate the standard deviations.
Figure 4
Figure 4
Stability of the DT-functionalized AuNPs for uric acid detection. (a) UV–vis spectral profiles of DT-functionalized AuNPs in the presence of uric acid (250 μM) under various storage times (0, 1, 2, 4, and 8 weeks). (b) UV–vis spectral profile of DT-functionalized AuNPs in the presence of uric acid (250 μM) at different pH values (5.5, 6.5, 7.5, 8.5, and 9.5). (c) Absorbance ratios (620 nm/520 nm) of DT-functionalized AuNPs under various storage times (0, 1, 2, 4, and 8 weeks). No significant difference in absorption intensity was observed with different storage times. (d) Absorbance ratios (620 nm/520 nm) of DT-functionalized AuNPs at different pH values. No significant difference in absorption intensity at 620 nm was observed among different pH values. Each data point is calculated from at least three replicate measurements, and the error bars indicate the standard deviations.
Figure 5
Figure 5
The impact of different laser (660 nm) irradiation power and duration on uric acid detection using DT-functionalized AuNPs. (a) Photothermal detection of uric acid levels under different irradiation laser (660 nm) power for 10 min. (b) Photothermal detection of uric acid levels under different irradiation times with a laser (660 nm) power of 1.5 W.
Figure 6
Figure 6
Photothermal detection of uric acid levels using DT-capped AuNPs in saliva solutions. (a) Calibration curves of temperature change and uric acid levels with a dilution factor of 7. (b) Photothermal and colorimetric detection of uric acid levels for real saliva samples. Note that a commercially available uricase-based enzymatic ELISA was used to quantify the uric acid levels in saliva samples for comparison. Each data point is calculated from at least three replicate measurements, and the error bars indicate the standard deviations.

Similar articles

References

    1. Vernerová A., Kujovská Krmová L., Melichar B., Vec F. Non-Invasive Determination of Uric Acid in Human Saliva in the Diagnosis of Serious Disorders. Clinical Chemistry and Laboratory Medicine . 2021;59:797–812. - PubMed
    1. Zhao J., Huang Y. Salivary Uric Acid as a Noninvasive Biomarker for Monitoring the Efficacy of Urate-Lowering Therapy in a Patient With Chronic Gouty Arthropathy. Clinica Chimica Acta . 2015;450:115–120. doi: 10.1016/j.cca.2015.08.005. - DOI - PubMed
    1. Albu A., Para I., Porojan M. Uric Acid and Arterial Stiffness. Therapeutics and Clinical Risk Management . 2020;16:39–54. doi: 10.2147/tcrm.s232033. - DOI - PMC - PubMed
    1. Benn C. L., Dua P., Gurrell R., et al. Physiology of Hyperuricemia and Urate-Lowering Treatments. Frontiers of Medicine . 2018;5:p. 160. doi: 10.3389/fmed.2018.00160. - DOI - PMC - PubMed
    1. Kutzing M. K., Firestein B. L. Altered Uric Acid Levels and Disease States. Journal of Pharmacology and Experimental Therapeutics . 2008;324:1–7. doi: 10.1124/jpet.107.129031. - DOI - PubMed

LinkOut - more resources