Review
. 2024 Oct 1;20(3):230127.
doi: 10.1183/20734735.0127-2023. eCollection 2024 Oct.

Lung imaging methods: indications, strengths and limitations

Affiliations
Review

Lung imaging methods: indications, strengths and limitations

Dávid László Tárnoki et al. Breathe (Sheff). .

Abstract

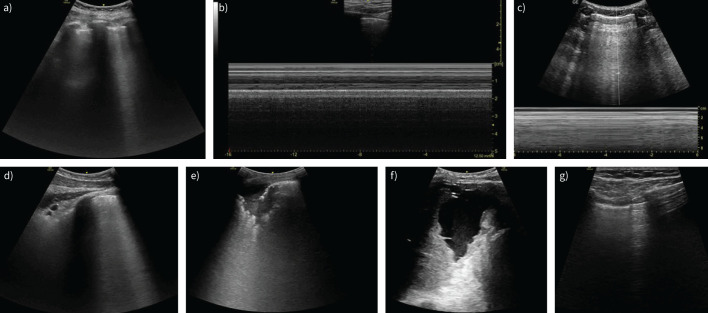
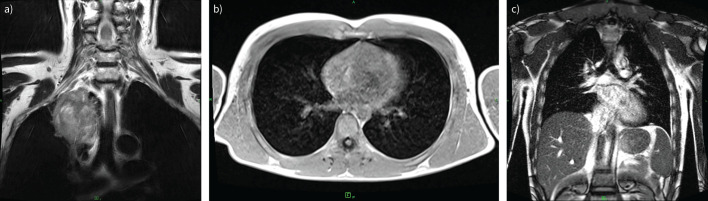
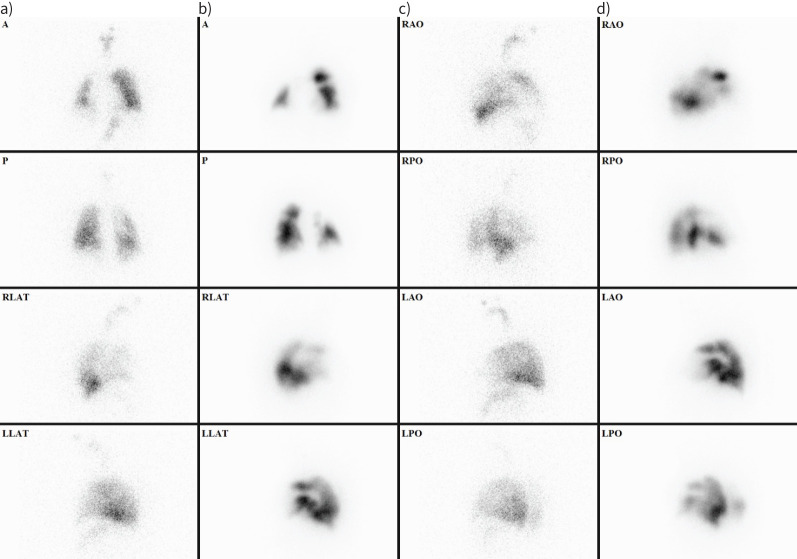
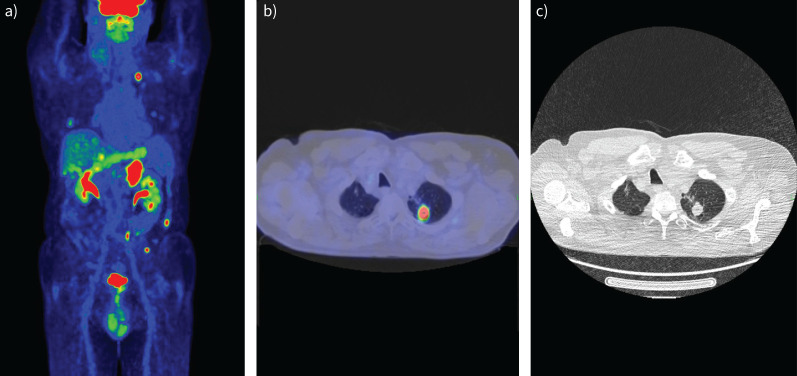
Imaging methods are fundamental tools to detect and diagnose lung diseases, monitor their treatment and detect possible complications. Each modality, starting from classical chest radiographs and computed tomography, as well as the ever more popular and easily available thoracic ultrasound, magnetic resonance imaging and nuclear medicine methods, and new techniques such as photon counting computed tomography, radiomics and application of artificial intelligence, has its strong and weak points, which we should be familiar with to properly choose between the methods and interpret their results. In this review, we present the indications, strengths and main limitations of methods for chest imaging.


Conflict of interest statement

Conflict of interest: E.M. Grabczak is a current member of the Breathe editorial board. C.A. Ridge discloses that Cobalt Charity has provided her institution with an education grant to fund a fellow, she is the RSNA Image Wisely co-chair, a ECR Thoracic educational committee member, a European Society of Thoracic Imaging educational committee member and Lung Cancer Journal radiology editor. She is the Director of AI Radiology limited (radiology reporting services). Á.D. Tárnoki is the current chair of the ERS Imaging group. The other authors declare that there is no conflict of interest.

Figures

FIGURE 1
FIGURE 1
Normal chest radiography in upright position. a) Posterior–anterior view. Visible structures and lung zones are presented. Breast tissue can increase attenuation of the X-ray beam in the lower lung zones. The heart, diaphragm and liver are in contact; no line separating them is visible. Assessment should include: chest wall bones (if fracture or lesions present); heart and vessels (cardiac silhouette should occupy less than half of the transverse diameter of the thoracic cavity, mediastinal width ≤8 cm, aortic knob well defined); diaphragm and upper abdomen (right hemidiaphragm is slightly higher than the left one, the costophrenic angles should not be blunted, no air beneath diaphragms); and lungs (lung fields clear (without opacities or other lesions), lung markings visible to the periphery (may be less prominent in apices), assessment for pneumothorax and presence of pleural fluid; while assessing the lungs, each lung region should be compared on both sides). The proper acquisition of the image incudes: exposure (intervertebral spaces in the thoracic part and vessels through heart and diaphragm shadow should be visible; overexposed radiographs are black, and underexposed radiographs are nearly white); symmetry (distance between sternal endings of clavicles and spinous processes should be similar; asymmetric images cause enlargement of mediastinal structures); depth of inspiration (the diaphragm should be below the inferior part of the 10th rib; poor inspiration may simulate pulmonary oedema and may hide small nodules); and elimination of breathing artefacts (if patients hold their breath during the examination, the shape of the heart, diaphragm and vessels will be sharp). b) Lateral view. Typical is lucent (dark) retrocardiac and retrosternal space and posterior diaphragmatic recess. Progressive lucency (darkening) of the thoracic spine as it approaches the diaphragm is visible and called spine sign. If not present, may suggest opacity (infiltrate or pleural effusion). RA: right atrium; RV: right ventricle; LA: left atrium; LV: left ventricle; IVC: inferior vena cava; RULB: right upper lobe bronchus; LULB: left upper lobe bronchus.
FIGURE 2
FIGURE 2
Limitations in chest radiography. a) Arrows: skin folds, which may mimic pneumothorax. b) External devices. Patient in intensive care unit, supine position posterior–anterior view. White arrow: ECG monitoring cables; grey arrow: endotracheal tube; black arrow: catheter in superior vena cava. Rotation of the image causes a shift of mediastinum to the left side. c) White arrows: border of scapula, which may mimic pneumothorax; grey arrow: patient's hand.
FIGURE 3
FIGURE 3
59-year-old male patient with a history of sublingual cancer with a sudden onset of dyspnoea. a) Chest radiograph demonstrated infiltrates and ground-glass opacity in basal distribution. Coronavirus disease 2019 (COVID-19) was suspected; therefore, a computed tomography (CT) scan was requested. b) Axial and c) coronal CT images depicted patchy nodular consolidations in the right lobe and in the left lung, mainly in peribronchial localisation. Extensive ground-glass regions could be observed around these areas. In the ventrobasal part of the left segment S3, a triangular consolidation area with a black bronchus sign was also detected, and a similar consolidation in the left S10. Bilateral few band-like lesions and pleural effusion were also visible. The depicted pulmonary abnormalities primarily indicated bronchopneumonia; COVID-19 pneumonia was considered less likely (CO-RADS category 2 (COVID-19 Reporting and Data System)).
FIGURE 4
FIGURE 4
Axial computed tomography. a) Consolidation in the left lower lung lobe. Histology confirmed lung adenocarcinoma. b) Tree-in-bud phenomenon, mucus plugs and bronchial wall thickening, corresponding to bronchiolitis.
FIGURE 5
FIGURE 5
Typical signs on lung ultrasound. a) Bat sign. b) Seashore sign. c) Barcode/stratosphere sign. d) B-line. e) Consolidation. f) Pleural effusion. g) Lung point in pneumothorax.
FIGURE 6
FIGURE 6
Magnetic resonance imaging (MRI). a) Axi T2 PROPELLER MRI scan of a 68-year-old patient demonstrated right upper lobe Pancoast tumour, with infiltration of the adjacent soft tissues. The tumour appears to be separated from the superior vena cava and the right brachiocephalic vein, as well as from the brachial plexus, by a narrow band of fat, while infiltration of the right subclavian artery has arisen. b and c) Low-field (0.55 T) MRI study of the lung with b) axial T1 VIBE TRA and c) coronal T2 TRUFI P2 FS sequence for the study of diaphragmatic motion during free breathing.
FIGURE 7
FIGURE 7
Ventilation/perfusion (Vʹ/Qʹ) scan of a 56-year-old female patient with progressively worsening dyspnoea. a and c) ventilation images; b and d) perfusion images. There are multiple characteristic peripheral, wedge-shaped segmental-subsegmental perfusion defects with normal ventilation pattern suggesting Vʹ/Qʹ mismatch, which confirms the diagnosis of pulmonary embolism. A: anterior; P: posterior; RLAT: right lateral; LLAT: left lateral; RAO: right anterior oblique; RPO: right posterior oblique; LAO: left anterior oblique; LPO: left posterior oblique.
FIGURE 8
FIGURE 8
Staging of lung adenocarcinoma with 2-fluoro-2-deoxy-d-glucose positron emission tomography/computed tomography (FDG-PET/CT). a) PET image; b) fused image; c) chest CT. Images show the primary tumour in the left lung, multiple pulmonary inflammatory lesions and bilateral adrenal metastases.
FIGURE 9
FIGURE 9
A 54-year-old female patient diagnosed with a lung carcinoid tumour underwent somatostatin receptor scintigraphy using a technetium-99m (99mTc)-labelled somatostatin analogue. a) Anterior and b) posterior whole body planar images display the primary tumour in the right lung, as well as solitary hepatic and breast metastasis and multiple bone metastases. c) Fused and d) computed tomography (CT) images from single-photon emission computed tomography (SPECT)/CT imaging of the patient depict the primary tumour in the middle lobe of the right lung and bone metastasis in the body of the seventh thoracic vertebra.
FIGURE 10
FIGURE 10
Coronavirus disease 2019 (COVID-19) pneumonia. 2-fluoro-2-deoxy-d-glucose positron emission tomography/computed tomography (FDG-PET/CT). a) PET image; b) fused image; c) chest CT. Images show bilateral, multiple, mainly peripheral, mildly/moderately active ground-glass opacities.

Similar articles

Cited by

References

    1. Czibor S, Kiss FJ, Györke T. A fluorodezoxiglükóz pozitron-emissziós tomográfia/komputertomográfia szerepe a tüdőtumorok ellátásában [The role of fluorodeoxyglucose positron emission tomography/computed tomography in the treatment of lung tumours]. Medicina Thoracalis 2021; 74: 319–325.
    1. Radiology Key . Imaging the chest: the chest radiograph. Date last updated: 4 July 2019. Date last accessed: 8 September 2023. https://radiologykey.com/imaging-the-chest-the-chest-radiograph/
    1. Li Y, Jiang L, Wang H, et al. . Effective radiation dose of 18F-FDG PET/CT: how much does diagnostic CT contribute? Radiat Prot Dosimetry 2019; 187: 183–190. 10.1093/rpd/ncz153. - DOI - PubMed
    1. Felson B. Fluoroscopy of the chest. Dis Chest 1955; 27: 322–329. doi:10.1378/chest.27.3.322 - DOI - PubMed
    1. Kári B, Karlinger K, Légrády D, et al., eds. Medical Imaging. Budapest, Semmelweis University and Budapest University of Technology and Economics, 2019. http://oftankonyv.reak.bme.hu/tiki-index.php?page=Orvosi_Posztgradu%C3%A...

LinkOut - more resources