. 2023 May;8(5):492-503.
doi: 10.1038/s41560-023-01241-8. Epub 2023 Apr 10.

Nuclear power generation phase-outs redistribute US air quality and climate-related mortality risk

Affiliations

Nuclear power generation phase-outs redistribute US air quality and climate-related mortality risk

Lyssa M Freese et al. Nat Energy. 2023 May.

Abstract

We explore how nuclear shut-downs in the United States could affect air pollution, climate and health with existing and alternative grid infrastructure. We develop a dispatch model to estimate emissions of CO2, NO x and SO2 from each electricity-generating unit, feeding these emissions into a chemical transport model to calculate effects on ground-level ozone and fine particulate matter (PM2.5). Our scenario of removing nuclear power results in compensation by coal, gas and oil, resulting in increases in PM2.5 and ozone that lead to an extra 5,200 annual mortalities. Changes in CO2 emissions lead to an order of magnitude higher mortalities throughout the twenty-first century, incurring US$11-180 billion of damages from 1 year of emissions. A scenario exploring simultaneous closures of nuclear and coal plants redistributes health impacts and a scenario with increased penetration of renewables reduces health impacts. Inequities in exposure to pollution are persistent across all scenarios-Black or African American people are exposed to the highest relative levels of pollution.


Conflict of interest statement

Competing interests The authors declare no competing interests.

Figures
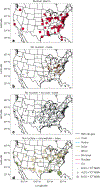
Fig. 1 |
Fig. 1 |. Maps of differences in annual energy generation by EGU across our scenarios.
ad, Annual energy production (MWh) by each nuclear plant in the base (a), difference in annual energy production (MWh) by unit in no nuclear compared to the base (b), difference in annual energy production by unit (MWh) in no nuclear + no coal compared to the base (c) and difference in annual energy production (MWh) by unit in no nuclear + renewables compared to the base (d). In b, c and d, we only plot the increases, which excludes nuclear power from b and d and nuclear and coal power from c.
Fig. 2 |
Fig. 2 |. Map of changes in concentration and mortalities in no nuclear compared to the base.
ad, Changes in April–September MDA8 ozone concentrations (a) and annual average PM2.5 concentrations (c) and the subsequent change in mortalities per 1 million people due to no nuclear compared with the base (b,d, respectively).
Fig. 3 |
Fig. 3 |. Distribution of exposure and mortalities by race and ethnicity for each county in no nuclear.
ah, Percentage of each race and ethnicity (Black or African American (a,f,k,p), Hispanic or Latino (b,g,l,q), American Indian or Alaska Native (c,h,m,r), White (d,i,n,s) and Asian or Pacific Islander (e,j,o,t)) with a given summer annual average PM2.5 (ae) and April–September MDA8 ozone exposure (ko) and related mortality rate by county (f–j and p–t, respectively), weighted by population for the difference between no nuclear and the base (fj and pt, respectively). Mean population-weighted exposure and mortalities are indicated by the vertical line.
Fig. 4 |
Fig. 4 |. Distribution of exposure and mortalities by race and ethnicity for each county in no nuclear + no coal.
ah, Percentage of each race and ethnicity (Black or African American (a,f,k,p), Hispanic or Latino (b,g,l,q), American Indian or Alaska Native (c,h,m,r), White (d,i,n,s) and Asian or Pacific Islander (e,j,o,t)) with a given annual average PM2.5 (ae) and April–September MDA8 ozone exposure (ko) and related mortality rate by county (f–j and p–t, respectively), weighted by population for the difference between no nuclear + no coal and the base. Mean population-weighted exposure and mortalities are indicated by the vertical line.
Fig. 5 |
Fig. 5 |. Map of changes in concentration and mortalities in no nuclear + no coal and no nuclear + renewables compared to the base.
ah, Changes in April–September MDA8 ozone (a,b) and annual average PM2.5 concentrations (e,f) and the respective subsequent change in mortalities per 1 million people (c,d and g,h).
Fig. 6 |
Fig. 6 |. Distribution of exposure and mortalities by race and ethnicity for each county in no nuclear + renewables.
Percentage of each race and ethnicity (Black or African American (a,f,k,p), Hispanic or Latino (b,g,l,q), American Indian or Alaska Native (c,h,m,r), White (d,i,n,s) and Asian or Pacific Islander (e,j,o,t)) with a given annual average PM2.5 (ae) and April–September MDA8 ozone exposure (ko) and related mortality rate by county (f–j and p–t, respectively), weighted by population for the difference between no nuclear + renewables and the base. Mean population-weighted exposure and mortalities are indicated by the vertical line.

Similar articles

References

    1. Annual Energy Outlook 2021 with Projections to 2050 (EIA, 2021).
    1. Larson E et al. Net-Zero America: Potential Pathways, Infrastructure, and Impacts (Princeton Univ., 2021); https://netzeroamerica.princeton.edu/the-report
    1. Markandya A & Wilkinson P Electricity generation and health. Lancet 370, 979–990 (2007). - PubMed
    1. Fell H, Gilbert A, Jenkins JD & Mildenberger M Nuclear power and renewable energy are both associated with national decarbonization. Nat. Energy 7, 25–29 (2022).
    1. Kharecha PA & Hansen JE Prevented mortality and greenhouse gas emissions from historical and projected nuclear power. Environ. Sci. Technol. 47, 4889–4895 (2013). - PubMed

LinkOut - more resources