

Education Research: Observational Study of Educational Debt Among US Medical Graduates Entering Neurology, 2010-2021
- PMID: 39360147
- PMCID: PMC11441742
- DOI: 10.1212/NE9.0000000000200118
Education Research: Observational Study of Educational Debt Among US Medical Graduates Entering Neurology, 2010-2021
Abstract
Background and objectives: To identify trends in educational debt for US medical school graduates entering neurology and compare debt to anticipated compensation.
Methods: Data of 148 accredited medical schools were obtained from the Association of American Medical Colleges Graduation and Matriculating Student Questionnaires to identify self-reported educational debt for graduates pursuing neurology training. Trends were assessed in a 2-year interval from 2010 to 2021. Descriptive statistics were used to assess characteristics associated with debt. Dollar amounts were adjusted to 2021 US dollars. Total compensation by subspecialty from the 2021 American Academy of Neurology Compensation and Productivity Survey was used to calculate debt-to-income ratios by subspecialty.
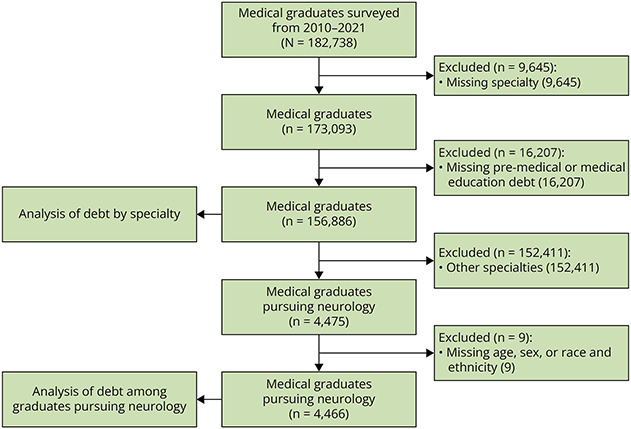
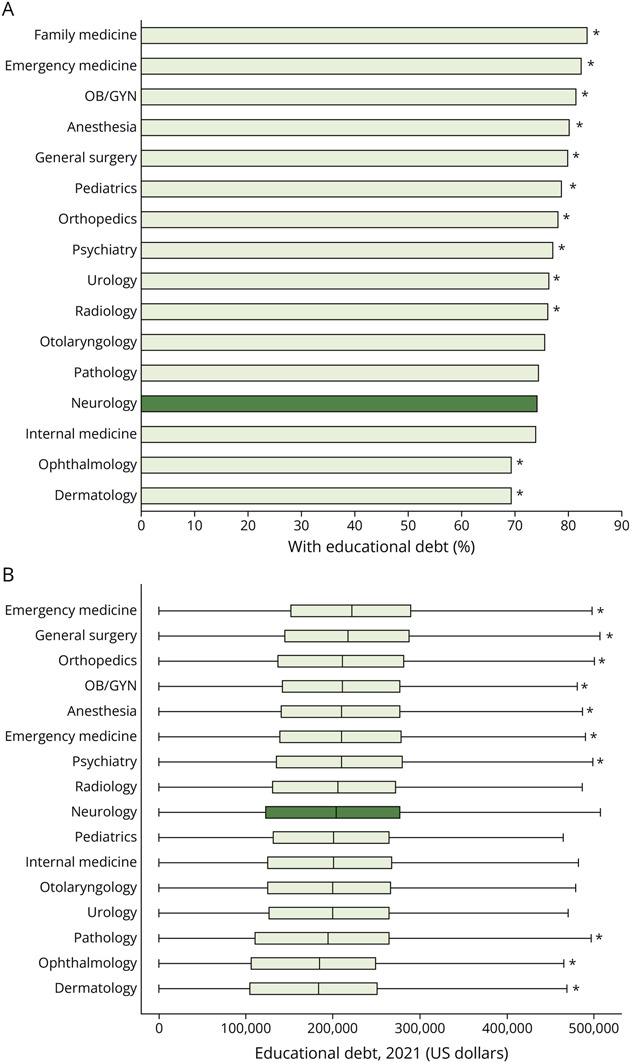
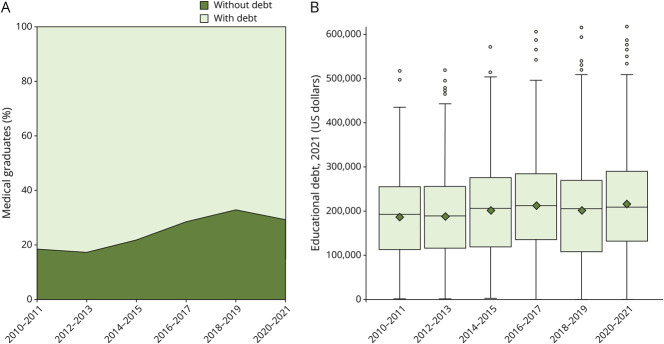
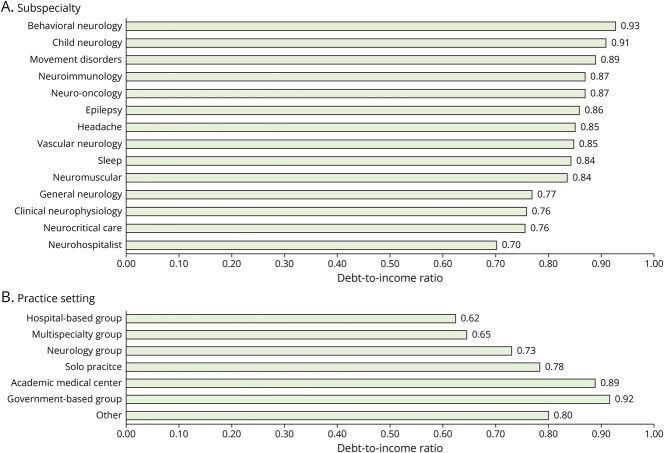
Results: There were 182,738 responses recorded from medical graduates from 2010 to 2021, of which 4,466 planned on neurology training. The percentage of medical graduates entering neurology with debt decreased from 82% in 2010-2011 to 71% in 2020-2021. Among indebted, the median educational debt increased 9% from $192,613 (interquartile range [IQR] $140,908) in 2010-2011 to $209,396 (IQR $159,128) in 2020-2021 (p < 0.001). Medical graduates with debt more often reported family income in the bottom 3 quintiles of US household income (18% with debt vs 7% without debt; p < 0.001). Graduates from self-identified race and ethnicity groups who are underrepresented in medicine (URiM) were more likely to have debt (15% vs 9%; p < 0.001) and had greater debt when compared with graduates not self-identifying as URiM (median $211,616 [IQR $152,760] vs $202,379 [IQR $153,340]; p < 0.001). In 2021, 46% of indebted neurology-bound graduates indicated plans to use Public Service Loan Forgiveness, which increased from 16% in 2010. In 2021, the median debt for neurology graduates represented between 70% and 93% of total annual compensation with the highest debt-to-income ratios among behavioral neurology (0.93), child neurology (0.91), and movement disorders (0.89).
Discussion: The burden of educational debt for neurology-bound graduates is increasingly concentrated among those from lower-income families and racial and ethnic groups who are URiM. Subspecialties that often manage patients in the outpatient setting, as compared with those that are primarily inpatient/procedural, may have greater debt with respect to their compensation. Nearly half of 2021 graduates pursuing neurology plan to use tax-payer funds for loan forgiveness.
© 2024 American Academy of Neurology.
Conflict of interest statement
The authors report no relevant disclosures. Go to Neurology.org/NE for full disclosures.
Figures
Similar articles
-
Educational Debt Among US Medical Graduates Entering Radiology.J Am Coll Radiol. 2025 Aug 14:S1546-1440(25)00461-2. doi: 10.1016/j.jacr.2025.08.011. Online ahead of print. J Am Coll Radiol. 2025. PMID: 40818753
-
On rising medical student debt: in for a penny, in for a pound.Acad Med. 1996 Oct;71(10):1124-34. doi: 10.1097/00001888-199610000-00024. Acad Med. 1996. PMID: 9177651
-
Role of Debt and Loan Forgiveness/Repayment Programs in Osteopathic Medical Graduates' Plans to Enter Primary Care.J Am Osteopath Assoc. 2019 Apr 1;119(4):227-235. doi: 10.7556/jaoa.2019.038. J Am Osteopath Assoc. 2019. PMID: 30907961
-
Characteristics and career intentions of the emerging MD/PhD workforce.JAMA. 2008 Sep 10;300(10):1165-73. doi: 10.1001/jama.300.10.1165. JAMA. 2008. PMID: 18780845
-
Educational debt and reported career plans among internal medicine residents.Ann Intern Med. 2008 Sep 16;149(6):416-20. doi: 10.7326/0003-4819-149-6-200809160-00008. Ann Intern Med. 2008. PMID: 18794561
References
-
- Younglaus J, Fresne JA. Physician Education Debt and the Cost to Attend Medical School. Association of American Medical Colleges; 2020.
-
- Medicare's 2023 fee schedule: cuts in reimbursement, expanded payments for behavioral health [online]. Accessed February 4, 2023. medicaleconomics.com/view/medicare-s-2023-fee-schedule-cuts-in-reimburse....
-
- Goodson JD, Shabazi S, Song Z. Medicare's 2021 Physician Fee Schedule: A Redistribution That Requires Further Refinement [online]. Accessed February 4, 2023. healthaffairs.org/do/10.1377/forefront.20210706.220969/. - DOI
LinkOut - more resources
Full Text Sources