. 2024 Dec;244(6):2311-2325.
doi: 10.1111/nph.20152. Epub 2024 Oct 3.

Phosphate promotes Arabidopsis root skewing and circumnutation through reorganisation of the microtubule cytoskeleton

Affiliations

Phosphate promotes Arabidopsis root skewing and circumnutation through reorganisation of the microtubule cytoskeleton

Hui Sheng et al. New Phytol. 2024 Dec.

Abstract

Phosphate (Pi) plays a key role in plant growth and development. Hence, plants display a range of adaptations to acquire it, including changes in root system architecture (RSA). Whether Pi triggers directional root growth is unknown. We investigated whether Arabidopsis roots sense Pi and grow towards it, that is whether they exhibit phosphotropism. While roots did exhibit a clear Pi-specific directional growth response, it was, however, always to the left, independent of the direction of the Pi gradient. We discovered that increasing concentrations of KH2PO4, trigger a dose-dependent skewing response, in both primary and lateral roots. This phenomenon is Pi-specific - other nutrients do not trigger this - and involves the reorganisation of the microtubule cytoskeleton in epidermal cells of the root elongation zone. Higher Pi levels promote left-handed cell file rotation that results in right-handed, clockwise, root growth and leftward skewing as a result of the helical movement of roots (circumnutation). Our results shed new light on the role of Pi in root growth, and may provide novel insights for crop breeding to optimise RSA and P-use efficiency.

Keywords: Arabidopsis; circumnutation; microtubule cytoskeleton; phosphate; root skewing.


Conflict of interest statement

None declared.

Figures

Fig. 1
Fig. 1
Arabidopsis root growth deviates to the left in response to increased Pi levels, independent of where the concentration gradient comes from. (a) Schematic diagram of Pi‐tropism assay, with low‐Pi concentration in the agar medium and high Pi on a piece of filter paper (blue), placed at the left‐hand corner, 3.5 cm away from the seedlings. (b) Visualisation of Pi diffusion using radioactive 32Pi. The 32Pi was spotted onto the filter paper and the radioactivity imaged 97 h later. (c) Phenotype of Col‐0 seedlings grown on low Pi‐agar medium with filter paper containing high Pi or MQ water, either on the left‐ or right side of the agar plate, 6 d after transfer. (d) Quantification of root angles. The middle line represents the median, and the dotted line represents quartiles. Different letters indicate significant differences (P < 0.05) among treatments (One‐way ANOVA followed by Tukey HSD post hoc analysis, F 3,133 = 48.48, P < 0.001). n = 25–49. Bar, 1 cm.
Fig. 2
Fig. 2
Increasing KH2PO4 concentrations promote root skewing in Arabidopsis ecotypes Col‐0 (a–d) and Ws‐4 (e–h). (a, e) Seedling phenotype after 9 d of growth on ½MS medium containing indicated KH2PO4 concentrations. (b, f) Projections of primary roots of 34–40 seedlings grown at indicated Pi concentration. (c, g) Same as panels b and f, but with the overlap indicated in purple. (d, h) Quantification of root skewing using horizontal growth index (HGI). Data represent means ± SE (n = 34–40). Different letters indicate significant differences (P < 0.05) among treatments using One‐way ANOVA followed by Tukey HSD post hoc analysis: F 12,479 = 189.5, P < 0.0001 (d) or F 12,484 = 415, P < 0.0001 (h). Bars, 1 cm.
Fig. 3
Fig. 3
Phosphate is responsible for the induced root skewing in Arabidopsis. (a, c) Primary root projections and overlap (purple) of 9‐d‐old seedlings of Ws‐4 (a) and Col‐0 (c), grown on normal ½‐strength Murashige & Skoog medium (½MS) (containing standard 625 μM Pi) or ½MS supplemented with 625 μM Pi of different cationic composition, that is K+, Na+, or NH4 +. (b, d) HGI for Col‐0 (b) and Ws‐4 (d). The middle line represents the median and box limits indicate the 25th and 75th percentiles; whiskers span down to the minimum and up to the maximum values, and individual data points are represented by dots. One‐way ANOVA was performed to identify significant differences of Ws‐4 (F 3,144 = 64.39, P < 0.0001) and Col‐0 (F 3,147 = 155.3, P < 0.001) between treatments. Different letters indicate a statistically significant difference (P < 0.05) by Tukey HSD post hoc analysis (n = 31–40). Bars, 1 cm.
Fig. 4
Fig. 4
Time‐lapse of root growth and skewing responses in Col‐0 and Ws‐4 seedlings at 300 or 1250 μM Pi. The growth of Arabidopsis Col‐0 and Ws‐4 seedlings were followed over a period of 6 d in a 16 h : 8 h, L : D regime. Images were captured every 10 min. Left panels (a, c, e) 300 μM Pi, right panels (b, d, f) 1250 μM Pi. (a, b) Primary root length, (c, d) growth rate, and (e, f) primary root angles. Values represent the means of five biological replicates of five seedlings. Blue symbols, Col‐0; red symbols, Ws‐4. See also Supporting Information Videos S1 and S2.
Fig. 5
Fig. 5
Increasing Pi concentrations promote skewing of lateral roots. Root system architecture of Arabidopsis thaliana seedlings, ecotypes Col‐0 (a) and Ws‐4 (d) grown at 300‐, 625‐, or 1250 μM Pi for 10 d. The first two lateral roots on the left (indicated in red) and on the right (indicated in yellow) were analysed for growth directions. (b, e) Projections of multiple left (red) or right (yellow) lateral roots of Col‐0 (b) or Ws‐4 (e). (c, f) Box plot analyses of HGI values for left‐ and right lateral roots of Col‐0 (c) or Ws‐4 (f). The middle line represents the median and box limits indicate the 25th and 75th percentiles; whiskers span down to the minimum and up to the maximum values, and individual data points are represented by dots. The one‐way ANOVA and Kruskal–Wallis test were performed to identify significant differences of Col‐0 (F 5,445 = 297, P < 0.0001) and Ws‐4, respectively. Different letters indicate significant differences (P < 0.05) among treatments. Values represent lateral roots of 30–41 seedlings. Bars, 1 cm.
Fig. 6
Fig. 6
Pi promotes right‐handed root growth and left‐handed epidermal cell file rotation (CFR). (a, b) Stereomicroscopic images of root tips of Arabidopsis Col‐0 (a) and Ws‐4 (b) at 300‐, 625‐, or 1250 μM of Pi. (c, d) Zoom‐in of elongation zone of Col‐0 (c) and Ws‐4 (d) root grown at 1250 μM Pi. Black arrows indicate root growth direction; red dotted lines indicate CFR direction. (e, f) Confocal images of root elongation zone of propidium iodide‐stained Col‐0 (e) or Ws‐4 (f) seedlings, grown at indicated Pi concentrations. (g) Quantitative analysis of epidermal CFR angle at elongation zone of Col‐0 or Ws‐4 seedlings. Different letters indicate significant differences (P < 0.05) between treatments (One‐way ANOVA followed by Tukey HSD post hoc analysis, F 5,139 = 73.92, P < 0.0001). Values represent three biological replicates with 6–11 seedlings analysed for each replicate. The middle line represents the median and box limits indicate the 25th and 75th percentiles; whiskers span down to the minimum and up to the maximum values, and individual data points are represented by dots. (h) Skewing direction of seedling (front view). (i, j) Stereomicroscopic image showing right‐handed (clockwise) root growth (i) and left‐handed (counterclockwise) epidermal cell file rotation (j) in the same image, captured from a Col‐0 seedling grown vertically for 4 d and was then placed horizontally for another 2 d, which causes roots to coil into their growth direction. Red dotted lines indicate the direction of the epidermal cell file (i). All images are front view. Bars: (a–f) 100 μm; (h–j) 1 mm.
Fig. 7
Fig. 7
Pi‐dependent root skewing is enhanced by microtubule‐stabilisation drug, Taxol. (a) Phenotype of Arabidopsis Col‐0 seedlings grown on indicated Pi concentrations with and without 1 μM Taxol after 7 d. Bar, 1 cm. (b) Quantification of HGI value of seedlings growing at different Pi concentrations with or without Taxol. Two‐way ANOVA was used to determine the significant differences between different Pi treatments (F 2,151 = 300.8, P < 0.0001) and Taxol treatments (F 1,151 = 3557, P < 0.0001). (c) Stereomicroscope images of the surface of roots exposed to different treatments. (d) Quantitative analysis of epidermal CFR angle at the base of the elongation zone at different Pi concentrations. Two‐way ANOVA was used to determine the significant differences between different Pi treatments (F 2,137 = 179.8, P < 0.0001) and Taxol treatments (F 1,137 = 393.7.1, P < 0.0001). (e) Confocal microscope images of propidium iodide‐stained elongation zone of root grown on different Pi concentrations. The data shown are means ± SE. Different letters indicate significant differences (P < 0.05) between treatments. All values represent two biological replicates with 11–15 seedlings analysed for each replicate. Bars, 100 μm.
Fig. 8
Fig. 8
Effect of Pi on PDS and microtubule orientation in FP‐reporter lines. (a) Quantification of HGI value in different microtubule reporter lines, grown on different Pi concentrations. All values represent the means of two biological replicates with 6–15 seedlings analysed for each replicate. (b) Original confocal images (left, green) and ImageJ‐processed images (right, coloured) of 5‐d‐old UBQ::GFP‐TUB6 seedlings. (c) Quantification of microtubule orientation by measuring multiple ROIs in cells grown at different Pi concentrations in Arabidopsis UBQ::GFP‐TUB6. (d) Distribution of microtubule orientation. Angles ranging from 22.5 to −22.5° were considered ‘Transverse’, while angles ranging from 67.5 to 90° and −67.5 to −90° were considered ‘Longitudinal’; all others were designated as ‘Random’. Values represent the mean of five biological replicates with 10–15 seedlings per condition. Data shown are means ± SE. Asterisks indicate a statistically significant difference (**, P < 0.01; ***, P < 0.001, ns, not significant) by two‐way ANOVA. Differences between 300 and 1250 μM were statistically significant (P < 0.001) for each line except for UBQ1::GFP‐MBD, which did not respond at all. Bar, 10 μm.
Fig. 9
Fig. 9
Pi affects root penetration power due to 3D skewing. To test whether Pi promotes PDS in a 3D‐agar environment, the bending of primary roots was analysed in a vertical two‐layered agar system. The first layer of 0.7% allows seed germination and root growth, while the second layer contains either 0.7% or 1.6% agar to score the penetration power of the roots. (a) Schematic drawing of the vertical two‐layered agar system. (b) Examples of Arabidopsis bending and nonbending roots. Nonbending roots directly penetrate the lower layer medium while bending roots bounch‐off the lower agar medium and grow along the interface. Left panel shows typical nonbending root at 300 μM Pi while right panels shows typical bending/skewing roots at 1250 μM (c) Quantification of roots showing a bending response at 300, 625 and 1250 μM Pi. X‐axis indicates agar concentration of the lower layer (0.7% or 1.6%). Data shown are means ± SE. The Kruskal–Wallis test was performed to identify significant differences. Different letters indicate significant differences (P < 0.05) among treatments. All values represent two biological replicates. n = 91–126. Bars, 1 mm.
Fig. 10
Fig. 10
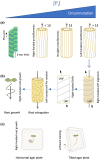
Model explaining right‐ and left‐handed directional movements of microtubules, cells and root during PDS in Arabidopsis. (a–c) Mechanism involves the rearrangement of microtubules affecting the CFR of epidermal cells in the elongation zone and rotational growth direction (circumnutation) of the root tip. Increased Pi concentrations promote a right‐handed shift of cortical microtubules (cMT) (a), which is followed by the right‐handed twisting of cellulose microfibrils (CMF) (b). This creates a biophysical torsion during cell elongation that triggers an increase in left‐handed CFR of epidermal cells in the root elongation zone (b), and promotes the subsequent rightward growth of the root (as seen on horizontal agar plates) and the leftward skewing on vertical plates (c). Figure is adapted from Zhou (2021).

Similar articles

References

    1. Ahn PM, Keter JKA. 1986. Profile characteristics, and form and surface activity of inorganic phosphorus in a deep red Kenya coffee soil (Nitosol). European Journal of Soil Science 37: 89–91.
    1. Al‐Babili S, Bouwmeester HJ. 2015. Strigolactones, a novel carotenoid‐derived plant hormone. Annual Review of Plant Biology 66: 161–186. - PubMed
    1. Ambrose C, Allard JF, Cytrynbaum EN, Wasteneys GO. 2011. A CLASP‐modulated cell edge barrier mechanism drives cell‐wide cortical microtubule organization in Arabidopsis. Nature Communications 2: 430. - PMC - PubMed
    1. Arieti RS, Staiger CJ. 2020. Auxin‐induced actin cytoskeleton rearrangements require AUX1. New Phytologist 226: 441–459. - PMC - PubMed
    1. Aung K, Lin S‐I, Wu C‐C, Huang Y‐T, Su C, Chiou T‐J. 2006. Pho2, a phosphate overaccumulator, is caused by a nonsense mutation in a MicroRNA399 target gene. Plant Physiology 141: 1000–1011. - PMC - PubMed

MeSH terms

LinkOut - more resources