. 2024 Oct;14(10):e70032.
doi: 10.1002/ctm2.70032.

Structural inequality and temporal brain dynamics across diverse samples

Affiliations

Structural inequality and temporal brain dynamics across diverse samples

Sandra Baez et al. Clin Transl Med. 2024 Oct.

Abstract

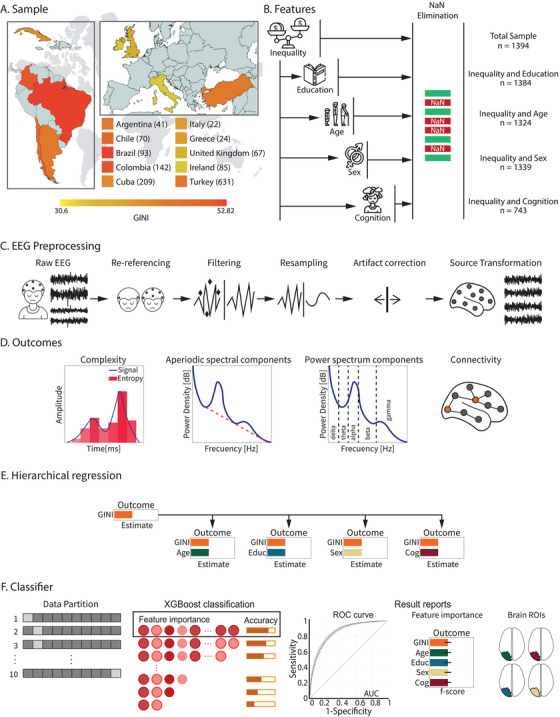
Background: Structural income inequality - the uneven income distribution across regions or countries - could affect brain structure and function, beyond individual differences. However, the impact of structural income inequality on the brain dynamics and the roles of demographics and cognition in these associations remains unexplored.

Methods: Here, we assessed the impact of structural income inequality, as measured by the Gini coefficient on multiple EEG metrics, while considering the subject-level effects of demographic (age, sex, education) and cognitive factors. Resting-state EEG signals were collected from a diverse sample (countries = 10; healthy individuals = 1394 from Argentina, Brazil, Colombia, Chile, Cuba, Greece, Ireland, Italy, Turkey and United Kingdom). Complexity (fractal dimension, permutation entropy, Wiener entropy, spectral structure variability), power spectral and aperiodic components (1/f slope, knee, offset), as well as graph-theoretic measures were analysed.

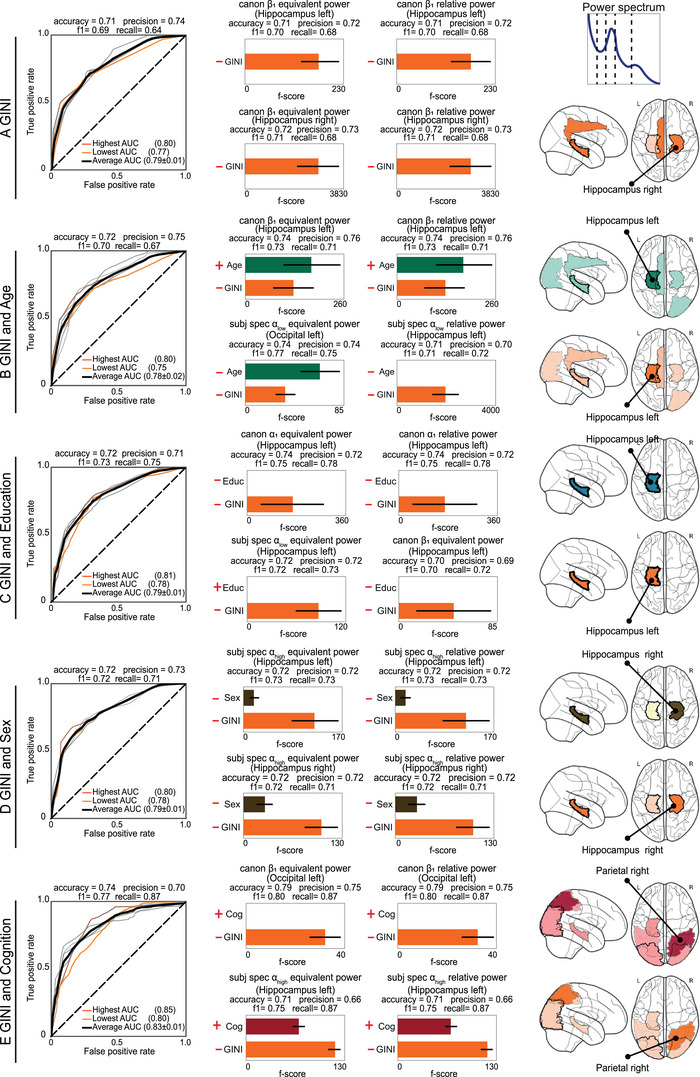
Findings: Despite variability in samples, data collection methods, and EEG acquisition parameters, structural inequality systematically predicted electrophysiological brain dynamics, proving to be a more crucial determinant of brain dynamics than individual-level factors. Complexity and aperiodic activity metrics captured better the effects of structural inequality on brain function. Following inequality, age and cognition emerged as the most influential predictors. The overall results provided convergent multimodal metrics of biologic embedding of structural income inequality characterised by less complex signals, increased random asynchronous neural activity, and reduced alpha and beta power, particularly over temporoposterior regions.

Conclusion: These findings might challenge conventional neuroscience approaches that tend to overemphasise the influence of individual-level factors, while neglecting structural factors. Results pave the way for neuroscience-informed public policies aimed at tackling structural inequalities in diverse populations.

Keywords: EEG; brain dynamics; cognition; demographics; individual differences; structural income inequality.


Conflict of interest statement

The authors declare that they have no known competing financial interests or personal relationships that could have appeared to influence the work reported in this paper.

Figures

FIGURE 1
FIGURE 1
An integrative approach for assessing EEG correlates of income inequalities. (A) Geographical distribution of the sample. The participating countries are highlighted. Numbers in parentheses indicate the sample sizes for each country. The colour bar emphasises the Gini coefficients. (B) Sociodemographic variables. The set of variables explored includes inequality, demographics and cognition. Education data were available for 1384 participants; sex information was provided by 1339 individuals, and 743 participants were assessed for cognition. (C) EEG preprocessing: The main steps of the processing workflow. (D) EEG outcomes. Four categories of metrics were computed in the EEG source space: complexity components, aperiodic spectral components, power spectrum components, and connectivity. (E) Hierarchical regressions. Associations were assessed between sociodemographic variables and EEG outcomes. Linear regression models were implemented using Gini as a predictor, as well as in combination with demographics and cognition, respectively. (F) Classifiers. The XGBoost classifier was utilised with an 80% training sample and a 20% testing set (k = 10 repetitions) to explore the predictive value of inequality and its interaction with demographics and cognition for EEG outcomes. Classification models tuned through cross‐validation employing five sets of predictors: Gini, Gini and years of education, Gini and age, Gini and sex, and Gini and cognition. We reported ROC curves, rankings of feature importance, and topographical information about representative brain regions.
FIGURE 2
FIGURE 2
Inequality, demographics, and cognition as predictors of the EEG complexity. EEG complexity metrics were classified using five sets of classification models: (A) Gini, (B) Gini and age, (C) Gini and education, (D) Gini and sex, and (E) Gini and cognition. The symbols in the figure denote the orientation of the predictors in relation to the outcome. The left panels of each section show the ROC curves for the top 10 regression models (grey colour lines). The ROC curves with the lowest and highest area under curve (AUC) are denoted in light and dark orange, respectively, with the mean ROC highlighted by a black line. The average accuracy, precision, F1 score, and recall, are also provided. The middle panels display the feature importance for the top four classification models, alongside their performance metrics. The plus and minus signs on the left side of charts denote the direction of the correlation between the predictors and the EEG outcome. The right panels show brain topographical information from the top 10 classification models. The brain colours indicate the predictors being analysed and match the colour of the horizontal bars in middle panels). The darkness of the colours indicates the brain region's relevance for the classification, with darker tones representing greater relevance. The absence of bars in the central panels indicates that the predictors were not statistically significant in relation to the outcome.
FIGURE 3
FIGURE 3
Inequality, demographics and cognition as predictors of aperiodic spectral components. The aperiodic spectral components were classified using the following predictors: (A) Gini, (B) Gini and age, (C) Gini and education, (D) Gini and sex and (E) Gini and cognition. The symbols in the figure denote the orientation of the predictors in relation to the outcome. The left panels of each section show the ROC curves for the top 10 regression models (grey colour lines). The ROC curves with the lowest and highest area under curve (AUC) are denoted in light and dark orange, respectively, with the mean ROC highlighted by a black line. The average accuracy, precision, F1 score, and recall are also provided. The middle panels display the feature importance for the top four classification models, alongside their performance metrics. The right panels show brain topographical information from the top 10 classification models. The brain colours correspond to the colours representing the predictors (horizontal bars in middle panels). Darker colours indicate a brain region's relevance in the models. The lack of bars in the central panels indicates that the predictors were not statistically significant with respect to the outcome.
FIGURE 4
FIGURE 4
Inequality, demographics and cognition as predictors of power spectrum components. The power spectrum components were classified using the following predictors: (A) Gini, (B) Gini and age, (C) Gini and education, (D) Gini and sex, and (E) Gini and cognition. The symbols in the figure denote the orientation of the predictors in relation to the outcome. The left panels of each section show the ROC curves for the top 10 regression models (grey colour lines). The ROC curves with the lowest and highest area under curve (AUC) are denoted in light and dark orange, respectively, with the mean ROC highlighted by a black line. The average accuracy, precision, F1 score, and recall, are also provided. The middle panels display the feature importance for the top four classification models, alongside their performance metrics. The right panels show brain topographical information from the top 10 classification models. The brain colours correspond to the colours representing the predictors (horizontal bars in middle panels). Darker colours indicate a brain region's relevance in the models. The missing bars in the central panels indicate that the predictors were not statistically significant regarding the outcome.
FIGURE 5
FIGURE 5
Inequality, demographics and cognition as predictors of graph‐theoretical measures. The graph‐theoretic measures were classified using the following predictors: (A) Gini, (B) Gini and age, (C) Gini and education, (D) Gini and sex, and (E) Gini and cognition. The symbols in the figure denote the orientation of the predictors in relation to the outcome. The left panels of each section show the ROC curves for the top 10 regression models (grey colour lines). The ROC curves are shown with the area under the curve (AUC) of the only outcome of graph‐theoretic measures that was significant in the results of Section 2.1. In each section, the right panels show the importance of the features. The absence of bars in the central panels indicates that the predictors were not statistically significant in relation to the outcome.

References

    1. Ibanez A, Melloni L, Świeboda P, et al. Neuroecological links of the exposome and One Health. Neuron. 2024;112:1905‐191. - PMC - PubMed
    1. McCartney G, Hearty W, Arnot J, Popham F, Cumbers A, McMaster R. Impact of political economy on population health: a systematic review of reviews. Am J Public Health. 2019;109(6):e1‐e12. - PMC - PubMed
    1. Hatzenbuehler ML, McLaughlin KA, Weissman DG, Cikara M. A research agenda for understanding how social inequality is linked to brain structure and function. Nat Human Behav. 2024;8:20‐31. - PMC - PubMed
    1. Ibáñez A, Legaz A, Ruiz‐Adame M. Addressing the gaps between socioeconomic disparities and biological models of dementia. Brain. 2023;146(9):3561‐3564.
    1. Baez S, Alladi S, Ibanez A. Global South research is critical for understanding brain health, ageing and dementia. Clin Transl Med. 2023;13(11):e1486. - PMC - PubMed

LinkOut - more resources