

A 14-year longitudinal study of neurofilament light chain dynamics in premanifest and transitional Huntington's disease
- PMID: 39361164
- PMCID: PMC11588772
- DOI: 10.1007/s00415-024-12700-x
A 14-year longitudinal study of neurofilament light chain dynamics in premanifest and transitional Huntington's disease
Abstract
Background: Growing evidence supports the value of neurofilament light (NfL) as a prognostic biomarker in premanifest Huntington's disease (HD). To date, however, there has been no longitudinal study exceeding 3 years examining either its serial dynamics or predictive power in HD. We aimed to conduct the first such study.
Methods: Serum NfL was sampled using ultrasensitive immunoassay at four timepoints across a 14-year period in a cohort of HD gene carriers (n = 21) and controls (n = 14). Gene carriers were premanifest at baseline. Clinical features of HD were evaluated by Unified Huntington's Disease Rating Scale (UHDRS TMS), Montreal Cognitive Assessment (MoCA), Trail A/B task, Symbol Digit Modalities Task and semantic/phonemic fluency tasks.
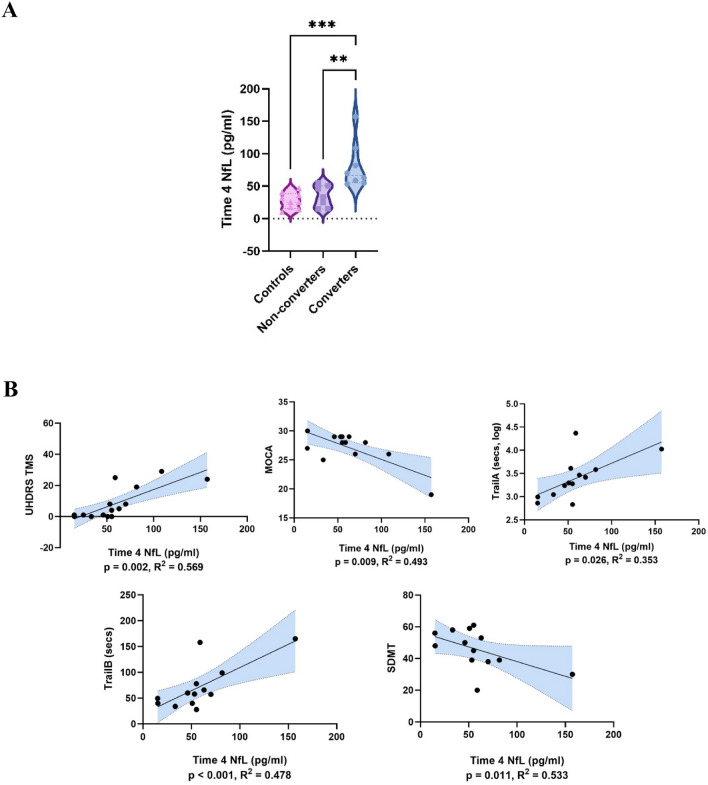
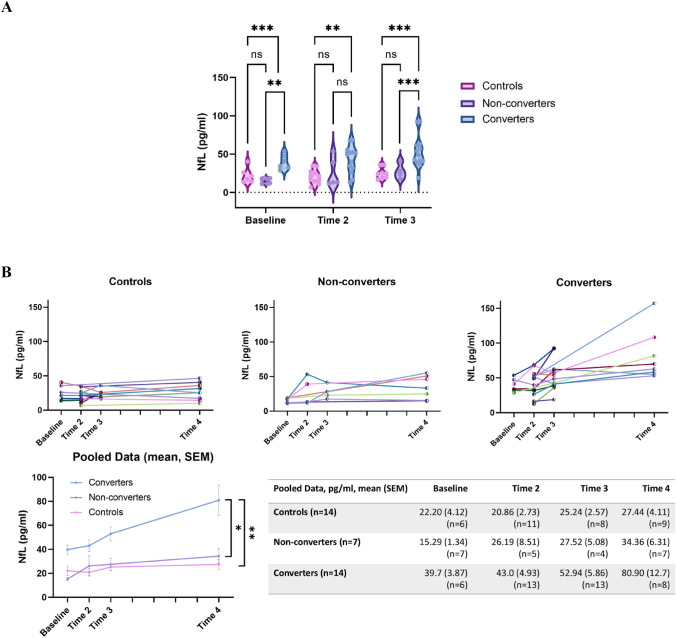
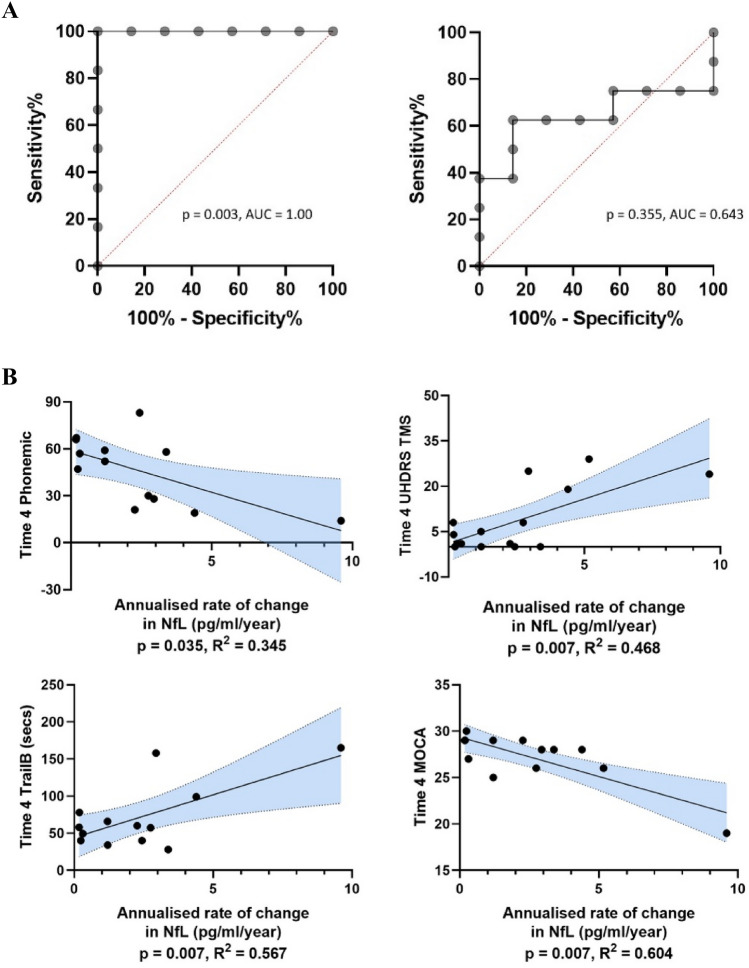
Results: 14/21 HD gene carriers converted to prodromal or manifest disease by the final timepoint ("converters"). At baseline and each subsequent timepoint, NfL levels were higher in converters than in non-converters and controls (p = < 0.001-0.03, ηp2 = 0.25-0.66). The estimated rate of change in NfL was higher in converters than in non-converters (p = 0.03) and controls (p = 0.001). Baseline NfL was able to discriminate converters from non-converters (area under curve = 1.000, p = 0.003). A higher rate of change in NfL was predictive of more severe motor (UHDRS-TMS p = 0.007, β = 0.711, R2 = 0.468) and cognitive deficits (MoCA p = 0.007, β = - 0.798, R2 = 0.604; Trail B, p = 0.007, β = 0.772, R2 = 0.567; phonemic fluency p = 0.035, β = - 0.632, R2 = 0.345).
Conclusions: Our data suggest that (1) NfL longitudinal dynamics in premanifest/transitional HD are non-constant; rising faster in those closer to disease onset, and (2) NfL can identify individuals at risk of conversion to manifest disease and predict clinical trajectory, > 10 years from disease onset.
Keywords: Biomarker; Dementia; Huntington’s disease; Longitudinal; Neurodegeneration; Neurofilament light chain.
© 2024. The Author(s).
Conflict of interest statement
Declarations. Conflict of interest: The authors have no relevant financial or non-financial interests to disclose, other than the position held by RA Barker (Editor of Journal of Neurology). RA Barker therefore did not assume responsibility for overseeing peer review. Ethical approval: Ethical approval was granted by local ethics committees in accordance with the 1964 Declaration of Helsinki and all participants provided written informed consent (REC 03/187 and 15/EE/0445).
Figures

References
-
- Andrew SE, Paul Goldberg Y, Kremer B, Telenius H, Theilmann J, Adam S et al (1993) The relationship between trinucleotide (CAG) repeat length and clinical features of Huntington’s disease. Nat Genet 4(4):398–403 - PubMed
-
- Tabrizi SJ, Schobel S, Gantman EC, Mansbach A, Borowsky B, Konstantinova P et al (2022) A biological classification of Huntington’s disease: the integrated staging system. Lancet Neurol 21(7):632–644 - PubMed
MeSH terms
Substances
Grants and funding
LinkOut - more resources
Full Text Sources
Medical
