. 2024 Oct 3;134(23):e181169.
doi: 10.1172/JCI181169.

Reactive microglia partially envelop viable neurons in prion diseases

Affiliations

Reactive microglia partially envelop viable neurons in prion diseases

Natallia Makarava et al. J Clin Invest. .

Abstract

Microglia are recognized as the main cells in the central nervous system responsible for phagocytosis. The current study demonstrates that in prion disease, microglia effectively phagocytose prions or PrPSc during early preclinical stages. However, a critical shift occurred in microglial activity during the late preclinical stage, transitioning from PrPSc uptake to establishing extensive neuron-microglia body-to-body cell contacts. This change was followed by a rapid accumulation of PrPSc in the brain. Microglia that enveloped neurons exhibited hypertrophic, cathepsin D-positive lysosomal compartments. However, most neurons undergoing envelopment were only partially encircled by microglia. Despite up to 40% of cortical neurons being partially enveloped at clinical stages, only a small percentage of envelopment proceeded to full engulfment. Partially enveloped neurons lacked apoptotic markers, but showed signs of functional decline. Neuronal envelopment was independent of the CD11b pathway, previously associated with phagocytosis of newborn neurons during neurodevelopment. This phenomenon of partial envelopment was consistently observed across multiple prion-affected brain regions, various mouse-adapted strains, and different subtypes of sporadic Creutzfeldt-Jakob disease (sCJD) in humans. The current work describes a phenomenon of partial envelopment of neurons by reactive microglia in the context of an actual neurodegenerative disease, not a disease model.

Keywords: Infectious disease; Innate immunity; Neurodegeneration; Neuroscience; Prions.


Conflict of interest statement

Conflict of interest: The authors have declared that no conflict of interest exists.

Figures

Figure 1
Figure 1. Reactive microglia in prion-infected mice extend into pyramidal layer of CA1 area of hippocampus.
The CA1 area of hippocampus in noninfected age-matched control C57BL/6J mice (Ctrl) and C57BL/6J mice infected with SSLOW via i.c. examined at clinical onset and terminal stage using staining with anti-IBA1 (a marker of microglia, A and C) and anti-NeuN (a nuclear neuronal marker, A and C). (B) Quantification of the mean intensity of IBA1 and NeuN signals in pyramidal layer of hippocampus. Colors represent different brains. Dots represent mean intensity values in individual fields of view. Average values for each brain are shown as circles. Black lines mark means. n = 3 animals per group. *P < 0.05; **P < 0.01; ***P < 0.001, ordinary 1-way ANOVA followed by Tukey’s multiple-comparison tests. (C) 3D reconstruction of confocal microscopy images of reactive microglia invading pyramidal layer in terminal SSLOW-infected mice. Scale bars: 50 μm (A); 100 μm (C).
Figure 2
Figure 2. Reactive microglia in cortexes of prion-infected mice envelop neuronal soma.
Terminally ill C57BL/6J mice infected with SSLOW via i.p. (A and B) or i.c. routes (C) or noninfected age-matched controls (D), stained with anti-IBA1 (AD) and anti-MAP2 (A and B) or anti-NeuN (C and D) antibodies and examined by epifluorescence microscopy (A) or confocal microscopy following by 3D reconstruction (BD). Smaller panels in A and B show enlarged images of individual microglial cells that partially or fully envelopes neuronal soma. In A, dashed circles mark nuclei, arrows and arrowheads point at neuronal and microglial nuclei, respectively. Scale bars: 20 μm (A); 10 μm (B); 50 μm (C and D).
Figure 3
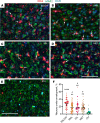
Figure 3. Envelopment of neurons is a common property among prion strains.
(AD) Representative images of neuronal envelopment (arrows) by reactive microglia in cortex of C57BL/6J mice infected with SSLOW (A), RML (B), 22L (C), and ME7 (D) via i.p. and mock-inoculated age-matched mice (E) stained using anti-IBA1 (red) and anti-MAP2 (green) antibodies. The dataset from the 22L-infected and mock-inoculated control groups were also used to report microglia-neuronal colocalization in the Figure 5 of the manuscript by Sinha et al. (49). (F) Quantification of the percentage of neurons that are undergoing envelopment in cortexes of mice infected with SSLOW, RML, 22L or ME7, and mock-infected control mice (Ctrl). Colors represent different brains. Dots represent individual fields of view. Average values for each brain are shown as circles. Black lines mark strain means. n = 4 animals per group. **** P < 0.0001; **P < 0.01, statistical significance versus control; #P < 0.05, statistical significance versus SSLOW by ordinary 1-way ANOVA followed by Dunnett’s multiple-comparison tests. Scale bars: 50 μm.
Figure 4
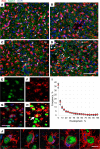
Figure 4. The vast majority of neurons are only partially enveloped.
(AD) Envelopment of neurons (arrows) in cerebral cortex (Ctx) (A), caudate/putamen (CP) (B), hippocampus (Hp) (C), and thalamus (Th) (D) of C57BL/6J mice infected with SSLOW via i.c. route at the terminal stage. Staining was performed using anti-IBA1 (red) and anti-MAP2 (green) antibodies. (EI) Quantification of the neuronal area enveloped by microglia. With epifluorescence microscopy, light penetrates the full depth of a cell; thus an overlap of signal from neuronal (NeuN, E) and microglial (IBA1, F) markers is observed when a neuronal body is undergoing envelopment by a microglial cell (G). The percentage of neuronal area enveloped by microglia is estimated for individual neurons as a fraction of NeuN signal overlapped with IBA1 signal. (H) Merged thresholds of images from IBA1 and NeuN channels. Arrow points to a rare event of a complete envelopment. (I) Frequency distribution of the enveloped areas of the individual neurons quantified for the cortex of SSLOW-infected mice. n = 3 animals, n = 1,169, 1,422, and 1,551 envelopment events for individual animals. (J) A gallery of confocal microscopy images of neurons partially or fully enveloped by microglia. Scale bars: 100 μm (AD); 20 μm (EH); 5 μm (J).
Figure 5
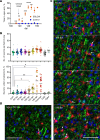
Figure 5. Time course of the envelopment.
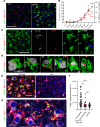
(A) The clinical onset of the disease in C57BL/6J mice infected with SSLOW via i.p. established using the EPM test. Mice were subjected to EPM sessions once per week starting from the preclinical stage. After the first training sessions (not shown), mice naturally acquired a strong preference for the closed arms. The clinical onset was defined as a time point, when the time on open arms consistently increased in comparison with the noninfected age-matched control group (shown by arrow). n = 5 for control; n = 14 for SSLOW until 119 dpi; *P < 0.05; **P < 0.01; ***P < 0.001; ****P < 0.0001, by Tukey’s multiple-comparison test. (B) Change in the total number of MAP2+ neurons (upper plot) and the percentage of MAP2+ neurons undergoing envelopment (lower plot) during disease progression. Ctrl1 and Ctrl2 are age-matched controls for 64 dpi and terminal, respectively. Aged 740-day-old mice. Colors represent different brains. Dots represent individual fields of view. Average values for each brain are shown as circles. n = 3–5 animals per time point. Means are marked by black lines. Comparison of means with Ctrl1 was performed by nonparametric Mann-Whitney U test. *P < 0.05; **P < 0.01. (C) Representative images of neuronal envelopment in the cerebral cortex of SSLOW-infected C57BL/6J mice collected at 92 dpi, 106 dpi, 122 dpi (disease onset), and 146 dpi. (D) Representative images of aged brains (740 days old). Staining with anti-IBA1 (red) and anti-MAP2 (green) antibodies. Arrows point at neurons undergoing envelopment. Scale bars: 50 μm.
Figure 6
Figure 6. Neurons undergoing envelopment lack apoptotic markers.
(AC) Coimmunostaining of SSLOW-infected C57BL/6J mice at the terminal stage (A and B) or C57BL/6J mice subjected to MCAO and analyzed 5 days after insult (C) using antibody to activated cCasp3 and anti-IBA1 antibody. (B) Confocal microscopy imaging illustrates the intracellular localization of cCasp3 (pointed by arrows) in microglia of SSLOW-infected mice. (D) Coimmunostaining of SSLOW-infected C57BL/6J mice using anti-cCasp3 and anti-NeuN antibodies. (E) Percentage of cCasp3+ microglia (IBA1) and neurons (NeuN) in cortexes of SSLOW-infected mice and in neurons of aged 607- to 740-day-old C57BL/6J mice. ***P < 0.001, Brown-Forsythe and Welch’s ANOVA followed by Dunnett’s T3 multiple-comparison tests. n = 6–7 fields of view. (F) TUNEL staining of SSLOW-infected C57BL/6J mouse at the terminal stage, and sections from the same mouse pretreated with DNase and used as positive controls. Dashed circular lines represent examples of neuronal envelopment. Scale bars: 50 μm (A, C, and D); 5 μm (B); 100 μm (F).
Figure 7
Figure 7. A decline in neuronal levels of Grin1 with disease progression.
(A) Confocal microscopy images of C57BL/6J mice infected with SSLOW via i.p. examined at 92 dpi and terminal stage (157–166 dpi) using anti-Grin1 (red), anti-NeuN (gray), and anti-IBA1(red) antibodies. (B) Quantification of Grin1 levels during disease progression. Colors represent different brains. Grin1 mean intensity values in individual neurons are shown as dots. Average values for each brain are shown as circles. Black lines mark time-point means. The time-point data were compared with Ctrl1 (age-matched controls for 64 dpi mice) by ordinary 1-way ANOVA followed by Dunnett’s multiple-comparison tests. *P < 0.05; ****P < 0.0001. n = 3–4 brains per time point. Age-matched control for terminal mice (Ctrl2) is provided as a reference. (C) Confocal microscopy 3D reconstruction images of individual neurons in age-matched control and SSLOW-infected C57BL/6J mice illustrating low Grin1 signal in neurons enveloped by microglia. Scale bars: 50 μm (A); 10 μm (C).
Figure 8
Figure 8. PrPSc colocalizes with reactive microglia.
(A) Quantification of PrPSc colocalization with MAP2+, GFAP+, and IBA1+ cells in SSLOW-infected C57BL/6J mice analyzed at the terminal stage. *P < 0.05; **P < 0.01 by Brown-Forsythe and Welch’s ANOVA followed by Dunnett’s T3 multiple-comparison tests.(B) Quantification of PrP immunoreactivity in SSLOW-infected and age-matched control C57BL/6J mice. Colors represent different brains. Dots represent individual values for field of view. Average values for each brain are shown as circles. Black lines mark group means. n = 3 animals per group. ***P < 0.001, unpaired t test with Welch’s correction. (CF) Representative images of SSLOW-infected C57BL/6J at the terminal stage (CE) and age-matched control mice (F) coimmunostained using anti-PrP (3D17) and anti-IBA1 (C and F), anti-MAP2 (D), or anti-GFAP antibodies (E). In C, dashed circles show neuronal envelopment; a gallery of images on the right shows PrPSc+ microglia that envelop neurons. (G and H) 3D reconstruction of confocal microscopy images of PrPSc+ microglia enveloping neurons in SSLOW-infected C57BL/6J mice at terminal stage. Staining using anti-PrP (SAF-84) (G and H), anti-IBA1 (G and H), and anti-MAP2 antibodies (H). Scale bars: 50 μm (CF); 5 μm (G and H).
Figure 9
Figure 9. Time course of PrPSc uptake, neuronal envelopment, and microglia proliferation.
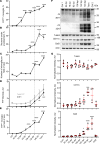
Changes in the percentage of PrPSc+ microglia (A), the percentage of MAP2+ neurons under envelopment (B), the total number of IBA1+ microglial cells per field of view (C), the amounts of total PrP (no PK treatment) and PrPSc (after PK treatment) as estimated by Western blot (D), and the total number of PrPSc+ microglia per field of view (E) in C57BL/6J mice infected with SSLOW via i.p. route with disease progression. Data are represented as mean ± SEM. Comparisons with Ctrl (combined age-matched controls for 64 dpi and terminal points) were done using Kruskal-Wallis test followed by Dunn’s multiple-comparisons test. *P < 0.05; **P < 0.01; ***P < 0.001; ****P < 0.0001. n = 18–63 fields of view (3–5 brains) per time point for B, and n = 17–60 (4–5 brains) for A, C, and E. Term, terminal animals collected at 157–166 dpi. Dashed line shows clinical onset. (F) Representative Western blots of total PrP (no PK treatment, -PK), PrPSc (after PK treatment, +PK), Tubb3, CD11b, and Gal3 in brains of SSLOW-infected C57BL/6J mice. PrP is detected by 3D17 antibody. (G) Quantification of Western blots of Tubb3, CD11b, and Gal3; signal intensities were normalized per intensities of actin for each individual Western blot. In F and G, Ctrl1 and Ctrl2 are age-matched controls for 64 dpi and terminal time points, respectively. Data are represented as means ± SD. n = 3–5 animals per group, *P < 0.05; ***P < 0.001; **** P < 0.0001; each time point was compared with the combined control group (Ctrl1 + Ctrl2) by Brown-Forsythe and Welch’s ANOVA followed by Dunnett’s T3 multiple-comparison tests.
Figure 10
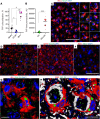
Figure 10. Microglia engaged in envelopment have activated hypertrophic lysosomes.
(A) Epifluorescence microscopy images of cortices of noninfected age-matched control and C57BL/6J mice infected with SSLOW via i.p route and examined at the terminal stage using anti–cathepsin D (red) and anti-IBA1 (green) antibodies. (B) Changes in the integrated density of cathepsin D associated with microglia (black) and the percentage of MAP2+ neurons undergoing envelopment (red) with disease progression. Data are represented as mean ± SEM. n = 11–63 fields of view (3–6 brains) per time point. Comparisons to Ctrl (age-matched control for 64 dpi and terminal points) were done using Kruskal-Wallis test followed by Dunn’s multiple-comparisons test. *P < 0.05; **P < 0.01; ***P < 0.001; ****P < 0.0001. Terminal animals collected at 157–166 dpi. (C and D) 3D reconstruction of confocal microscopy imaging of SSLOW-infected C57BL/6J mice illustrating colocalization of PrPSc (SAF-84, gray) with cathepsin D (red) in microglia (IBA1, green) (C) and envelopment of neurons (NeuN, gray) by cathepsin D–positive (red) microglia (IBA1, green) (D). (E) Maximum intensity projection confocal images of LAMP1+ compartments (green) in microglia (IBA1) in cortices of SSLOW-infected C57BL/6J mice analyzed at the terminal stage along with age-matched control mice. (F) Quantification of LAMP1 integrated density in individual microglial cells engaged or not engaged in neuronal envelopment in cortices of SSLOW-infected mice, and age-matched controls. n = 21–39 individual cells. **P < 0.01; ****P < 0.001, by Kruskal-Wallis test followed by Dunn’s multiple-comparisons test. (G) Confocal microscopy image of LAMP1+ compartments in cortices of SSLOW-infected C57BL/6J mice. Scale bars: 50 μm (A and C); 20 μm (G); 10 μm (D and G).
Figure 11
Figure 11. Analysis of neuronal envelopment in CD11b–/– mice.
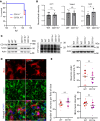
(A) Incubation time to terminal disease in CD11b–/– and C57BL/6J control mice (WT) inoculated with SSLOW via i.c. route. n = 10 animals per group. Mantel-Cox test of survival curves indicated no significant difference between the groups. (B) Densitometric quantification of Western blots for PrPSc, Tubb3, and Gal3 in SSLOW-infected CD11b–/– and WT mice. Data are represented as means ± SD. n = 6–10 per group. *P < 0.05, by 2-tailed, unpaired Student’s t test. (C) Representative Western blots of selected markers in CD11b–/– and WT mice at the terminal stage. For analysis of PrPSc, BHs were digested with PK and stained with 3D17 antibody. (D) Envelopment of neurons by microglia in the cortex of SSLOW-infected CD11b–/– and WT mice at the terminal stage stained using anti-IBA1 (red) and anti-MAP2 (green) antibodies. (E) Percentage of MAP2+ neurons undergoing envelopment, the total number of MAP2+ neurons, and IBA1 immunoreactivity in SSLOW-infected CD11b–/– and WT mice at terminal stages. n = 4 animals per group. Colors represent different brains. Dots represent individual values. Average values for each brain are shown as circles. Means are marked by black lines. Scale bar: 20 μm.
Figure 12
Figure 12. Partial envelopment by reactive microglia in sCJD.
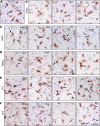
(A) Representative image of reactive microglia stained with anti-IBA1 antibody in the cortex (ctx) of 22L-infected C57BL/6J mice provided as a reference. (BF) Representative images of reactive microglia strained with anti-HLA-DR+DP+DQ (CR3/43) antibody in the following subtypes of sCJD: MV2K (B), MM1 (C), MM2C (D), VV1 (E), and VV2 (F). Fc, frontal cortex; thal, thalamus; str, striatum; mdb, midbrain; occ, occipital cortex; hipp, hippocampus; tc, temporal cortex. Arrows point at microglia engaged in envelopment. Scale bar: 20 μm.

Comment in

  • Supportive care or exhausted neglect: the role of microglia at the end stage of prion disease

References

    1. Stevens B, et al. The classical complement cascade mediates CNS synapse elimination. Cell. 2007;131(6):1164–1178. doi: 10.1016/j.cell.2007.10.036. - DOI - PubMed
    1. Schafer Dorothy P, et al. Microglia sculpt postnatal neural circuits in an activity and complement-dependent manner. Neuron. 2012;74(4):691–705. doi: 10.1016/j.neuron.2012.03.026. - DOI - PMC - PubMed
    1. Keren-Shaul H, et al. A unique microglia type associated with restricting development of Alzheimer’s Disease. Cell. 2017;169(7):1276–1290. doi: 10.1016/j.cell.2017.05.018. - DOI - PubMed
    1. Krasemann S, et al. The TREM2-APOE pathway drives the transcriptional phenotype of dysfunctional microglia in neurodegenerative diseases. Immunity. 2017;47(3):566–581. doi: 10.1016/j.immuni.2017.08.008. - DOI - PMC - PubMed
    1. Prater KE, et al. Human microglia show unique transcriptional changes in Alzheimer’s disease. Nat Aging. 2023;3(7):894–907. doi: 10.1038/s43587-023-00424-y. - DOI - PMC - PubMed