. 2024 Nov 22;9(22):e182087.
doi: 10.1172/jci.insight.182087.

Disruption of mitochondrial electron transport impairs urinary concentration via AMPK-dependent suppression of aquaporin 2

Affiliations

Disruption of mitochondrial electron transport impairs urinary concentration via AMPK-dependent suppression of aquaporin 2

Joshua S Carty et al. JCI Insight. .

Abstract

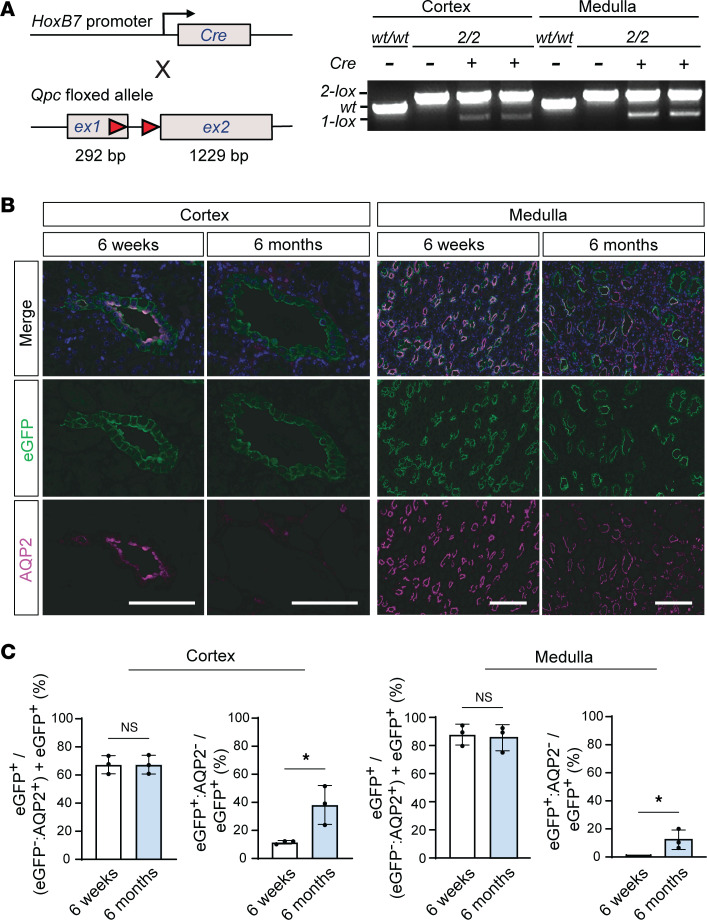
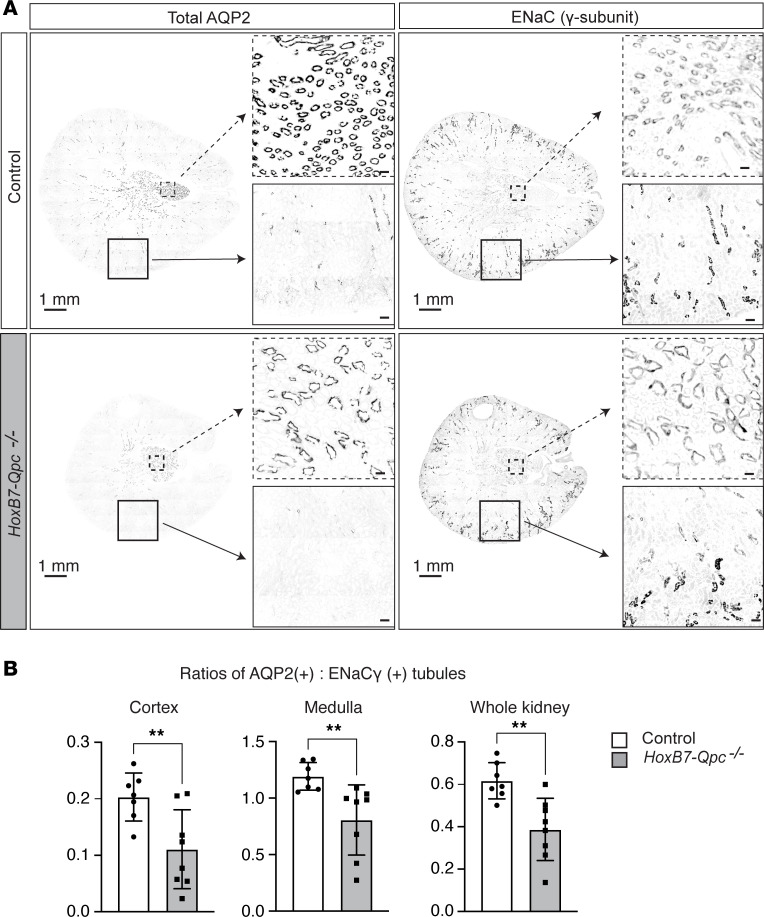
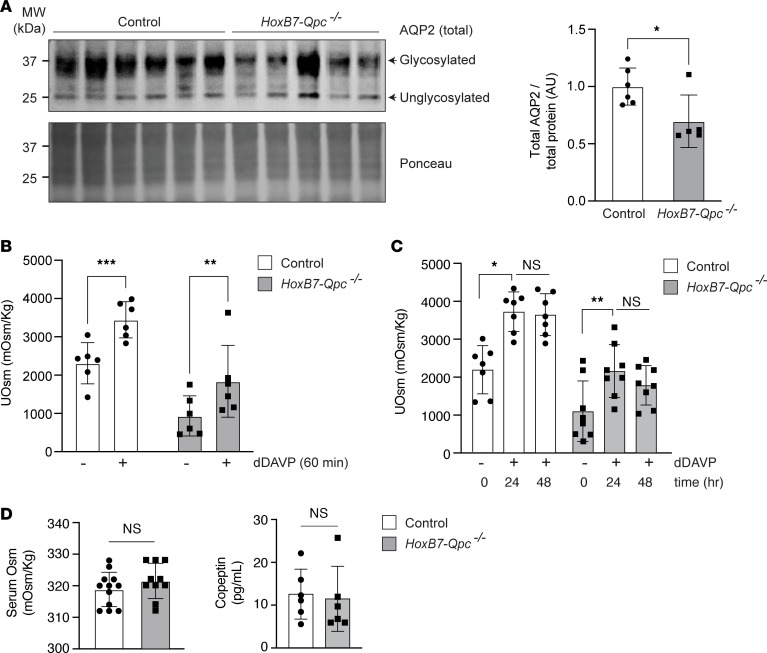
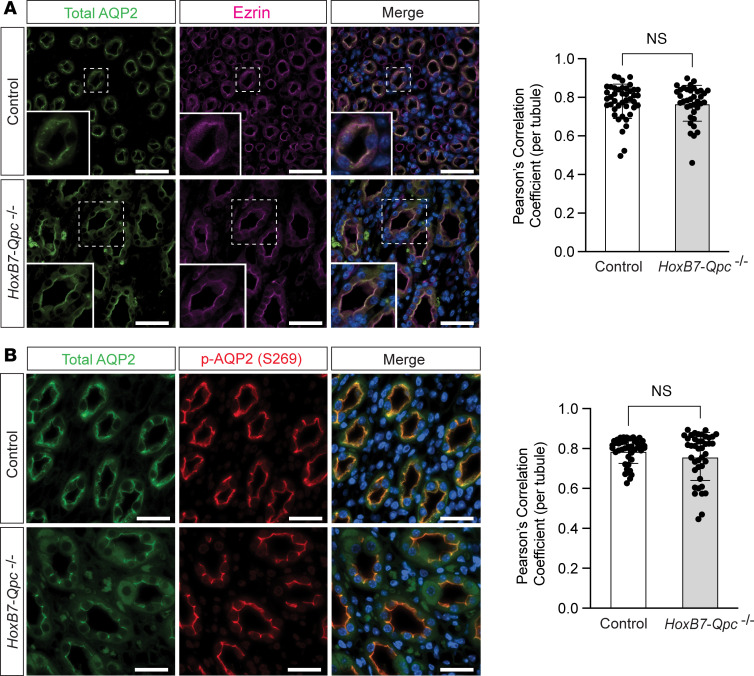
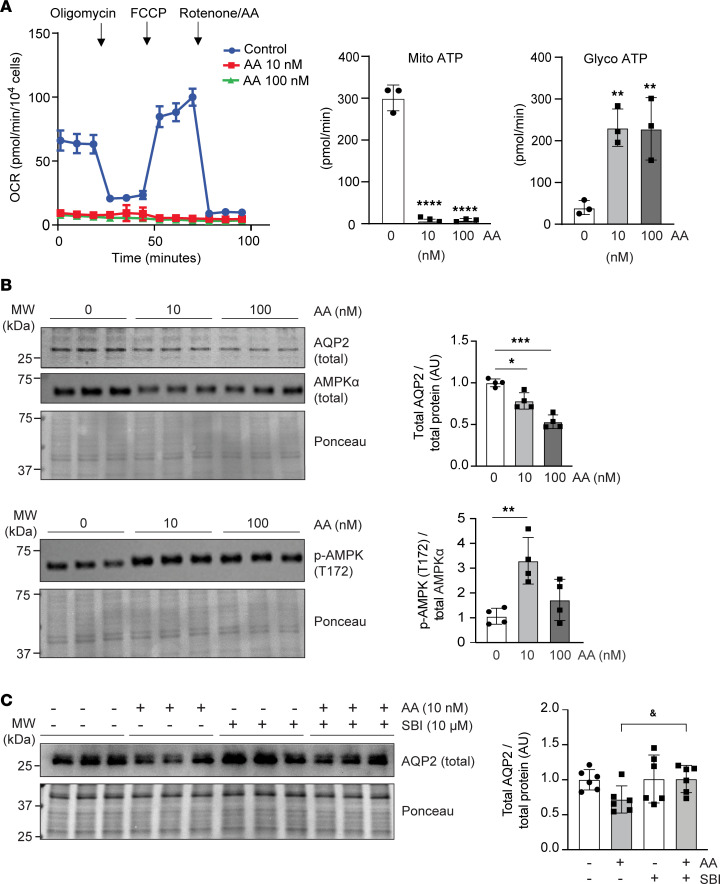
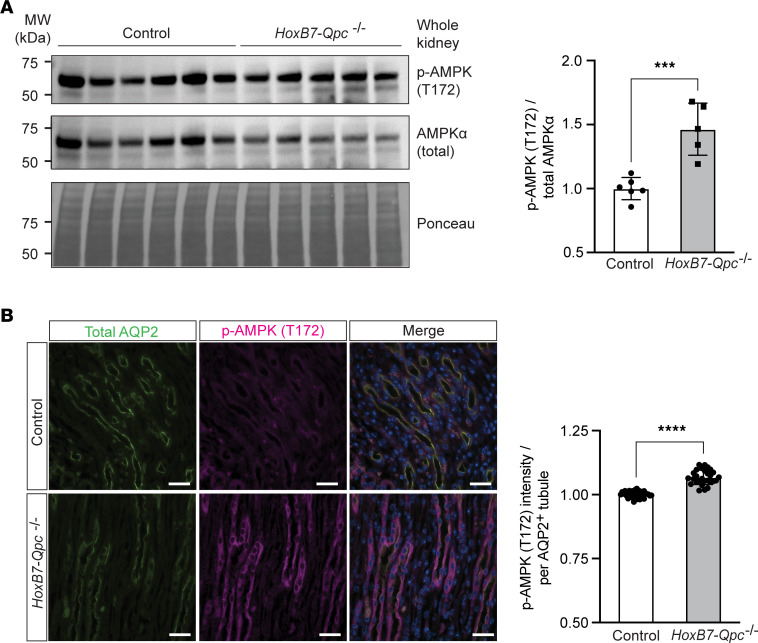
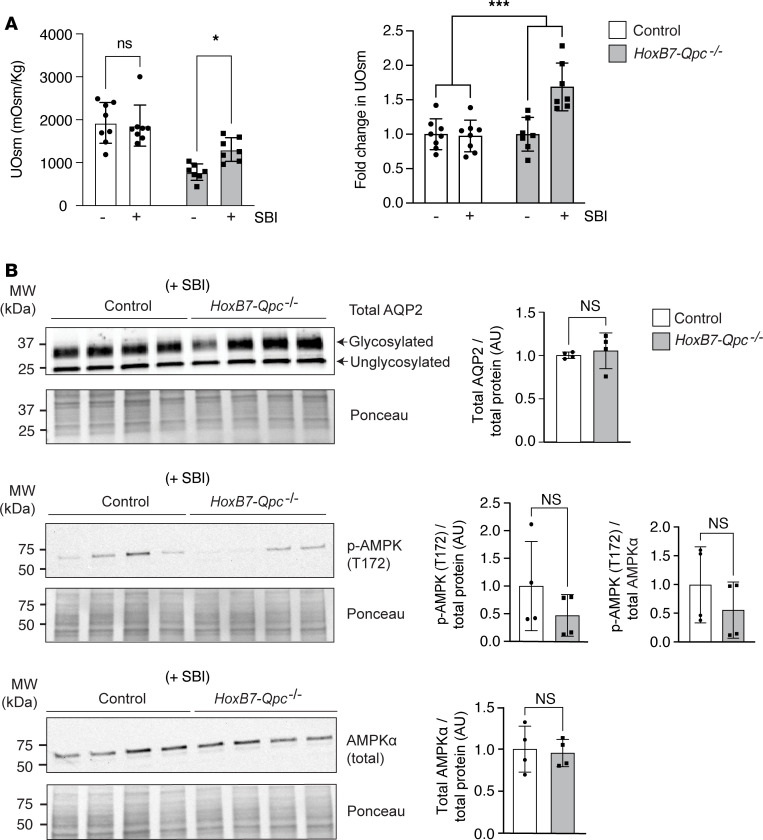
Urinary concentration is an energy-dependent process that minimizes body water loss by increasing aquaporin 2 (AQP2) expression in collecting duct (CD) principal cells. To investigate the role of mitochondrial (mt) ATP production in renal water clearance, we disrupted mt electron transport in CD cells by targeting ubiquinone (Q) binding protein QPC (UQCRQ), a subunit of mt complex III essential for oxidative phosphorylation. QPC-deficient mice produced less concentrated urine than controls, both at baseline and after type 2 vasopressin receptor stimulation with desmopressin. Impaired urinary concentration in QPC-deficient mice was associated with reduced total AQP2 protein levels in CD tubules, while AQP2 phosphorylation and membrane trafficking remained unaffected. In cultured inner medullary CD cells treated with mt complex III inhibitor antimycin A, the reduction in AQP2 abundance was associated with activation of 5' adenosine monophosphate-activated protein kinase (AMPK) and was reversed by treatment with AMPK inhibitor SBI-0206965. In summary, our studies demonstrated that the physiological regulation of AQP2 abundance in principal CD cells was dependent on mt electron transport. Furthermore, our data suggested that oxidative phosphorylation in CD cells was dispensable for maintaining water homeostasis under baseline conditions, but necessary for maximal stimulation of AQP2 expression and urinary concentration.

Keywords: Bioenergetics; Cell biology; Epithelial transport of ions and water; Mitochondria; Nephrology.


Figures

Figure 1
Figure 1. Efficient recombination of Qpc in HoxB7-Qpc–/– kidneys.
(A) Schematic illustrating the location of targeted DNA sequences within the conditional Qpc allele; loxP sites are depicted by red arrows. The sizes of the Qpc exons (ex) 1 and 2 are shown in base pairs (bp). PCR analysis of total genomic DNA isolated from kidney cortex and medulla of 12-week-old wild-type (wt), HoxB7-Qpc−/− mutants, and Cre littermate control mice. The genotype of mice is indicated by 2, representing the nonrecombined 2-lox allele and by 1, representing the recombined 1-lox allele; + or – indicates the presence or absence of the Cre transgene. (B) Representative images of immunofluorescent (IF) staining for aquaporin 2 (AQP2) and enhanced green fluorescent protein (eGFP) in formalin-fixed, paraffin-embedded kidney sections. Kidney tissues were obtained from 6-week- and 6-month-old HoxB7-mT/mG-Qpc−/− mice. (C) Quantification of eGFP+ and eGFP+AQP2 tubules in kidney cortex and medulla expressed as percentage of (eGFPAQP2+ + eGFP+) or total number of eGFP+ tubules, respectively; n =3, each. Percentages are represented as average mean values ± SD. *P < 0.05 by 2-tailed Student’s t test. NS, not significant. Scale bars: 100 μm. HoxB7, homeobox B7; Qpc, gene encoding ubiquinone-binding protein QPC.
Figure 2
Figure 2. AQP2-expressing tubules are reduced in HoxB7-Qpc–/– kidneys.
(A) Representative images of immunofluorescent staining for AQP2 and ENaC γ-subunit of whole horizontal kidney sections from Cre littermate control and HoxB7-Qpc–/– mice. Low- and high-power magnifications of representative tissue areas are shown by dashed boxes and unbroken line boxes, respectively. (B) Ratios of AQP2+ to ENaCγ+ tubules in cortex, medulla, or entire kidney cross section. For each kidney section, all tubules were counted: Cre littermate control (n = 7) and HoxB7-Qpc–/– mutants (n = 8). The ratio of AQP2+ to ENaCγ+ tubules was decreased in HoxB7-Qpc–/– mutants compared with controls. Data are represented as average mean values ± SD. **P < 0.01 by 2-tailed Student’s t test. Scale bars: 1 mm (whole kidney sections), 30 μm (low-power magnification), and 100 μm (high-power magnification). AQP2, aquaporin 2; ENaC, epithelial sodium channel.
Figure 3
Figure 3. Total AQP2 protein abundance and urine osmolality are decreased in HoxB7-Qpc–/– mice.
(A) Total aquaporin 2 (AQP2) in whole-kidney lysates from Cre littermate control and HoxB7-Qpc–/– mice. (B) Urine osmolality (UOsm) at baseline and following acute desmopressin (dDAVP) challenge in Cre littermate control and HoxB7-Qpc–/– mice; n = 6, each. (C) UOsm at baseline and after repeated dDAVP challenge in Cre littermate control and HoxB7-Qpc–/– mice; n = 7 and 8, respectively. (D) Serum Osm and copeptin levels at baseline in Cre littermate control and HoxB7-Qpc–/– mice; n = 12 and 10, respectively. Data are represented by mean values ± SD. *P < 0.05; **P < 0.01; ***P < 0.001 by 2-tailed Student’s t test (A and D) or 2-way ANOVA followed by Šidák’s multiple-comparison test (B and C). NS, not significant. The interaction between genotype and treatment was not significant in B or C. AU, arbitrary units.
Figure 4
Figure 4. AQP2 phosphorylation and membrane trafficking in HoxB7-Qpc–/– kidneys after dDAVP stimulation are comparable to controls.
(A) Representative immunofluorescent (IF) costaining for total AQP2 (green) and ezrin (magenta) and (B) IF costaining for total AQP2 (green) and p-AQP2 (S269) (red) in control and HoxB7-Qpc–/– kidneys following treatment of control and HoxB7-Qpc–/– mice with desmopressin (dDAVP). Graphs show Pearson’s correlation between relative normalized IF intensities per tubule for total AQP2 and ezrin IF staining intensity (A) or total AQP2 and p-AQP2 (S269) IF staining intensity (B) for Cre littermate control and HoxB7-Qpc–/– kidneys, respectively; n = 4 mice per group, 10 tubules per mouse. Nuclei (blue) were stained with DAPI (4′,6-diamidino-2-phenylindole). Data are represented as mean Pearson’s correlation coefficient per tubule ± SD and were evaluated with a 2-tailed Student’s t test. NS, not significant. Scale bars: 40 μm. AQP2, aquaporin 2.
Figure 5
Figure 5. Inhibition of mt complex III decreases AQP2 expression in cultured CD cells.
(A) Representative oxygen consumption rates (OCRs) in cultured mouse IMCD cells (3 replicates, repeated 3 times) treated with mt complex III inhibitor antimycin A (AA). Shown are the production rates of ATP generated from mitochondrial respiration (Mito ATP) or glycolysis (Glyco ATP) following sequential injections of oligomycin A and rotenone/AA; n = 3 for each treatment condition. (B) Quantification of total AQP2, total AMPKα, and p-AMPKα (T172) protein levels in mouse IMCD cells treated with AA by immunoblot; n = 4, each. (C) Quantification of total AQP2 protein levels in AA-treated IMCD cells following addition of AMPK inhibitor SBI-0206965 (SBI) to the culture medium; n = 6, each. Data are represented as average mean values ± SD. *P < 0.05; **P < 0.01; **P < 0.001; ***P < 0.001; ****P < 0.0001; &P = 0.0324 by 1-way ANOVA with Tukey’s post hoc analysis; for A, comparisons were made to control (0 nM). AMPK, 5′ adenosine monophosphate–activated protein kinase; AQP2, aquaporin 2; FCCP, carbonyl cyanide-p-trifluoromethoxy phenylhydrazone; IMCD, inner medullary collecting duct; veh, vehicle control; AU, arbitrary units.
Figure 6
Figure 6. AMPK phosphorylation at threonine 172 is increased in Qpc–/– CDs.
(A) Assessment of p-AMPKα (T172) and total AMPKα protein levels in whole-kidney lysates from HoxB7-Qpc–/– mice by immunoblot. Shown are the relative p-AMPKα (T172) to total AMPKα protein ratios for control (n = 6) and HoxB7-Qpc–/– mice (n = 5). (B) Representative IF images of medullary CDs stained for AQP2 (green) and p-AMPKα (magenta) in HoxB7-Qpc–/– kidneys. Nuclei (blue) were stained with DAPI. Shown are the relative normalized IF intensities for p-AMPKα (T172) staining in collecting duct tubules identified by AQP2 expression, n = 4 mice per group, 6–8 tubules per mouse. Data are represented as normalized means ± SD. ***P < 0.001, ****P < 0.0001 by 2-tailed Student’s t test. Scale bars: 10 μm. AMPK, 5′ adenosine monophosphate–activated protein kinase; AQP2, aquaporin 2.
Figure 7
Figure 7. AMPK inhibition increases urine osmolality in HoxB7-Qpc–/– mice.
(A) Urine osmolality (UOsm) at baseline and after challenge with AMPK inhibitor SBI-0206965 (SBI) in Cre littermate control and HoxB7-Qpc–/– mice; n = 7, each. (B) Total AQP2, p-AMPK (T172), and total AMPK protein levels in whole-kidney lysates from Cre littermate control and HoxB7-Qpc–/– mice following treatment with SBI-0206965; n = 4, each. Data are represented as average mean values ± SD. *P < 0.01; ***P < 0.001 by 2-way ANOVA followed by Šidák’s multiple-comparison test (A) or 2-tailed Student’s t test (B). NS, not significant. The interaction between genotype and SBI treatment was significant for A. AMPK, 5′ adenosine monophosphate–activated protein kinase; AQP2, aquaporin 2; AU, arbitrary units.

References

    1. Martinez-Reyes I, Chandel NS. Mitochondrial TCA cycle metabolites control physiology and disease. Nat Commun. 2020;11(1):102. doi: 10.1038/s41467-019-13668-3. - DOI - PMC - PubMed
    1. Guder WG, Ross BD. Enzyme distribution along the nephron. Kidney Int. 1984;26(2):101–111. doi: 10.1038/ki.1984.143. - DOI - PubMed
    1. Doke T, Susztak K. The multifaceted role of kidney tubule mitochondrial dysfunction in kidney disease development. Trends Cell Biol. 2022;32(10):841–853. doi: 10.1016/j.tcb.2022.03.012. - DOI - PMC - PubMed
    1. Wallace DC. A mitochondrial bioenergetic etiology of disease. J Clin Invest. 2013;123(4):1405–1412. doi: 10.1172/JCI61398. - DOI - PMC - PubMed
    1. Vercellino I, Sazanov LA. The assembly, regulation and function of the mitochondrial respiratory chain. Nat Rev Mol Cell Biol. 2022;23(2):141–161. doi: 10.1038/s41580-021-00415-0. - DOI - PubMed

MeSH terms

LinkOut - more resources