. 2024 Nov;11(44):e2405127.
doi: 10.1002/advs.202405127. Epub 2024 Oct 3.

SEC31a-ATG9a Interaction Mediates the Recruitment of COPII Vesicles for Autophagosome Formation

Affiliations

SEC31a-ATG9a Interaction Mediates the Recruitment of COPII Vesicles for Autophagosome Formation

Jiaming Nie et al. Adv Sci (Weinh). 2024 Nov.

Abstract

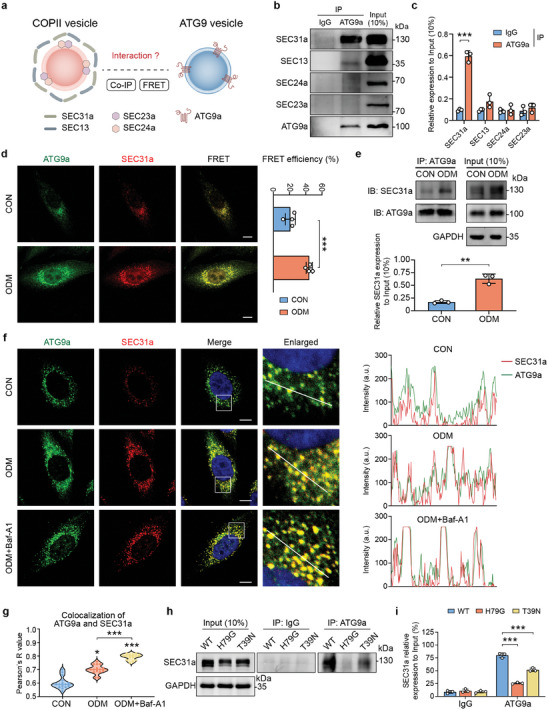
Autophagy plays an important role in determining stem-cell differentiation. During the osteogenic differentiation of mesenchymal stem cells (MSCs), autophagosome formation is upregulated but the reason is unknown. A long-standing quest in the autophagy field is to find the membrane origin of autophagosomes. In this study, cytoplasmic coat protein complex II (COPII) vesicles, endoplasmic reticulum-derived vesicles responsible for the transport of storage proteins to the Golgi, are demonstrated to be a critical source of osteoblastic autophagosomal membrane. A significant correlation between the number of COPII vesicle and the autophagy level is identified in the rat bone tissues. Disruption of COPII vesicles restrained osteogenesis and decreased the number and size of autophagosomes. SEC31a (an outer coat protein of COPII vesicle) is found to be vital to regulate COPII vesicle-dependent autophagosome formation via interacting with ATG9a of autophagosomal seed vesicles. The interference of Sec31a inhibited autophagosome formation and osteogenesis in vitro and in vivo. These results identified a novel mechanism of autophagosome formation in osteogenic differentiation of stem cells and identified SEC31a as a critical protein that mediates the interplay between COPII and ATG9a vesicles. These findings broaden the understanding of the regulatory mechanism in the osteogenic differentiation of MSCs.

Keywords: ATG9a; COPII vesicles; SEC31a; autophagosome formations; osteogenesis.


Conflict of interest statement

The authors declare no conflict of interest.

Figures

Figure 1
Figure 1
COPII vesicle amount is associated with autophagy level in rats bone tissue. a) Schematic representation of the rat development. The red boxes were used to map sample collection locations. E 17: embryonic day 17, E 19: embryonic day 19, P 1: postnatal day 1, P 3: postnatal day 3. b) Hematoxylin and eosin (H&E) staining of the right femur of rats at E17, E19, P1 and P3. Scale bars: 100 µm. c) Immunohistochemical staining of Sec24a and Sec31a of rat bone tissue. Scale bars: 50 µm and 20 µm, respectively. d) Immunohistochemical staining of LC3‐II and Beclin1 of rat bone tissue. Scale bars: 50 µm and 20 µm, respectively. e) Quantification of immunohistochemistry of Sec24a, Sec31a, LC3‐II and Beclin1 results. The color of the bubble represents immunohistochemical staining intensity and the size of the bubble represents the significance. f) The correlations between Sec24a‐LC3‐II, Sec24a‐Beclin1, Sec31a‐LC3‐II and Sec31a‐Beclin1 were indicated based on the relative immunohistochemical staining intensity. g) Schematic of the time course used for the in vivo experiments in rats with retinoic acid‐induced osteoporotic phenotypes (OP). h) H&E staining of rat right femur and quantitative analysis of bone volume/tissue volume (BV/TV). Scale bars: 50 µm. i) Immunohistochemical staining of Sec24a and Sec31a of bone tissue of the control group (CON) and the OP group. Black arrowheads represent Sec24a or Sec31a, respectively. Scale bars: 50 µm and 20 µm, respectively. j) Immunohistochemical staining of LC3‐II and Beclin1 of bone tissue of the CON group and the OP group. Black arrowheads represent LC3‐II or Beclin1, respectively. Scale bars: 50 µm and 20 µm, respectively. k) Quantification of immunohistochemistry of Sec24a, Sec31a, LC3‐II and Beclin1 results in the CON group and the OP group. l) The correlations between Sec24a‐LC3‐II, Sec24a‐Beclin1, Sec31a‐LC3‐II and Sec31a‐Beclin1 were indicated based on the relative immunohistochemical staining intensity of the CON group and the OP group. m) Three‐color immunofluorescence staining for Sec24a (Red), Osx (Green) and LC3‐II (Purple) expression of femurs from rats with or without osteoporosis. n) The correlation between Sec24a‐LC3‐II was indicated based on the immunofluorescence staining intensity. Scale bar: 20 µm (left) and 10 µm (right). ** P < 0.01; *** P < 0.001.
Figure 2
Figure 2
Disruption of COPII vesicle inhibits mineralization of BMSCs. a) Immunofluorescence of SEC24a and SEC31a of BMSCs in osteogenic differentiation medium (ODM). Scale bars: 20 µm. b) Quantification of the immunofluorescence signals of SEC24a and SEC31a from BMSCs in ODM. c) WB analysis and quantification showed the effect of osteogenic‐induction on the expression of SEC24a and SEC31a in BMSCs. d) Schematic representation of the disruption of COPII vesicles. e) Immunofluorescence of SEC24a and SEC31a of BMSCs transfected with H79G or T39N vector. Scale bars: 20 µm. f) Quantification of the immunofluorescence signals of SEC24a and SEC31a from BMSCs transfected with H79G or T39N vector. g) WB analysis and quantification showed the effect of COPII vesicle disruption on the expression of RUNX2, ALP and OSX. h) ALP staining and quantitative determination of ALP expression in BMSCs transfected with H79G or T39N vector for 7 days. i) Representative images and quantification of alizarin red staining showed the degree of alizarin red staining for mineral deposition on 21 days. * P < 0.05; ** P < 0.01; *** P < 0.001.
Figure 3
Figure 3
Disruption of COPII vesicle impairs autophagosome formation of BMSCs. a) The number of autophagosomes in the BMSCs transfected with H79G or T39N vector was detected by TEM. Scale bars: 2 µm. Red fingers illustrated typical autophagosomes. Scale bars: 1 µm. b) Quantification of the numbers of autophagic structures in BMSCs transfected with H79G or T39N vector under osteogenic condition. c) Quantification of average size of autophagic structure in BMSCs transfected with H79G or T39N vector under osteogenic condition. d) Immunofluorescence microscopy was performed to detect GFP‐LC3 and RFP‐LC3 puncta in BMSCs transfected with H79G or T39N vector under osteogenic condition. Scale bars: 10 µm. e) Quantification of autophagosomes (yellow dots) and autolysosomes (free red dots) in BMSCs transfected with H79G or T39N vector under osteogenic condition. f) WB analysis and quantification showed the effect of COPII vesicle disruption on the expression of BECLIN1 and LC3‐II. The ratio between LC3‐II and LC3‐I was calculated. g) Immunofluorescence staining for LC3 in BMSCs transfected with H79G or T39N vector under osteogenic condition with or without Baf‐A1. Scale bars: 20 µm. h) Quantification of LC3 puncta in BMSCs transfected with H79G or T39N vector under osteogenic condition with or without Baf‐A1. *** P < 0.001. ‡‡‡ P < 0.001 to Baf‐A1‐.
Figure 4
Figure 4
COPII vesicles function at the early stage of autophagosome formation. a) Schematic representation of the autophagy process. b‐f) Fluorescence confocal microscopy revealed the co‐localization of SEC31a and FIP200 b), ATG9a c), WIPI2 d), p62 e) and LAMP2 f) in BMSCs under osteogenic induction. Fluorescence intensity profiles along the white lines were showed on the right. Scale bars: 10 µm. g) Quantitation of SEC31a and autophagy‐related proteins co‐localization in BMSCs under osteogenic induction. * P < 0.05, ** P < 0.01, *** P < 0.001.
Figure 5
Figure 5
SEC31a interacts with ATG9a to regulate the autophagosome formation in BMSCs under osteogenic induction. a) Schematic illustration of experiment design. b) Co‐immunoprecipitation (Co‐IP) assay of the interaction between ATG9a and the coat proteins (SEC31a, SEC13, SEC24a and SEC23a) of COPII vesicles. Total proteins were immunoprecipitated with anti‐ATG9a beads. Input and IP proteins were analyzed by protein gel blot analysis with anti‐SEC31a, anti‐SEC13, anti‐SEC24a, anti‐SEC23a and anti‐ATG9a. c) Quantitation of COPII vesicles coat proteins interacted with ATG9a. d) Fluorescence resonance energy transfer (FRET) analyses. BMSCs with or without osteogenic induction treatment (ODM) were transfected with vectors encoding mClover‐ATG9a and mRuby‐SEC31a. The fluorescence images of mClover‐ATG9a (green), mRuby‐SEC31a (red), and merged images are shown. Scale bars: 10 µm. The efficiencies of FRET between the pair of ATG9a and SEC31a were analyzed. e) Co‐IP assay showing the interaction between SEC31a and ATG9a in BMSCs with or without osteogenic induction treatment (ODM). f) Fluorescence confocal microscopy revealed the co‐localization of SEC31a and ATG9a of BMSCs under osteogenic induction with or without Baf‐A1. Fluorescence intensity profiles along the white lines were showed on the right. Scale bars: 10 µm. g) The Pearson correlation was calculated for merged images to indicate the co‐localization between SEC31a and ATG9a. h) Co‐IP assay showed the effect of disruption of COPII vesicles on the interaction between SEC31a and ATG9a. i) Quantitation of the interaction between SEC31a and ATG9a in BMSCs transfected with H79G or T39N vectors. * P < 0.05, ** P < 0.01, *** P < 0.001.
Figure 6
Figure 6
ShSEC31a restrains autophagy and osteogenesis in BMSCs. a) Immunofluorescence microscopy was performed to detect GFP‐LC3 and RFP‐LC3 puncta in BMSCs transfected with shSEC31a with or without Baf‐A1. Fluorescence intensity profiles along the white lines were showed on the right. Scale bars: 10 µm. b) Quantification of autophagosomes (yellow dots) and autolysosomes (free red dots) in BMSCs transfected with shSEC31a with or without Baf‐A1. c) WB analysis and quantification showed the effect of shSEC31a on the expression of BECLIN1 and LC3‐II, and the ratio of LC3‐II/LC3‐I. d) Immunofluorescence staining for WIPI2 and FIP200 and quantification of WIPI2 and FIP200 puncta in BMSCs transfected with shSEC31a. Scale bars: 20 µm. e) WB analysis and quantification showed the effect of shSEC31a on the expression of RUNX2 and ALP. f) ALP staining and quantitative determination of ALP expression in BMSCs transfected with shSEC31a for 7 days. g) Representative images and quantification of alizarin red staining showed the degree of alizarin red staining for mineral deposition on 21 days. * P < 0.05; ** P < 0.01; *** P < 0.001.
Figure 7
Figure 7
Injection of shSec31a adenovirus into bone marrow cavity suppresses the mineralization of rat bone tissue. a) Schematic illustration of experiment design. b) Representative micro‐CT 3D images. Scale bars: 0.5 mm. c) Quantitative analysis of BV/TV, trabecular number (Tb. N), trabecular thickness (Tb. Th) and trabecular separation (Tb. Sp). d) Three‐color immunofluorescence staining for Sec31a (Red), LC3‐II (Purple) and Osx (Green)in rat femur with shNC or shSec31a injection, and quantitative immunofluorescence analysis. Scale bar: 20 µm. e,f) Immunohistochemical staining of osteogenic‐related proteins (Runx2, Opn and Osx (e)) and autophagy‐related proteins (Beclin1, LC3‐II and Atg9 (f)). Quantitative analysis of immunohistochemical staining intensity was shown on the right. Scale bars: 50 and 20 µm, respectively. *, P<0.05; **, P<0.01; ***, P<0.001.

References

    1. Nollet M., Santucci‐Darmanin S., Breuil V., Al‐Sahlanee R., Cros C., Topi M., Momier D., Samson M., Pagnotta S., Cailleteau L., Battaglia S., Farlay D., Dacquin R., Barois N., Jurdic P., Boivin G., Heymann D., Lafont F., Lu S., Dempster D. W., Carle G. F., Pierrefite‐Carle V., Autophagy 2014, 10, 1965. - PMC - PubMed
    1. Wang J., Zhang Y., Cao J., Wang Y., Anwar N., Zhang Z., Zhang D., Ma Y., Xiao Y., Xiao L., Wang X., Autophagy 2023, 19, 2409. - PMC - PubMed
    1. Liu F., Fang F., Yuan H., Yang D., Chen Y., Williams L., Goldstein S. A., Krebsbach P. H., Guan J., J. Bone Miner Res. 2013, 28, 2414. - PMC - PubMed
    1. Yin X., Zhou C., Li J., Liu R., Shi B., Yuan Q., Zou S., Bone Res. 2019, 7, 28. - PMC - PubMed
    1. Jaber F. A., Khan N. M., Ansari M. Y., Al‐Adlaan A. A., Hussein N. J., Safadi F. F., J. Cell. Physiol. 2019, 234, 12105. - PubMed

MeSH terms

LinkOut - more resources