. 2024 Oct 8;121(41):e2414618121.
doi: 10.1073/pnas.2414618121. Epub 2024 Oct 3.

Calcineurin-mediated dephosphorylation stabilizes E2F1 protein by suppressing binding of the FBXW7 ubiquitin ligase subunit

Affiliations

Calcineurin-mediated dephosphorylation stabilizes E2F1 protein by suppressing binding of the FBXW7 ubiquitin ligase subunit

Yuki Sato et al. Proc Natl Acad Sci U S A. .

Abstract

The transcription factor E2F1 serves as a regulator of the cell cycle and promotes cell proliferation. It is highly expressed in cancer tissues and contributes to their malignant transformation. Degradation by the ubiquitin-proteasome system may help to prevent such overexpression of E2F1 and thereby to suppress carcinogenesis. A detailed understanding of the mechanisms underlying E2F1 degradation may therefore inform the development of new cancer treatments. We here identified SCFFBXW7 as a ubiquitin ligase for E2F1 by comprehensive analysis. We found that phosphorylation of E2F1 at serine-403 promotes its binding to FBXW7 (F-box/WD repeat-containing protein 7) followed by its ubiquitination and degradation. Furthermore, calcineurin, a Ca2+/calmodulin-dependent serine-threonine phosphatase, was shown to stabilize E2F1 by mediating its dephosphorylation at serine-403 and thereby preventing FBXW7 binding. Treatment of cells with Ca2+ channel blockers resulted in downregulation of both E2F1 protein and the expression of E2F1 target genes, whereas treatment with the Ca2+ ionophore ionomycin induced upregulation of E2F1. Finally, the calcineurin inhibitor FK506 attenuated xenograft tumor growth in mice in association with downregulation of E2F1 in the tumor tissue. Impairment of the balance between the opposing actions of FBXW7 and calcineurin in the regulation of E2F1 abundance may therefore play an important role in carcinogenesis.

Keywords: E2F1; FBXW7; calcium; dephosphorylation; protein stability.


Conflict of interest statement

Competing interests statement:The authors declare no competing interest.

Figures

Fig. 1.
Fig. 1.
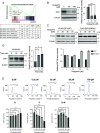
Identification of FBXW7 as a potential determinant of E2F1 expression in human cancer. (A) Expression of E2F1 in human cancer versus corresponding normal tissues as determined from RNA-seq data in TNMplot. Data are expressed as log2[fold change (FC)], with the asterisks indicating a P value of <0.01 (Mann–Whitney U test). (B) Relapse-free survival for individuals with breast cancer according to the median expression level of E2F1 in Kaplan–Meier plotter (204947_at). The HR with its 95% CI and the log-rank P value are shown. (C) Screening for genes that might contribute to the regulation of E2F1 protein abundance in breast carcinoma (BRCA). (D) Expression of FBXW7 analyzed as in A. (E) Relapse-free survival for individuals with breast cancer according to the median expression level of FBXW7 (229419_at) was determined as in B.
Fig. 2.
Fig. 2.
FBXW7 ubiquitinates and induces the degradation of E2F1. (A) MCF7 cells stably expressing FLAG-tagged mouse FBXW7 or infected with the corresponding empty lentivirus (Vec) were subjected to immunoblot analysis with antibodies to the indicated proteins. A representative blot (the arrow indicates immunoreactive bands) as well as the E2F1/β-actin band intensity ratio from three independent experiments are shown. OE, overexpression. (B) Immunoblot analysis of MCF7 cells transiently transfected with the indicated amounts of an expression vector for FLAG-tagged FBXW7. The relative FBXW7/β-actin and E2F1/β-actin band intensity ratios are indicated below each lane. (C and D) Immunoblot analysis of MCF7 cells (C) or HCT116 cells (D) infected with lentiviruses encoding control (shControl) or FBXW7 (shFBXW7) shRNAs and then cultured in the presence of Dox to induce shRNA expression. Representative blots as well as the E2F1/β-actin band intensity ratio from three independent experiments are shown. (E) Immunoblot analysis of MCF7 cells stably expressing FLAG-tagged FBXW7 (WT or ΔF mutant) or infected with the corresponding empty lentivirus (Vector). A representative blot as well as the E2F1/β-actin band intensity ratio from four independent experiments are shown. (F) Immunoblot analysis of HCT116 cells stably expressing shControl or shFBXW7 and transiently transfected with an expression vector for FLAG-tagged FBXW7(WT) or the corresponding empty vector (Vec). A representative blot as well as the E2F1/β-actin band intensity ratio from four independent experiments are shown. (G) In vitro ubiquitination assay for FLAG-tagged human E2F1 performed with SCFFBXW7 and the indicated reaction components. The reaction mixtures were subjected to immunoblot analysis with antibodies to E2F1, and the corresponding Coomassie brilliant blue–stained gel is also shown. (H) In vitro ubiquitination assay performed with SCF complexes containing FLAG-tagged WT or ΔF mutant forms of FBXW7 and with or without FLAG-E2F1 as substrate.
Fig. 3.
Fig. 3.
FBXW7 recognizes E2F1 phosphorylated at Ser403 and thereby promotes its degradation. (A) Domain structure of human E2F1 showing potential phosphorylation sites for targeting by FBXW7. (B) Lysates of HEK293T cells transiently transfected with expression vectors for WT, S403A, or 5A forms of FLAG-tagged human E2F1 were incubated with or without BAP and then subjected to immunoblot analysis with antibodies to FLAG or to Hsp90 (loading control). Samples before reacting at 37 °C were denoted as Pre. (C) Immunoblot analysis of endogenous E2F1 in HEK293T cell lysates treated with BAP as in B. (D) Immunoblot analysis of HEK293T cells transiently transfected with expression vectors for FLAG-tagged WT, S307A, T311A, S332A, S337A, or S403A forms of E2F1 (Vec indicates empty vector). The relative FLAG/β-actin band intensity ratio is indicated below each lane. (E) HEK293T cells transiently expressing V5 epitope–tagged FBXW7 and FLAG-tagged E2F1 (WT or S403A) were subjected to immunoprecipitation (IP) with anti-FLAG M2 affinity gel, and the resulting immunoprecipitates as well as the original cell lysates (Input) were subjected to immunoblot analysis with antibodies to FBXW7, to FLAG, and to the phospho-Ser/phospho-Thr–Pro motif. The relative FBXW7/FLAG band intensity ratio for immunoprecipitates is shown below each lane. (F) HEK293T cells transiently expressing hemagglutinin epitope (HA)–tagged ubiquitin as well as FLAG-tagged WT, S403A, or 5A forms of E2F1 were incubated with 10 µM MG132 for 8 h and then subjected to immunoprecipitation with anti-FLAG M2 affinity gel under denaturing conditions. The resulting immunoprecipitates as well as the original cell lysates were subjected to immunoblot analysis. A representative blot as well as the ubiquitin (Ub)/FLAG band intensity ratio determined from three independent experiments are shown. (G) Immunoblot analysis of HEK293T cells transiently expressing FLAG-tagged E2F1 (WT or S403A) and treated with CHX (0.5 mg/ml) for the indicated times.
Fig. 4.
Fig. 4.
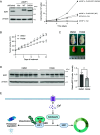
Calcineurin increases E2F1 stability through dephosphorylation at Ser403. (A) In vitro phosphatase assay for dephosphorylation of FLAG-tagged human E2F1 immunoprecipitates prepared from transfected HEK293T cells on incubation with or without (Cont) recombinant human calcineurin Aα (Can Aα) and calmodulin. The reaction mixtures collected at the indicated times of incubation were subjected to immunoblot analysis with antibodies to FLAG. The intensities of the upper, middle, and lower FLAG-E2F1 bands are shown below the representative blot. (B) In vitro phosphatase assay for dephosphorylation of FLAG-tagged E2F1 during incubation with or without (Cont) His6-FLAG–tagged calcineurin Aα (WT, H151Q, or ΔCD) and calmodulin for 4 h. Reaction mixtures were subjected to immunoblot analysis with antibodies to E2F1 or to FLAG. (C) In vitro phosphatase assay for dephosphorylation of FLAG-tagged E2F1 (WT or S403A) during incubation with or without (Cont) recombinant calcineurin Aα and calmodulin for 2 h. A representative blot as well the intensities of the upper, middle, and lower FLAG-E2F1 bands are shown. (D) HEK293T cells transiently transfected with an expression vector for FLAG-E2F1 or with the corresponding empty vector (Vec) were subjected to immunoprecipitation with anti-FLAG M2 affinity gel or antibodies to calcineurin Aα, and the resulting precipitates as well as the original cell lysates (Input) were subjected to immunoblot analysis. (E) Immunoblot analysis of MCF7 cells stably expressing two independent calcineurin Aα shRNAs (shCaN Aα 1 or 2) or a luciferase shRNA (shCont). A representative blot and the E2F1/β-actin band intensity ratio from three independent experiments are shown. (F and G) Immunoblot analysis of single cell–derived MCF7 (F) or HCT116 (G) cells stably expressing HA-tagged human calcineurin Aα (WT or H151Q) in the context of calcineurin Aα knockdown.
Fig. 5.
Fig. 5.
E2F1 target genes are down-regulated by calcineurin depletion. (A) Heat map for hallmark gene sets of MSigDB with the 20 lowest P values identified by parametric GSEA from publicly available RNA-seq data for MCF7 cells stably expressing calcineurin Aα (CaN Aα) or control shRNAs (DRA011729). (B) Volcano plot showing differentially expressed genes identified by RNA-seq analysis of the calcineurin-depleted versus control MCF7 cells. Hallmark E2F target genes are shown as red points. FC, fold change; Padj, adjusted P value. (CE) GSEA plots for the indicated gene sets of MSigDB and the calcineurin-depleted and control cells. NES, normalized enrichment score; FDR, false discovery rate. (F) RT-qPCR analysis of E2F1 target gene expression in calcineurin-depleted and control MCF7 cells.
Fig. 6.
Fig. 6.
Calcineurin depletion induces downregulation of E2F1 in an FBXW7-dependent manner. (A) Immunoblot analysis of MCF7 cells stably expressing calcineurin Aα or luciferase (shControl) shRNAs and treated with 0.5 μM MLN4924 for the indicated times. The relative E2F1/β-actin band intensity ratio is shown below each lane. (B) Immunoblot analysis of MCF7 cells stably expressing the indicated shRNAs. (C) HEK293T cells transiently transfected with an expression vector for FLAG-tagged human E2F1 or the corresponding empty vector (Vec) were treated with MG132 (10 μM) and with or without FK506 (12.5 µM) for 8 h, after which the ubiquitination of FLAG-E2F1 was examined under denaturing conditions. A representative blot as well as the ubiquitin (Ub)/FLAG band intensity ratio for FLAG-E2F1 determined from three independent experiments are shown. (D) Immunoblot analysis of HCT116 cells stably expressing the indicated shRNAs and treated with CHX (0.1 mg/ml) for the indicated times. Representative blots as well as the E2F1/β-actin band intensity ratio from three independent experiments are shown, as are separate blots confirming the depletion of calcineurin Aα and FBXW7 by the corresponding shRNAs.
Fig. 7.
Fig. 7.
Calcium signaling regulates E2F1 abundance. (A) GSEA plot for E2F target genes from publicly available RNA-seq data from amlodipine-treated and control A549 cells (GSE159522). The table shows the top-ranked down-regulated Hallmark gene sets identified by GSEA. NOM, nominal. (B) Immunoblot analysis of MCF7 cells treated with the indicated concentrations of verapamil for 22 h. A representative blot and the E2F1/β-actin band intensity ratio determined from four independent experiments are shown. (C) Immunoblot analysis of MCF7 cells transiently expressing FLAG-tagged human E2F1 (WT or S403A) and treated with the indicated concentrations of verapamil for 9.5 h. A representative blot (Top) and the E2F1/β-actin band intensity ratio from two independent experiments (Bottom) are shown. (D) Immunoblot analysis of MCF7 cells treated with 1 μM ionomycin for the indicated times. A representative blot and the E2F1/β-actin band intensity ratio from three independent experiments are shown. (E) Flow cytometric analysis of cell cycle profiles for MCF7 cells treated with the indicated concentrations of verapamil for 22 h. The upper traces show cell counts in each phase as represented by propidium iodide fluorescence intensity. The lower histograms show the proportion of cells in each phase of the cell cycle determined from three independent experiments.
Fig. 8.
Fig. 8.
Inhibition of calcineurin down-regulates E2F1 and attenuates tumor growth in vivo. (A) Single cell–derived MCF7 cells stably expressing FLAG-tagged human E2F1 (WT or S403A) or corresponding empty vector (Vec) were transfected with a stably expression vector for shControl or E2F1 shRNAs. The cells were subjected to immunoblot analysis with antibodies to E2F1 (Left) as well as cultured for the indicated times for determination of cell number (Right). Data for cell number are means ± SEM from three independent experiments. (B–D) HT29 cells were transplanted into the flank of NOD/Shi-SCID mice, which were subsequently injected intraperitoneally with DMSO (vehicle) or FK506 (3 mg/kg per day). Tumor size was measured with a digital caliper every other day (B), and the tumors were excised (C) and subjected to immunoblot analysis of E2F1 (D) after treatment for 3 wk. Each lane of the blot represents one mouse, and the E2F1/β-actin band intensity ratio for the six or five mice treated with DMSO or FK506, respectively, is also shown. (E) Model for the regulation of E2F1 stability. Calcineurin-mediated dephosphorylation stabilizes the E2F1 protein by preventing the binding of FBXW7. Ub, ubiquitin; P, phosphorylation.

References

    1. Yao H., Lu F., Shao Y., The E2F family as potential biomarkers and therapeutic targets in colon cancer. PeerJ 8, e8562 (2020). - PMC - PubMed
    1. Fang Z., Lin M., Li C., Liu H., Gong C., A comprehensive review of the roles of E2F1 in colon cancer. Am. J. Cancer Res. 10, 757–768 (2020). - PMC - PubMed
    1. Gorgoulis V. G., et al. , Transcription factor E2F–1 acts as a growth-promoting factor and is associated with adverse prognosis in non-small cell lung carcinomas. J. Pathol. 198, 142–156 (2002). - PubMed
    1. Han S., et al. , E2F1 expression is related with the poor survival of lymph node-positive breast cancer patients treated with fluorouracil, doxorubicin and cyclophosphamide. Breast Cancer Res. Treat 82, 11–16 (2003). - PubMed
    1. Dubrez L., Regulation of E2F1 transcription factor by ubiquitin conjugation. Int. J. Mol. Sci. 18, 2188 (2017). - PMC - PubMed

LinkOut - more resources