. 2024 Oct 8;121(41):e2405001121.
doi: 10.1073/pnas.2405001121. Epub 2024 Oct 3.

Enhancer landscape of lung neuroendocrine tumors reveals regulatory and developmental signatures with potential theranostic implications

Affiliations

Enhancer landscape of lung neuroendocrine tumors reveals regulatory and developmental signatures with potential theranostic implications

Ester Davis et al. Proc Natl Acad Sci U S A. .

Abstract

Well-differentiated low-grade lung neuroendocrine tumors (lung carcinoids or LNETs) are histopathologically classified as typical and atypical LNETs, but each subtype is still heterogeneous at both the molecular level and its clinical manifestation. Here, we report genome-wide profiles of primary LNETs' cis-regulatory elements by H3K27ac ChIP-seq with matching RNA-seq profiles. Analysis of these regulatory landscapes revealed three regulatory subtypes, independent of the typical/atypical classification. We identified unique differentiation signals that delineate each subtype. The "proneuronal" subtype emerges under the influence of ASCL1, SOX4, and TCF4 transcription factors, embodying a pronounced proneuronal signature. The "luminal-like" subtype is characterized by gain of acetylation at markers of luminal cells and GATA2 activation and loss of LRP5 and OTP. The "HNF+" subtype is characterized by a robust enhancer landscape driven by HNF1A, HNF4A, and FOXA3, with notable acetylation and expression of FGF signaling genes, especially FGFR3 and FGFR4, pivotal components of the FGF pathway. Our findings not only deepen the understanding of LNETs' regulatory and developmental diversity but also spotlight the HNF+ subtype's reliance on FGFR signaling. We demonstrate that targeting this pathway with FGF inhibitors curtails tumor growth both in vitro and in xenograft models, unveiling a potential vulnerability and paving the way for targeted therapies. Overall, our work provides an important resource for studying LNETs to reveal regulatory networks, differentiation signals, and therapeutically relevant dependencies.

Keywords: FGFR signaling; enhancers; epigenomics; neuroendocrine tumors; pulmonary carcinoids.


Conflict of interest statement

Competing interests statement:The authors declare no competing interest.

Figures

Fig. 1.
Fig. 1.
Regulatory and developmental subtypes of LNETs. (A) Pairwise Spearman correlations of H3K27ac signals at distal regulatory elements across lung, pancreatic, and ileal neuroendocrine tumors demonstrate high heterogeneity between LNET clusters (B) Pairwise Spearman correlations of H3K27ac signals at distal regulatory elements in 23 LNETs suggest three possible regulatory subtypes. Tumors in the first cluster (termed proneural LNETs) are marked in red, second cluster (termed HNF+ LNETs) marked in green, and the third cluster (termed luminal-like LNETs) in blue. (C) Significance (log10 scale, Wald’s test) and log2 fold differences in H3K27ac ChIP-seq signals in HNF+ and proneural LNETs, calculated by DESeq2 comparison of 19 biologically independent tumors. Each dot represents an individual site (black: FDR < 0.01). Selected H3K27ac peaks are marked by the red circle (higher in proneural) or green circle (higher in HNF+) and annotated by the nearest gene. (D) Percentage of proneural and HNF+-specific H3K27ac peaks with binding sites for HNF1A, HNF4A, FOXA3, ASCL1, and TCF4. HNF+-specific peaks are strongly enriched with HNF1A, HNF4A, and FOXA3 binding sites. (E) Heat map showing normalized acetylation levels at the union set of enhancers across all LNET samples. Enhancers are clustered by k-means clustering, bars on the left represent the 6 clusters. Sample names are on top, proneural LNETs are colored red, HNF+ LNETs in green, and luminal-like LNETs in blue. T9 is an outlier that could not be classified, potentially due to lower ChIP quality. Top enriched motifs in each cluster are shown on the right. Enhancer cluster 5 is common to all tumors. Proneural tumors are also positive for clusters 2 and 4, HNF+ for clusters 1 and 2, and luminal-like tumors for clusters 1 and 3.
Fig. 2.
Fig. 2.
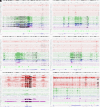
HNF1A, HNF4A, FGFR3, and FGFR4 demonstrate strong enhancer acetylation and expression specifically at HNF+ LNETs, while the ASCL1 and EGFR loci are preferentially acetylated in proneural LNETs. (AF) Genomic view of the (A) HNF1A, (B) HNF4A, (C) FGFR3, (D) FGFR4, (E) ASCL1, and (F) EGFR loci, showing RNA signal (black) and H3K27ac signals of proneural (red), HNF+ (green), and luminal-like (blue) LNETs, as well as the NCI-H727, NCI-H1770, and NCI-H835 lung neuroendocrine neoplasm cell lines (purple). Hepatic factors (HNF1A, HNF4A, and FOXA3) ChIP-seq tracks in HepG2 cells are shown in light green and proneural transcription factors (ASCL1 and TCF4) ChIP-seq tracks in neuroblastoma cells in light red. RNA-seq signals are normalized to 5 bins per million mapped reads (BPM). H3K27ac signals are scaled by promoter-based DESeq2 normalization (Materials and Methods). Multiple HNF1, HNF4, and FOXA3 binding sites are found at FGFR3 and FGFR4 enhancers and promoters, suggesting that FGFR expression is downstream of hepatic factors activation.
Fig. 3.
Fig. 3.
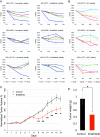
Erdafitinib significantly slows tumor growth. (A) Relative cell line viability as measured by WST-1 assay of NCI-H727, NCI-H835, and NCI-H1770 lines during treatment with lenvatinib (Left) or erdafitinib (Right). Values represent the ratio between the viability of treated cells and of control cells treated with DMSO. Error bars represent the SEM. (B) Relative cell line viability as measured by WST-1 assay of the NCI-H727, NCI-H835, and NCI-H1770 during treatment with A51. Values represent the ratio between viability of treated cells and of control cells treated with DMSO. Error bars represent the SEM. (C) Normalized tumor volume of NCI-H727 mouse xenograft model treated with erdafitinib (12.5 mg/kg, orange) or 1%Tween in PBS control (black). Error bars represent the SEM. P-values are calculated by the one-tailed t test, *P < 0.05 and **P < 0.01. (D) Average tumor weight of the PBS control group (black) and erdafitinib-treated group (orange) at the end of the experiment after mice were killed. Error bars represent the SEM. P-values were calculated by the one-tailed t test, *P < 0.05.

References

    1. Travis W. D., et al. , Survival analysis of 200 pulmonary neuroendocrine tumors with clarification of criteria for atypical carcinoid and its separation from typical carcinoid. Am. J. Surg. Pathol. 22, 934 (1998). - PubMed
    1. Swarts D. R. A., et al. , Deletions of 11q22.3-q25 are associated with atypical lung carcinoids and poor clinical outcome. Am. J. Pathol. 179, 1129–1137 (2011). - PMC - PubMed
    1. Fernandez-Cuesta L., et al. , Frequent mutations in chromatin-remodelling genes in pulmonary carcinoids. Nat. Commun. 5, 3518 (2014). - PMC - PubMed
    1. Vesterinen T., et al. , PD-1 and PD-L1 expression in pulmonary carcinoid tumors and their association to tumor spread. Endocr. Connect. 8, 1168–1175 (2019). - PMC - PubMed
    1. Zhou V. W., Goren A., Bernstein B. E., Charting histone modifications and the functional organization of mammalian genomes. Nat. Rev. Genet. 12, 7–18 (2011). - PubMed