. 2024 Oct 8;121(41):e2413241121.
doi: 10.1073/pnas.2413241121. Epub 2024 Oct 3.

Intestinal Lactobacillus murinus-derived small RNAs target porcine polyamine metabolism

Affiliations

Intestinal Lactobacillus murinus-derived small RNAs target porcine polyamine metabolism

Lijuan Fan et al. Proc Natl Acad Sci U S A. .

Abstract

Gut microbiota plays a vital role in host metabolism; however, the influence of gut microbes on polyamine metabolism is unknown. Here, we found germ-free models possess elevated polyamine levels in the colon. Mechanistically, intestinal Lactobacillus murinus-derived small RNAs in extracellular vesicles down-regulate host polyamine metabolism by targeting the expression of enzymes in polyamine metabolism. In addition, Lactobacillus murinus delays recovery of dextran sodium sulfate-induced colitis by reducing polyamine levels in mice. Notably, a decline in the abundance of small RNAs was observed in the colon of mice with colorectal cancer (CRC) and human CRC specimens, accompanied by elevated polyamine levels. Collectively, our study identifies a specific underlying mechanism used by intestinal microbiota to modulate host polyamine metabolism, which provides potential intervention for the treatment of polyamine-associated diseases.

Keywords: CRC; Lactobacillus murinus; colitis; polyamine metabolism; small RNAs.


Conflict of interest statement

Competing interests statement:The authors declare no competing interest.

Figures

Fig. 1.
Fig. 1.
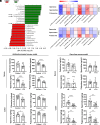
Gut microbiota is involved in host polyamine metabolism. (A) The level of putrescine, spermidine, spermine, and polyamines in the serum, jejunum, ileum, cecum, and colon of FMT and GF pigs (n = 7 to 13). (BD) The level of putrescine, spermidine, spermine, and polyamines in the serum (B), duodenum (C), and colon (D) of SPF and GF mice (n = 14 to 20). (E) mRNA expression of ODC1, AMD1, and SRM in the colon of SPF and GF mice (n = 4). (F) Protein abundance of ODC1 and AMD1 in the colon of SPF and GF mice (n = 4). Data were analyzed by unpaired t test or Mann–Whitney U test [A: Colon (Polyamines), B: Putrescine, Spermidine, Spermine, Polyamines, C: Spermine, D: Putrescine, Spermine] and represented as mean ± SD (AD, F) or SEM (E). *P < 0.05; **P < 0.01; ***P < 0.001; ****P < 0.0001.
Fig. 2.
Fig. 2.
Colistin-induced alteration of gut microbiota is linked to polyamine metabolism. (A) A schematic diagram of the antibiotic-treated mouse model. (B and C) The level of putrescine, spermidine, spermine, and polyamines in the serum (B) and colon (C) of control and antibiotic-treated mice (n = 8 to 12). (D) Real-time RT-PCR analysis of ODC1, AMD1, and SRM mRNA expression in the colon of control and colistin-treated mice (n = 9 to 12). (E) Protein abundance of ODC1 and AMD1 in the colon of control and colistin-treated mice (n = 4 to 5). Data were analyzed by unpaired t test or Mann–Whitney U test (B Putrescine: Colistin; B Spermidine: Vancomycin; B Spermine: Neomycin, ampicillin, metronidazole, colistin or vancomycin; B Polyamines: Vancomycin; C Putrescine: Neomycin, ampicillin, metronidazole, colistin, or vancomycin; C Spermidine: Neomycin, ampicillin, metronidazole, colistin, or vancomycin; C Spermine: Neomycin, ampicillin, metronidazole, colistin, or vancomycin; C Polyamines: Neomycin, ampicillin, metronidazole, colistin, or vancomycin; D: ODC1, E: AMD1) and represented as mean ± SD (B, C, and E) or SEM (D). *P < 0.05; **P < 0.01; ***P < 0.001; ****P < 0.0001.
Fig. 3.
Fig. 3.
L. murinus (F5) diminishes level of polyamines in vivo. (A) LEfSe analysis shows bacterial taxa that are significantly different in abundance between mice with or without colistin administration (n = 10). (B) Spearman’s correlation between the top 10 species and metabolomic data of putrescine, spermidine, and spermine in the serum and colon (n = 10). (C and D) The level of putrescine, spermidine, spermine, and polyamines in the serum (C) and colon (D) of mice colonized with or without F5 (n = 8 to 12). (E and F) The level of putrescine, spermidine, spermine, and polyamines in the serum (E) and colon (F) of GF mice monocolonized with or without F5 (n = 12). Data were analyzed by unpaired t test or Mann–Whitney U test (F: Putrescine) and represented as mean ± SD (CF). *P < 0.05; **P < 0.01; ****P < 0.0001.
Fig. 4.
Fig. 4.
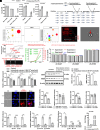
F5-derived small RNAs target polyamine metabolism. (A) The level of putrescine, spermidine, spermine, and polyamines in the supernatant of coculture systems (n = 5 to 6). (B) mRNA expression of ODC1, AMD1, and SRM in IPEC-J2 cells cocultured with or without pasteurized F5 (108) (n = 5 to 12). (C) Protein abundance of ODC1 and AMD1 in IPEC-J2 cells cocultured with or without pasteurized F5 (108) (n = 3 to 4). (D) mRNA expression of ODC1, AMD1, and SRM in IPEC-J2 cells cocultured with or without cell-free supernatant, pasteurized F5 (108), pasteurized F5 (108) pretreated with DNA remover, or pasteurized F5 (108) pretreated with RNase A (n = 6 to 12). (E) The level of putrescine, spermidine, spermine, and polyamines in supernatant of coculture systems (n = 6). (F) mRNA expression of ODC1, AMD1, and SRM in IPEC-J2 cells cocultured with or without pasteurized F5 (108), pasteurized F5 (108) pretreated with RNase A or RNAs with more than 200 nt in length isolated from F5 (n = 5 to 6). (G) mRNA expression of ODC1, AMD1, and SRM in IPEC-J2 cells cocultured with or without RNAs with 20 to 200 nt in length isolated from F5 (n = 5 to 6). (H) Protein abundance of ODC1 and AMD1 in IPEC-J2 cells cocultured with or without RNAs with 20 to 200 nt in length isolated from F5 (n = 3 to 4). Data were analyzed by unpaired t test (B, C, G, and H) or one-way ANOVA (A and DF) and represented as mean ± SD (A, C, E, and H) or SEM (B, D, F, and G).
Fig. 5.
Fig. 5.
Identification of small RNAs targeting host polyamine metabolism from F5. (A) Counts of raw reads, clea0n reads, and unique clean reads in IPEC-J2 cells treated as indicated (n = 3). (B) The counts of total reads and reads mapped to the representative genome of L. murinus in IPEC-J2 cells (n = 3). (C) The counts of unique reads and unique reads mapped to the representative genome of L. murinus in IPEC-J2 cells (n = 3). (D) F5-derived small RNAs targeting ODC1, AMD1, or SRM, respectively. (E) Expression of F5-derived small RNAs targeting ODC1, AMD1 or SRM detected by small RNA sequencing. (F) Gel electrophoresis of amplification products of qPCR. (G) Transmission electron microscope picture of EVs isolated from F5. (H) The amplification curve of sR-182871, sR-242825, and sR-257800 in EVs isolated from F5 detected by qPCR. (I) Gel electrophoresis of amplification products of qPCR performed in (H). (J) The relative abundance of sR-182871, sR-242825, and sR-257800 in culture supernatant of F5 and the percentage of dead bacteria at 0 h, 4 h, and 24 h. (K) The CT value of qPCR of sR-182871, sR-242825 and sR-257800 in four independent F5 samples. (L) mRNA expression of ODC1, AMD1, and SRM in IPEC-J2 cells treated as indicated (n = 4). (M) Protein abundance of ODC1 and AMD1 in IPEC-J2 cells treated as indicated (n = 3 to 4). (N) The distribution of Cy5-labeled sR-242825 in IPEC-J2 cells. (Scale bar, 10 μm.) (O) Luciferase activities in 293T cells cotransfected with luciferase reporter plasmid and sR-242825 or NC mimics (n = 8). (P) Luciferase activities in 293T cells cotransfected with luciferase reporter plasmid and sR-257800 or NC mimics (Left) (n = 7 to 8). (QS) Expression of sR-182871, sR-242825, and sR-257800 in the colon of mouse models (n = 3). (T) Average concentration of sR-257800 in the culture medium of coculture system composed by IPEC-J2 cells with live F5 (106) or inactivated F5 (108). Data were analyzed by unpaired t test and represented as mean ± SEM (L, M, and OS).
Fig. 6.
Fig. 6.
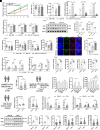
Polyamines play crucial roles in the pathogenesis of colitis and CRC. (AC) Body weight (A) (n = 15 to 20), colon length (B) (n = 18 to 20), and colon weight (C) (n = 5 to 8) of mice with colitis treated with or without F5 or F5 plus polyamines. (D) The relative abundance of sR-182871, sR-242825, and sR-257800 in the colon of mice treated as A (n = 4 to 8). (E) mRNA expression of ODC1, AMD1, and SRM in the colon of mice treated as A (n = 4). (F) Protein abundance of ODC1 and AMD1 in the colon of mice with colitis treated with or without F5 (n = 4). (G) The level of putrescine, spermidine, spermine, and polyamines in the colon of mice treated as A (n = 20). (H) Confocal images (Left) and quantification (Right) of CD206 (green) and F4/80 (red) positive cells in the colon of mice treated as A (n = 12 to 17). (Scale bar, 20 μm.) (I) The relative abundance of sR-182871, sR-242825, and sR-257800 in the colon of mice with or without CRC (n = 5). (J) mRNA expression of ODC1, AMD1, and SRM in the colon of mice with or without CRC (n = 4 to 5). (K) The level of putrescine, spermidine, spermine, and polyamines in the colon of mice with or without CRC (n = 8 to 9). (L) Scheme representing the metabolite profiling in the serum of healthy control and patients with CRC. (M) The level of spermidine in the serum of healthy controls and patients with CRC (n = 110 to 148). (N) Scheme representing the metabolite profiling in the feces of healthy controls, patients with multiple polypoid adenomas with low-grade dysplasia, stage 0/pTis CRC (S0), stage I CRC (SI), stage II CRC (SII), stage III CRC (SIII), stage IV CRC (SIV), and normal individuals with a history of colorectal surgery (HS). (O) The level of spermidine, spermine, and polyamines in the feces of healthy controls, patients with multiple polypoid adenomas with low-grade dysplasia, S0, SI, SII, SIII, SIV, and normal individuals with a HS. (P) Scheme representing the sample collection of CRCs and PNACTs of patients with CRC (n = 61). (Q and R) Relative abundance of Lactobacillus (Q) (n = 8 to 10) and L. murinus (R) in CRCs and PNACTs of patients with CRC (n = 17 to 20). (S) The relative abundance of sR-182871, sR-242825, and sR-257800 in CRCs and PNACTs of patients with CRC (n = 14 to 15). (T) mRNA expression of ODC1, AMD1, and SRM in CRCs and PNACTs of patients with CRC (n = 14 to 15). (U) Protein abundance of AMD1and ODC1 in CRCs and PNACTs of patients with CRC (n = 4). (V) The level of putrescine, spermidine, spermine, and polyamines in CRCs and PNACTs of patients with CRC (n = 50 to 60). Data were analyzed by unpaired t test, Mann–Whitney U test (H and I: sR-242825, M and S: sR-242825, and T: ODC1 and AMD1) or paired t test (V) and represented as mean ± SD (B, C, F, G, K, M, O, Q, and R) or SEM (A, D, E, I, J, and SV).
Fig. 7.
Fig. 7.
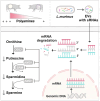
The graphic summary of this study. Germ-free pigs have elevated polyamine levels in the colon because intestinal L. murinus-derived small RNAs in extracellular vesicles down-regulate host polyamine metabolism by inhibiting the expression of enzymes in polyamine metabolism.

Comment in

  • Gut Microbes Participate in Host Polyamine Metabolism.
    Yu L, Zhang C, Zhai Q. Yu L, et al. Proc Natl Acad Sci U S A. 2024 Nov 5;121(45):e2419368121. doi: 10.1073/pnas.2419368121. Epub 2024 Oct 28. Proc Natl Acad Sci U S A. 2024. PMID: 39467143 Free PMC article. No abstract available.

References

    1. Casero R. A. Jr., Murray Stewart T., Pegg A. E., Polyamine metabolism and cancer: Treatments, challenges and opportunities. Nat. Rev. Cancer 18, 681–695 (2018). - PMC - PubMed
    1. Lee M. S., et al. , Ornithine aminotransferase supports polyamine synthesis in pancreatic cancer. Nature 616, 339–347 (2023). - PMC - PubMed
    1. Zabala-Letona A., et al. , mTORC1-dependent AMD1 regulation sustains polyamine metabolism in prostate cancer. Nature 547, 109–113 (2017). - PMC - PubMed
    1. Hibino S., et al. , Tumor cell-derived spermidine is an oncometabolite that suppresses TCR clustering for intratumoral CD8(+) T cell activation. Proc. Natl. Acad. Sci. U.S.A. 120, e2305245120 (2023). - PMC - PubMed
    1. Li H., et al. , YAP/TAZ drives cell proliferation and tumour growth via a polyamine-eIF5A hypusination-LSD1 axis. Nat. Cell Biol. 24, 373–383 (2022). - PMC - PubMed

LinkOut - more resources