

Environment-independent distribution of mutational effects emerges from microscopic epistasis
- PMID: 39361740
- PMCID: PMC11580693
- DOI: 10.1126/science.adn0753
Environment-independent distribution of mutational effects emerges from microscopic epistasis
Abstract
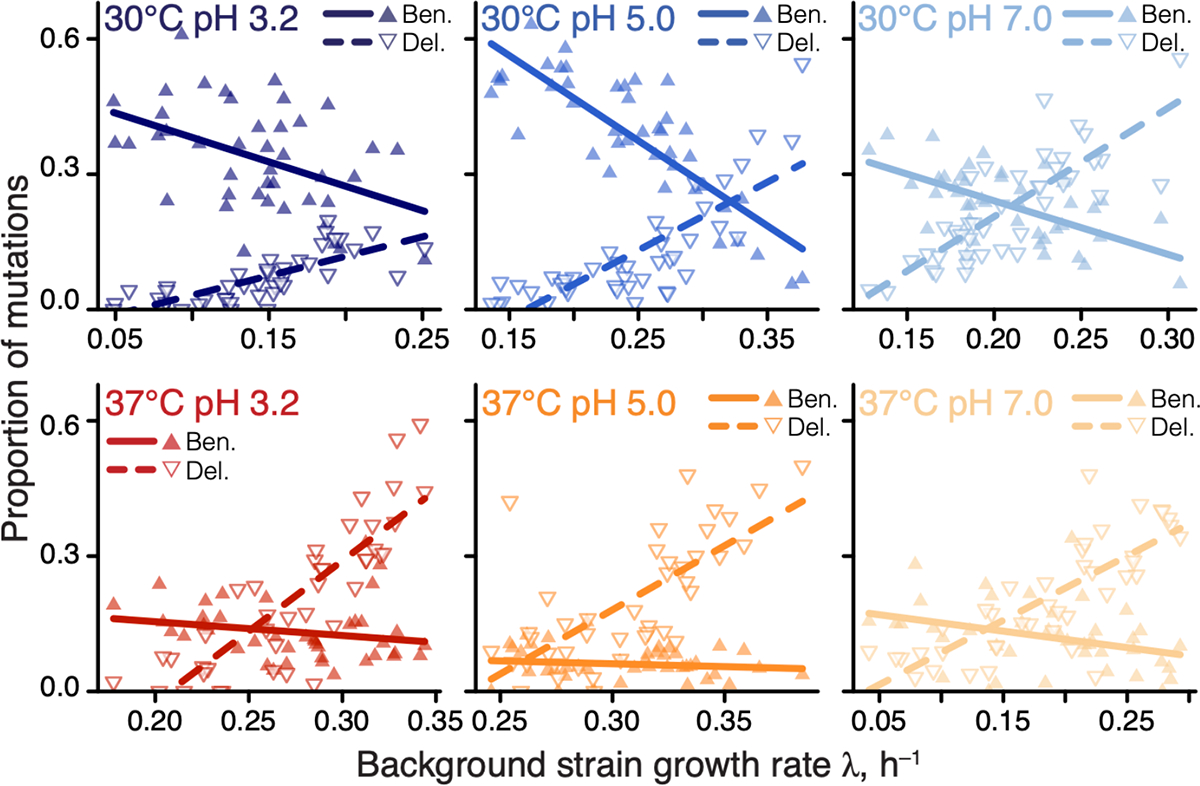
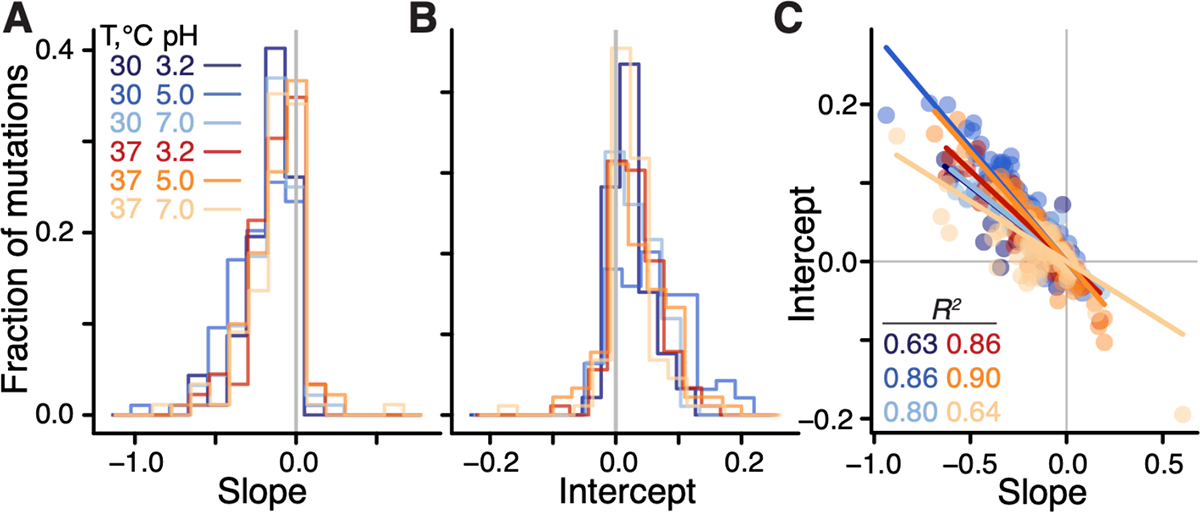
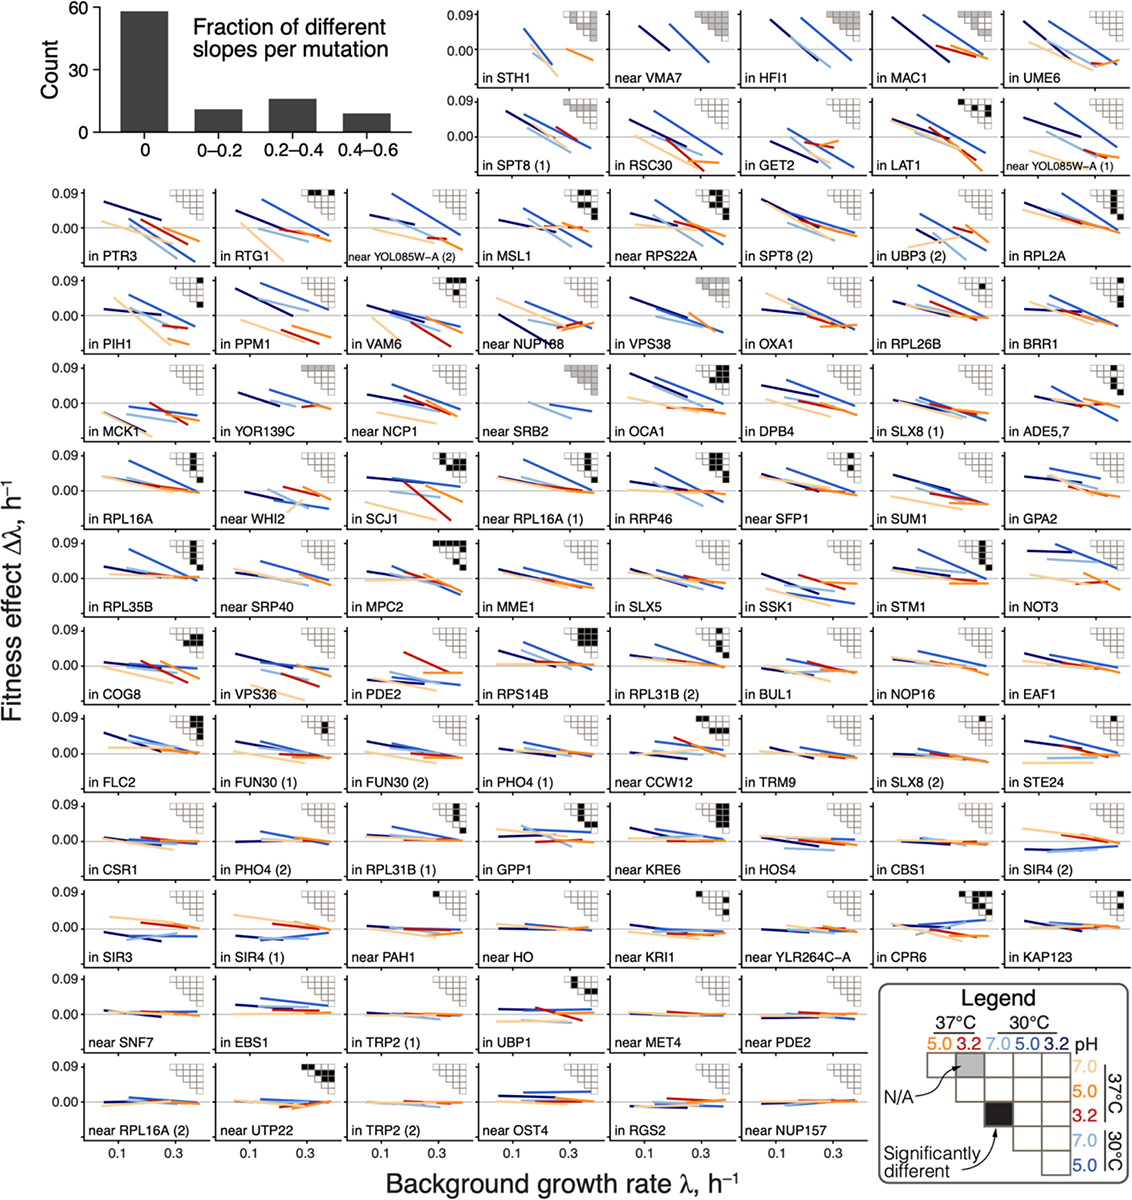
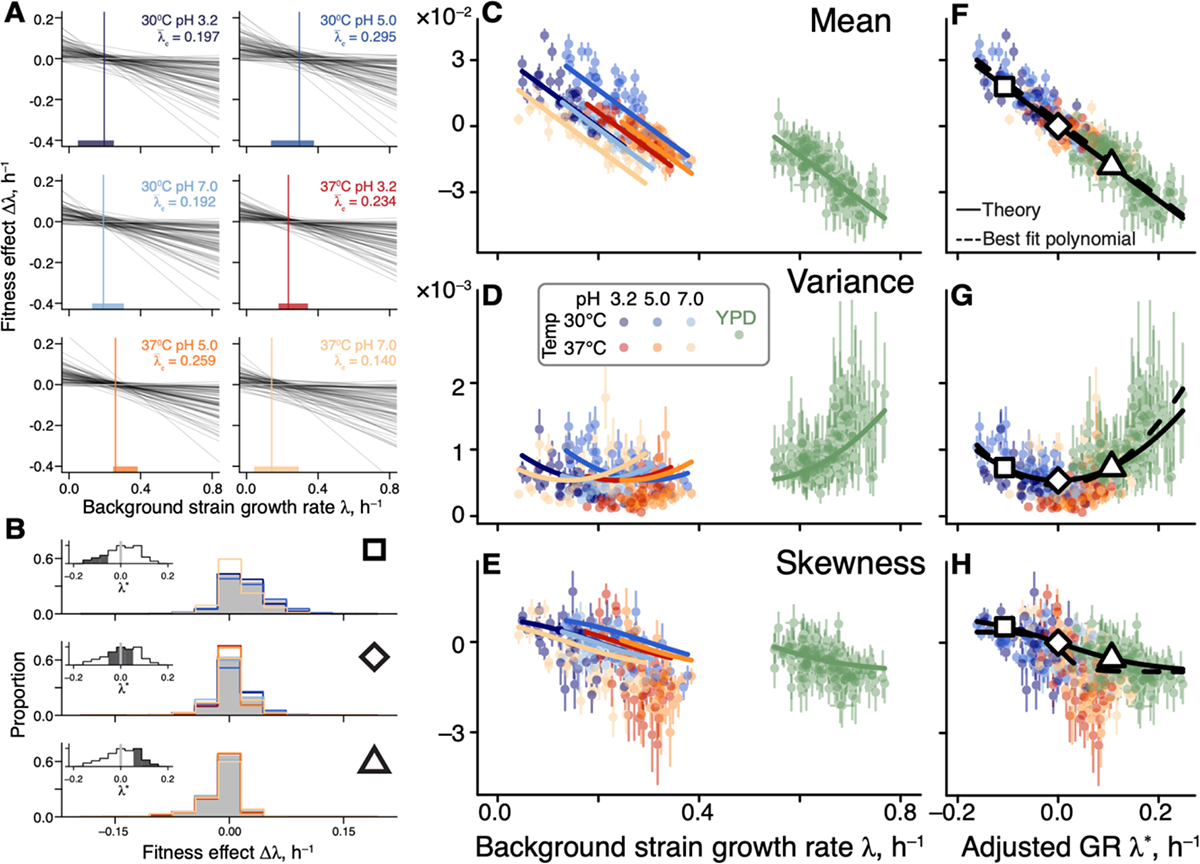
Predicting how new mutations alter phenotypes is difficult because mutational effects vary across genotypes and environments. Recently discovered global epistasis, in which the fitness effects of mutations scale with the fitness of the background genotype, can improve predictions, but how the environment modulates this scaling is unknown. We measured the fitness effects of ~100 insertion mutations in 42 strains of Saccharomyces cerevisiae in six laboratory environments and found that the global epistasis scaling is nearly invariant across environments. Instead, the environment tunes one global parameter, the background fitness at which most mutations switch sign. As a consequence, the distribution of mutational effects is predictable across genotypes and environments. Our results suggest that the effective dimensionality of genotype-to-phenotype maps across environments is surprisingly low.
Conflict of interest statement
Competing interests:
None declared.
Figures
Update of
-
Environment-independent distribution of mutational effects emerges from microscopic epistasis.bioRxiv [Preprint]. 2024 Jul 9:2023.11.18.567655. doi: 10.1101/2023.11.18.567655. bioRxiv. 2024. Update in: Science. 2024 Oct 4;386(6717):87-92. doi: 10.1126/science.adn0753. PMID: 38014325 Free PMC article. Updated. Preprint.
References
-
- Koel BF, Burke DF, Bestebroer TM, van der Vliet S, Zondag GCM, Vervaet G, Skepner E, Lewis NS, Spronken MIJ, Russell CA, Eropkin MY, Hurt AC, Barr IG, de Jong JC, Rimmelzwaan GF, Osterhaus ADME, Fouchier RAM, Smith DJ, Substitutions near the receptor binding site determine major antigenic change during influenza virus evolution. Science 342, 976–979 (2013). - PubMed
-
- Dixon GB, Davies SW, Aglyamova GA, Meyer E, Bay LK, Matz MV, Genomic determinants of coral heat tolerance across latitudes. Science 348, 1460–1462 (2015). - PubMed
-
- Promdonkoy P, Mhuantong W, Champreda V, Tanapongpipat S, Runguphan W, Improvement in D-xylose utilization and isobutanol production in S. cerevisiae by adaptive laboratory evolution and rational engineering. J. Ind. Microbiol. Biotechnol 47, 497–510 (2020). - PubMed
-
- Kreiner JM, Latorre SM, Burbano HA, Stinchcombe JR, Otto SP, Weigel D, Wright SI, Rapid weed adaptation and range expansion in response to agriculture over the past two centuries. Science 378, 1079–1085 (2022). - PubMed
-
- Papp B, Notebaart RA, Pál C, Systems-biology approaches for predicting genomic evolution. Nat. Rev. Genet 12, 591–602 (2011). - PubMed
Publication types
MeSH terms
Grants and funding
LinkOut - more resources
Full Text Sources
Research Materials
