. 2024 Oct 16;38(17-20):887-914.
doi: 10.1101/gad.351734.124.

YY1 knockout in pro-B cells impairs lineage commitment, enabling unusual hematopoietic lineage plasticity

Affiliations

YY1 knockout in pro-B cells impairs lineage commitment, enabling unusual hematopoietic lineage plasticity

Sarmistha Banerjee et al. Genes Dev. .

Abstract

During B-cell development, cells progress through multiple developmental stages, with the pro-B-cell stage defining commitment to the B-cell lineage. YY1 is a ubiquitous transcription factor that is capable of both activation and repression functions. We found here that knockout of YY1 at the pro-B-cell stage eliminates B lineage commitment. YY1 knockout pro-B cells can generate T lineage cells in vitro using the OP9-DL4 feeder system and in vivo after injection into sublethally irradiated Rag1-/- mice. These T lineage-like cells lose their B lineage transcript profile and gain a T-cell lineage profile. Single-cell RNA-seq experiments showed that as YY1 knockout pro-B cells transition into T lineage cells in vitro, various cell clusters adopt transcript profiles representing a multiplicity of hematopoietic lineages, indicating unusual lineage plasticity. In addition, YY1 KO pro-B cells in vivo can give rise to other hematopoietic lineages in vivo. Evaluation of RNA-seq, scRNA-seq, ChIP-seq, and scATAC-seq data indicates that YY1 controls numerous chromatin-modifying proteins leading to increased accessibility of alternative lineage genes in YY1 knockout pro-B cells. Given the ubiquitous nature of YY1 and its dual activation and repression functions, YY1 may regulate commitment in multiple cell lineages.

Keywords: B-cell development; YY1; alternative lineages; hematopoietic lineage plasticity; lineage commitment; scATAC-seq; scRNA-seq; transcription.


Figures

Figure 1.
Figure 1.
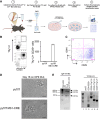
YY1 knockout pro-B cells can adopt T lineage properties in vitro. (A) Diagram of in vitro strategy for testing lineage plasticity of either wild-type (yy1f/f) or YY1 knockout (yy1f/f Mb1-CRE) pro-B cells. (B) Comparison of yy1f/f and yy1f/f Mb1-CRE pro-B cells grown on OP9-DL4 feeder cells in the presence of IL-7, Flt3L, and SCF for 3 weeks. (Left panel) FACS plots of yy1f/f (top) compared with yy1f/f Mb1-CRE (bottom) pro-B cells with antibodies that detect T lineage cells (Thy1.2 and CD25). (Right panel) Quantitation of cell numbers in each sample. (C) CD44 and CD25 antibody FACS profile of T lineage DN stages of yy1f/f Mb1-CRE pro-B cells grown on OP9-DL4 feeders for 3 weeks. (D) Morphological changes in cells after incubation on OP9-DL4 feeders for 18 days. Phase contrast images of either yy1f/f (top) or yy1f/f Mb1-CRE (bottom) pro-B cells incubated on OP9-DL4 feeders were captured using the EVOS cell imaging system by Life Technologies (Thermo Fisher Scientific). Scale bar, 100 μm. (E) YY1 knockout pro-B cells grown on OP9-DL4 feeders for 3 weeks contain both IgH and TCRβ somatic rearrangements. (Left panel) V(D)J rearrangement assays for VH7183 rearrangements with LSK-negative control and wild-type pro-B-positive control. (Right panel) TCRβ V4 rearrangements with pro-B-negative control, CD4/CD8 T-cell-positive control, and three samples of yy1f/f Mb1-CRE pro-B cells grown on OP9-DL4 feeder cells in the presence of IL-7, Flt3L, and SCF for 3 weeks.
Figure 2.
Figure 2.
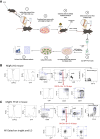
YY1 complementation ablates lineage plasticity and restores B lineage commitment. (A) Diagram of the experimental strategy. (B) Empty retroviral vector MigR1 does not rescue B lineage arrest caused by YY1 knockout and allows T lineage plasticity of yy1 knockout pro-B cells. Bone marrow cells from yy1f/f Mb1-CRE mice were isolated, transduced with MigR1 empty vector, and injected into lethally irradiated mice. Twelve weeks later, GFP+ pro-B cells were isolated and placed on OP9-DL4 feeder cells for 3 weeks. (Top panel) FACS analyses show development of pro-B cells but not of pre-B or recirculating B lineage cells. (Bottom panel) These cells generated T lineage cells on OP9-DL4 feeders as assessed by FACS with anti-Thy1.2, anti-CD25, and anti-CD44 antibodies, yielding patterns similar to DN2 and DN3 cells. (C) Retroviral provision of YY1 restores B lineage development but ablates lineage plasticity to the T-cell lineage. Bone marrow cells from yy1f/f Mb1-CRE mice were isolated, transduced with YY1-expressing vector MigR1-YY1, and injected into lethally irradiated mice. Twelve weeks later, GFP+ pro-B cells were isolated and placed on OP9-DL4 feeder cells for 3 weeks. YY1 expression completely rescued B lineage development by formation of pro-B, pre-B, immature B, and recirculating B lineage cells in vivo (top panel), but these cells failed to generate T lineage cells on OP9-DL4 feeder cells (bottom panel).
Figure 3.
Figure 3.
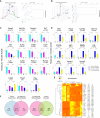
YY1 knockout pro-B cells grown on OP9-DL4 feeders for 3 weeks gain a T lineage transcript profile and ablate their B lineage profile. (A) Three-dimensional principal component analyses (PCAs) and dendograms of the RNA-seq data from control thymic T cells (C1–C5), T cells developed from YY1-null pro-B cells (T1–T5), normal pro-B cells (B1–B3), and YY1-null pro-B cells (Y1–Y3). (B) Three-dimensional PCAs and dendograms of RNA-seq data from 15 select T-cell and 11 select B-cell genes. (C) Gain of T lineage RNA-seq profiles of yy1f/f Mb1-CRE pro-B cells grown on OP9-DL4 feeders for 3 weeks. RNA-seq expression levels are shown for select T lineage genes using RNA isolated from YY1 knockout pro-B cells (Y), control pro-B cells (B), YY1 knockout pro-B cells grown on OP9-DL4 feeders for 3 weeks (T), and control thymic T cells (C). (D) Loss of B lineage gene expression in yy1f/f Mb1-CRE pro-B cells grown on OP9-DL4 feeders for 3 weeks. Gene expression profiles are shown for select B lineage genes using the same RNA-seq samples as in C. (E) Heat map expression profiles of the data in C and D. (F) Overlap in gene expression profiles in each sample. (Left) Control thymic T-cell transcripts show extensive overlap in RNA-seq profile (89.1%) with yy1f/f Mb1-CRE pro-B cells grown on OP9-DL4 feeders (T). (Right) In contrast, yy1f/f Mb1-CRE pro-B cells grown on OP9-DL4 feeders (T) show expression of only 9.2% of genes expressed in their original YY1-null pro-B-cell identify (Y).
Figure 4.
Figure 4.
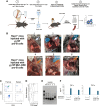
YY1 knockout pro-B cells can develop into T-like cells in vivo. (A) Diagram showing experimental strategy. (B) Sublethally irradiated Rag1−/− mice were injected with either control pro-B cells (yy1f/f) or YY1 knockout pro-B cells (yy1f/f Mb1-CRE). Seven months later, mice were sacrificed and assessed for T lineage development. Pictures are shown of mouse thymuses from control Rag1−/− mice injected with either wild-type (yy1f/f) pro-B cells (top panels) or YY1 knockout pro-B cells (yy1f/f Mb1-CRE; bottom panels). (C) FACS plots of thymic DP, CD4, and CD8 T lineage development of two mice injected with yy1f/f Mb1-CRE pro-B cells (left panel), and CD4+ CD8+ expression of splenic T cells of two mice injected with yy1f/f Mb1-CRE pro-B cells (right panel). (D) Splenic T lineage cells developed in vivo from yy1f/f Mb1-CRE pro-B cells express TCRβ. (E) Two of three samples of T lineage cells developed in vivo from yy1f/f Mb1-CRE pro-B cells exhibit IgH gene rearrangements (samples 5 and 6). (F) Splenic T cells developed from YY1 KO pro-B cells injected into Rag1−/− mice express cytokines upon CD3/CD28 stimulation, similar to control T cells.
Figure 5.
Figure 5.
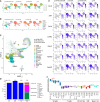
yy1f/f Mb1-CRE pro-B cells grown on OP9-DL4 feeders for 2 weeks develop into cells expressing a multiplicity of hematopoietic lineage transcripts and extinguish their B lineage transcript profile. Pro-B cells from yy1f/f or yy1f/f Mb1CRE mice were either subjected to scRNA-seq immediately or grown on OP9-DL4 feeders for 2 weeks when 3%–5% of cells from the yy1f/f Mb1-CRE sample developed a Thy1.2+ CD25+ phenotype. (A) Patterns of the 22 Seurat clusters in each sample. (B) Assignment of cell types in each sample using the SingleR program. A cell identity key is shown in the right panel. (C) Pattern of the clusters and cell types in the yy1f/f Mb1-CRE sample grown on OP9-DL4 feeders. Cell types identified by SingleR are indicated in the figure. The arrow points to the location of cells defined as either T or Tγ/d lineage. (D) Cell type percentages in each sample. The percentage of each sample that represents B lineage cells is shown above each column. The percentage of cells in the yy1/f/f Mb1-CRE sample grown on OP9-DL4 feeders that are identified as either stem cell, monocyte, macrophage, or dendritic cells is indicated, and cell identities are indicated in the color key at the right. (E) UMAP profiles are shown for B lineage genes Pax5, Ebf1, Cd19, Cd79a, Cplx2, Vpreb2, and Vpreb3 from pro-B cells isolated from yy1f/f and yy1f/f Mb1-CRE mice or the same cells grown on OP9-DL4 feeders for 2 weeks until 3%–5% of the cells from yy1f/f Mb1-CRE mice were Thy1.2+ CD25+. Gene names are at the left, and the cell types are indicated above each column. (yy1f/f Mb1-CRE Diff) YY1 knockout pro-B cells developed until 3%–5% of the pro-B cells developed a Thy1.2+ CD25+ phenotype, (yy1f/f Diff) wild-type pro-B cells incubated on feeders for the same period of time (2 weeks), (yy1f/f Mb1-CRE and yy1f/f) pro-B cells directly isolated from mice and subjected to scRNA-seq. (F) Box plot charts of the genes listed in E for expression level in various B-, T-, dendritic (DC), macrophage (M), monocyte (Mo), granulocyte (GN), basophil (Baso), or eosinophil (Eo) cell types. The red arrow points to pro-B fraction B/C cells.
Figure 6.
Figure 6.
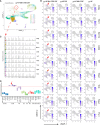
T lineage genes are expressed in the small cell cluster identified as T cells. (A) UMAP profile of yy1f/f Mb1-CRE pro-B cells grown on OP9-DL4 feeders for 2 weeks until 3%–5% of cells were Thy1.2+ CD25+. The red circle identifies the small cluster of cells identified by SingleR as T lineage cells in the yy1f/f Mb1-CRE sample. (B) UMAP gene expression profiles of key T-cell lineage genes that are listed at the right. The red arrows show the location of the small cell cluster identified by SingleR as T lineage cells. (C) Violin plots of the RNA expression level of each T lineage gene in each Seurat cluster. The dashed red arrow shows that high expression of T lineage genes matches the small cluster of cells in A, identified as T cells (red circle). (D) Box plot charts of the genes listed in B for expression level in various B-, T-, NK, dendritic (DC), macrophage (Mc), granulocyte (GN), monocyte (Mo), basophil (Baso), or eosinophil (Eo) cell types.
Figure 7.
Figure 7.
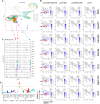
Elevated DC4+ and DC8+ dendritic lineage gene expression in clusters identified by SingleR as dendritic. (A) UMAP profile of yy1f/f Mb1-CRE pro-B cells grown on OP9-DL4 feeders for 2 weeks until 3%–5% of cells were Thy1.2+ CD25+. Cell clusters 9 and 10, identified by SingleR as dendritic cells, are indicated by red ovals. Cluster 21, also expressing dendritic genes, is indicated by the blue oval. (B) UMAP profiles of gene expression for dendritic genes Itgax, Apol7c, Cacnb3, Clec9a, Tlr11, Gpr141b, and Xcr1 show high-level expression in clusters 9 and/or 10 (red arrows). Expression of some dendritic genes in cluster 21 is shown by the blue arrows. (C) Violin plots of RNA expression show that expression of the seven dendritic genes in B as well as that of eight other dendritic genes match the dendritic clusters 9, 10 (red dashed arrows), and 21 (blue dashed arrows). (D) Box plot charts of the genes in B for expression level in various B-, T-, NK, dendritic (DC), macrophage (Mc), granulocyte (GN), monocyte (Mo), basophil (Baso), or eosinophil (Eo) cell types show strong specificity for DC4+ and DC8+ dendritic cells (red arrow).
Figure 8.
Figure 8.
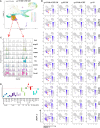
Elevated expression of monocyte genes in yy1f/f Mb1-CRE cells on OP9-DL4 feeders. (A) UMAP profile of yy1f/f Mb1-CRE pro-B cells from OP9-DL4 feeders grown for 2 weeks until 3%–5% of the cells were Thy1.2+ Cd25+. The positions of clusters identified as monocytic cells (clusters 3 and 15) are indicated by the red oval and circle. (B) UMAP profiles of gene expression of Klra2, Arhgef37, Slfn1, Cd300ld, Ptpro, Gda, Gm9733, Ccl9, and Clec4a3 show high-level expression in clusters 3 and 15 (red arrows). (C) Violin plots also show high expression of these genes in clusters 3 and 15 (red dashed arrows). (D) Immgen box blots show that the genes presented in B and C are enriched for expression in monocytes (red arrow).
Figure 9.
Figure 9.
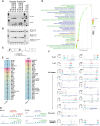
YY1 knockout pro-B cells develop into monocytes and dendritic cells in vivo, and YY1 regulates chromatin-modifying genes and chromatin accessibility at lineage-specific genes. (A–C) Monocytes and dendritic cells from yy1f/f Mb1-CRE mice, but not yy1f/f mice, contain V(D)J rearrangements and have deleted the yy1 gene. (A) PCR reactions show that DNA isolated from FACS-purified bone marrow monocytes and splenic dendritic cells contain Vh7183 and VhQ52 rearrangements in yy1f/f Mb1-CRE mice but not yy1f/f mice. (B) Monocyte and dendritic cells from yy1f/f Mb1-CRE mice, but not yy1f/f mice, show deletion of the yy1 gene (shown in the middle panel). (C) Map of the PCR primers amplifying the yy1 gene. (D) Gene ontology analyses of biological processes and KEGG pathway analyses were performed on genes that contain YY1 binding sites defined by ChIP-seq. Nearly all genes are involved in chromatin remodeling (green) or differentiation pathways (blue). (E) scATAC-seq-enriched transcription factor DNA binding motifs that are distinct in WT YY1 pro-B cells (left column) or in YY1 KO pro-B cells are shown in the right column. (F) scATAC-seq accessibility is reduced in YY1KO pro-B cells at some B lineage genes, enhanced at many alternative lineage genes, and reduced at some chromatin remodeling genes. Regions of change are indicated by boxes in the figure. The top panels (KO and orange) are YY1 KO (yy1ff Mb1-CRE) scATAC-seq data, and the bottom panels (WT and blue) are YY1 WT (yy1f/f) scATAC-seq data. (G) Model of chromatin and gene expression changes that enable YY1-null pro-B cells to develop into alternative lineage cells.

Update of

References

    1. Abadi M, Agarwal A, Barham P, Brevdo E, Chen Z, Citro C, Corrado GS, Davis A, Dean J, Devin M, et al. 2016. Tensorflow: large-scale machine learning on heterogeneous distributed systems. arXiv 10.48550/arXiv.1603.0446 - DOI
    1. Andrews S. 2010. FastQC: a quality control tool for high throughput sequence data. Babraham Bioinformatics, Babraham Institute, Cambridge, United Kingdom.
    1. Aran D, Looney AP, Liu L, Wu E, Fong V, Hsu A, Chak S, Naikawadi RP, Wolters PJ, Abate AR, et al. 2019. Reference-based analysis of lung single-cell sequencing reveals a transitional profibrotic macrophage. Nat Immunol 20: 163–172. 10.1038/s41590-018-0276-y - DOI - PMC - PubMed
    1. Atchison L, Ghias A, Wilkinson F, Bonini N, Atchison ML. 2003. Transcription factor YY1 functions as a PcG protein in vivo. EMBO J 22: 1347–1358. 10.1093/emboj/cdg124 - DOI - PMC - PubMed
    1. Aubrey M, Warburg ZJ, Murre C. 2022. Helix–loop–helix proteins in adaptive immune development. Front Immunol 13: 881656. 10.3389/fimmu.2022.881656 - DOI - PMC - PubMed

Substances

LinkOut - more resources