

Pairwise Accelerated Failure Time Regression Models for Infectious Disease Transmission in Close-Contact Groups With External Sources of Infection
- PMID: 39362790
- PMCID: PMC11583957
- DOI: 10.1002/sim.10226
Pairwise Accelerated Failure Time Regression Models for Infectious Disease Transmission in Close-Contact Groups With External Sources of Infection
Abstract
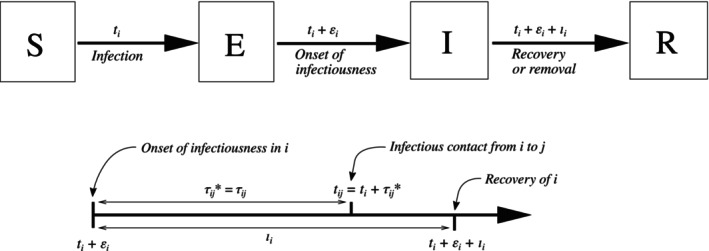
Many important questions in infectious disease epidemiology involve associations between covariates (e.g., age or vaccination status) and infectiousness or susceptibility. Because disease transmission produces dependent outcomes, these questions are difficult or impossible to address using standard regression models from biostatistics. Pairwise survival analysis handles dependent outcomes by calculating likelihoods in terms of contact interval distributions in ordered pairs of individuals. The contact interval in the ordered pair is the time from the onset of infectiousness in to infectious contact from to , where an infectious contact is sufficient to infect if they are susceptible. Here, we introduce a pairwise accelerated failure time regression model for infectious disease transmission that allows the rate parameter of the contact interval distribution to depend on individual-level infectiousness covariates for , individual-level susceptibility covariates for , and pair-level covariates (e.g., type of relationship). This model can simultaneously handle internal infections (caused by transmission between individuals under observation) and external infections (caused by environmental or community sources of infection). We show that this model produces consistent and asymptotically normal parameter estimates. In a simulation study, we evaluate bias and confidence interval coverage probabilities, explore the role of epidemiologic study design, and investigate the effects of model misspecification. We use this regression model to analyze household data from Los Angeles County during the 2009 influenza A (H1N1) pandemic, where we find that the ability to account for external sources of infection increases the statistical power to estimate the effect of antiviral prophylaxis.
Keywords: accelerated failure time model; infectious disease epidemiology; secondary attack risk; survival analysis.
© 2024 The Author(s). Statistics in Medicine published by John Wiley & Sons Ltd.
Conflict of interest statement
The authors declare no conflicts of interest.
Figures
Similar articles
-
Estimating and interpreting secondary attack risk: Binomial considered biased.PLoS Comput Biol. 2021 Jan 20;17(1):e1008601. doi: 10.1371/journal.pcbi.1008601. eCollection 2021 Jan. PLoS Comput Biol. 2021. PMID: 33471806 Free PMC article.
-
Nonparametric survival analysis of infectious disease data.J R Stat Soc Series B Stat Methodol. 2013 Mar;75(2):277-303. doi: 10.1111/j.1467-9868.2012.01042.x. J R Stat Soc Series B Stat Methodol. 2013. PMID: 23772180 Free PMC article.
-
Molecular Infectious Disease Epidemiology: Survival Analysis and Algorithms Linking Phylogenies to Transmission Trees.PLoS Comput Biol. 2016 Apr 12;12(4):e1004869. doi: 10.1371/journal.pcbi.1004869. eCollection 2016 Apr. PLoS Comput Biol. 2016. PMID: 27070316 Free PMC article.
-
Heterogeneity in transmissibility and shedding SARS-CoV-2 via droplets and aerosols.Elife. 2021 Apr 16;10:e65774. doi: 10.7554/eLife.65774. Elife. 2021. PMID: 33861198 Free PMC article.
-
Quantifying Transmission.Microbiol Spectr. 2017 Jul;5(4):10.1128/microbiolspec.mtbp-0005-2016. doi: 10.1128/microbiolspec.MTBP-0005-2016. Microbiol Spectr. 2017. PMID: 28812540 Free PMC article. Review.
References
-
- Fox J. P., “Family‐Based Epidemiologic Studies,” American Journal of Epidemiology 99, no. 3 (1974): 165–179. - PubMed
-
- Halloran M. E., Préziosi M. P., and Chu H., “Estimating Vaccine Efficacy From Secondary Attack Rates,” Journal of the American Statistical Association 98, no. 461 (2003): 38–46.
MeSH terms
Grants and funding
LinkOut - more resources
Full Text Sources
Medical