. 2024 Oct 3;15(1):8578.
doi: 10.1038/s41467-024-52379-2.

FGF21 modulates immunometabolic homeostasis via the ALOX15/15-HETE axis in early liver graft injury

Affiliations

FGF21 modulates immunometabolic homeostasis via the ALOX15/15-HETE axis in early liver graft injury

Xinyu Yang et al. Nat Commun. .

Abstract

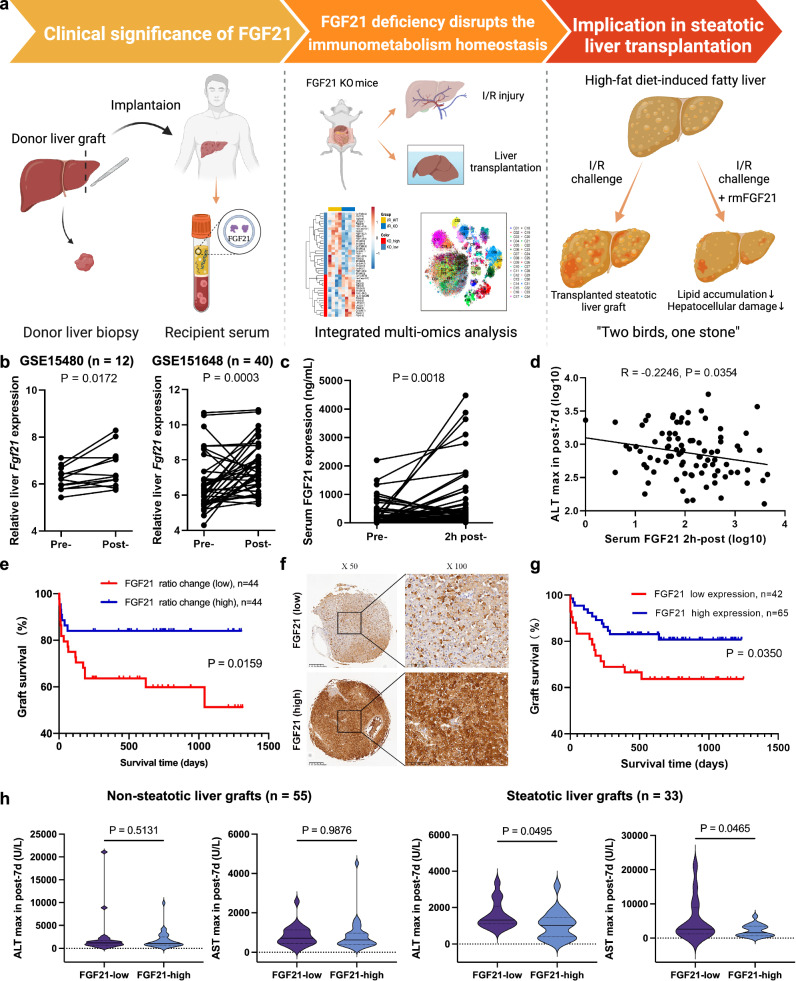
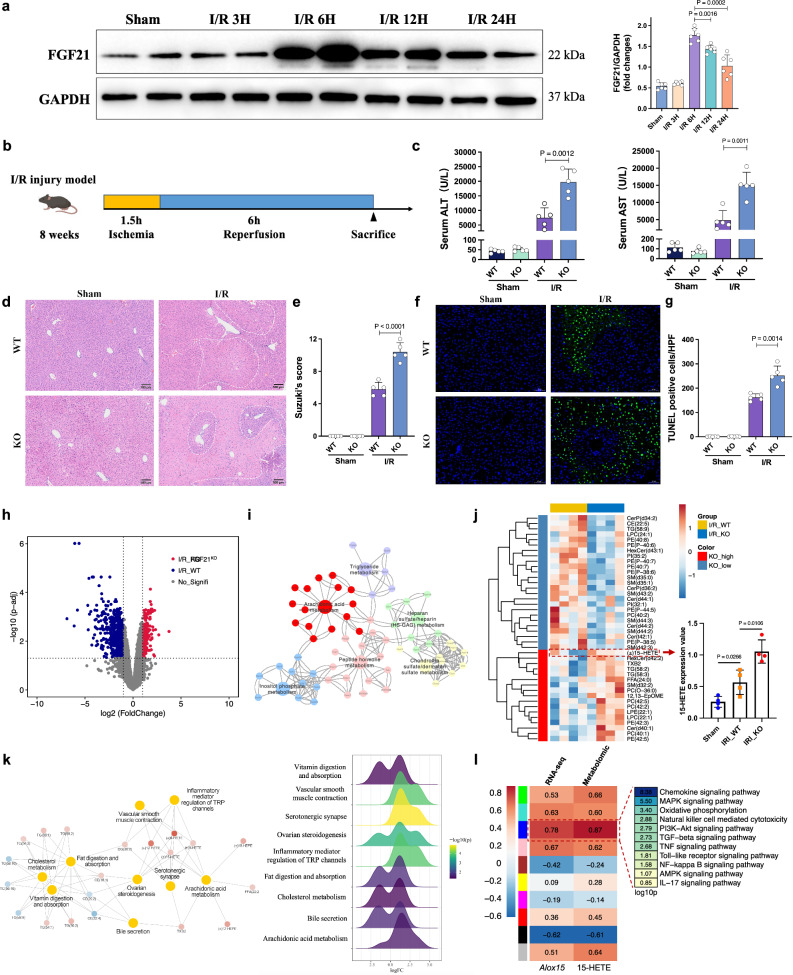
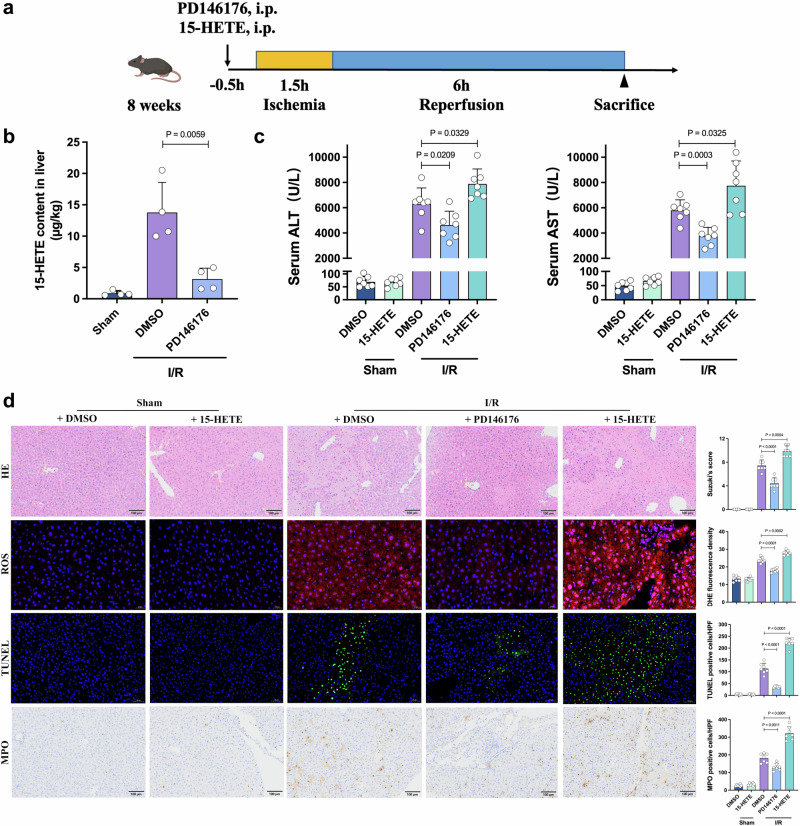
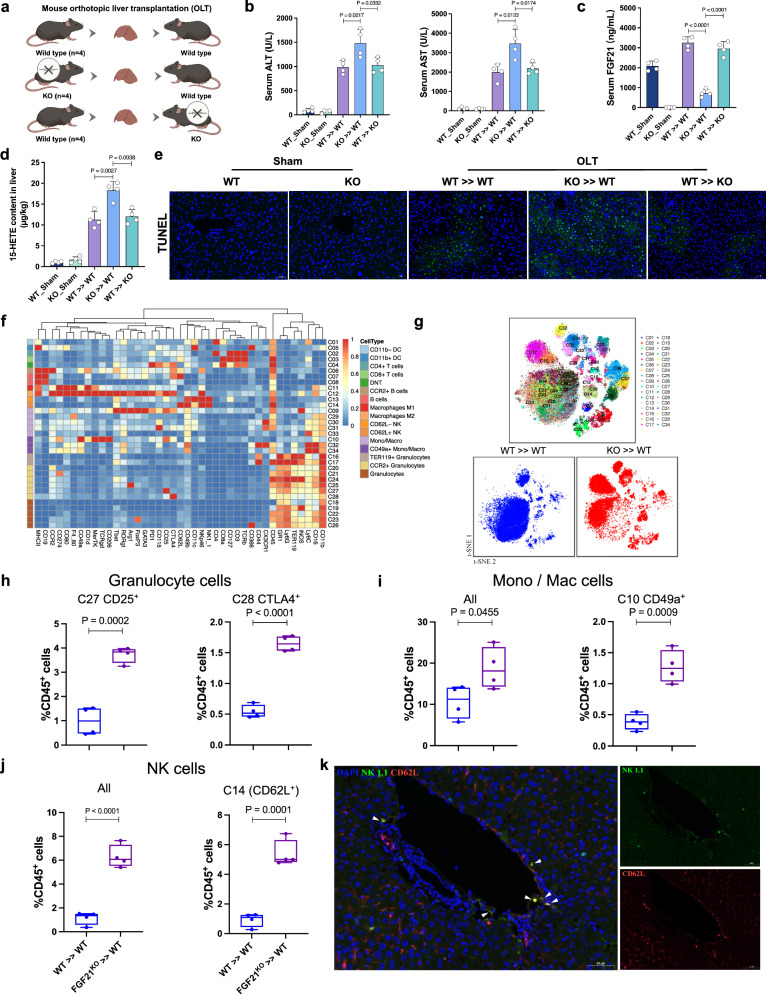
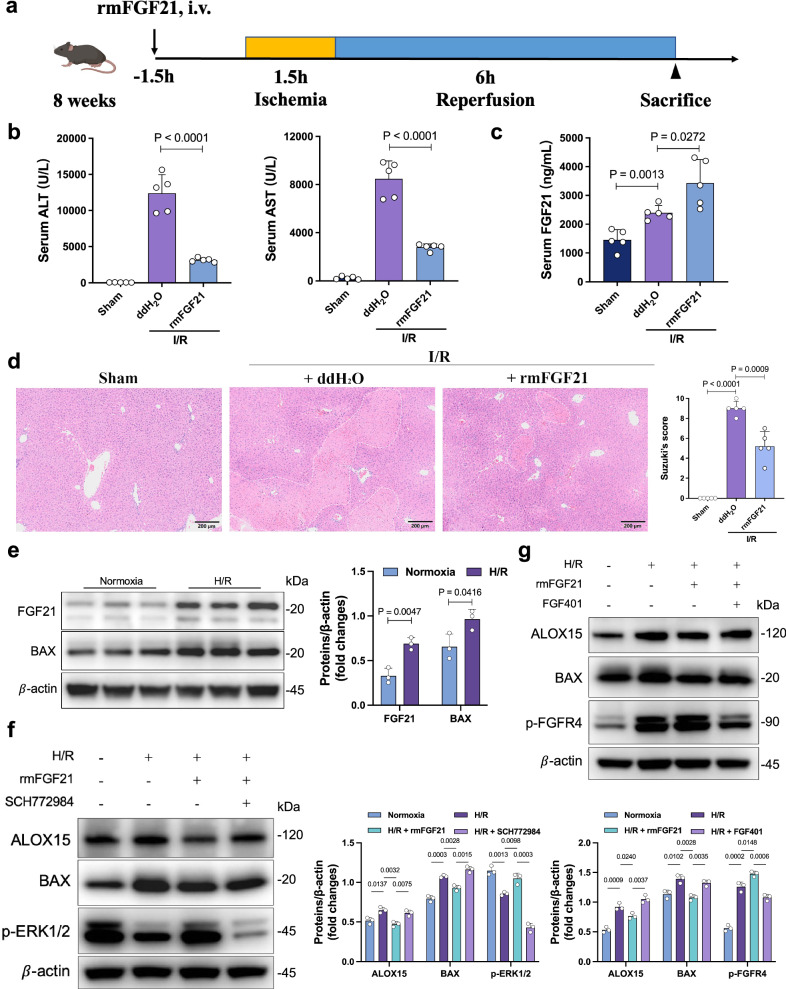
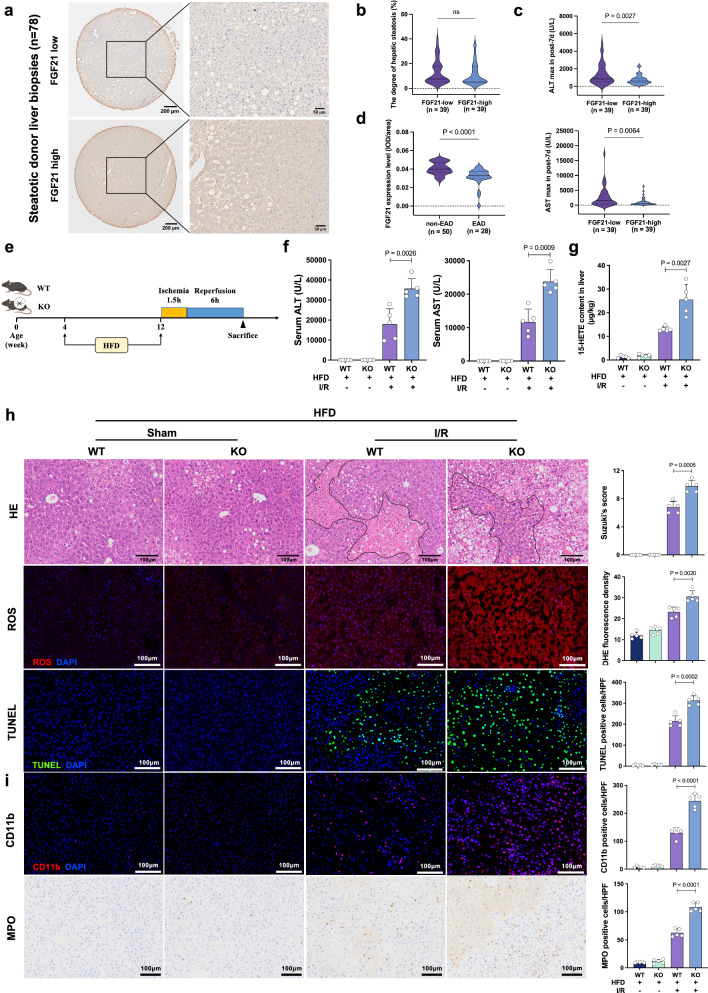
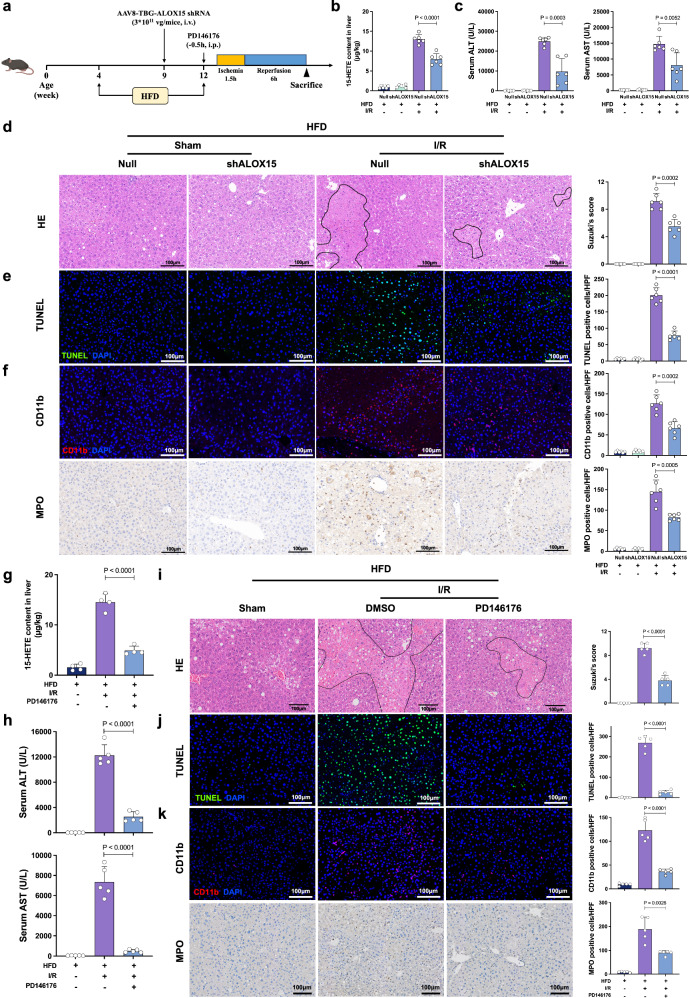
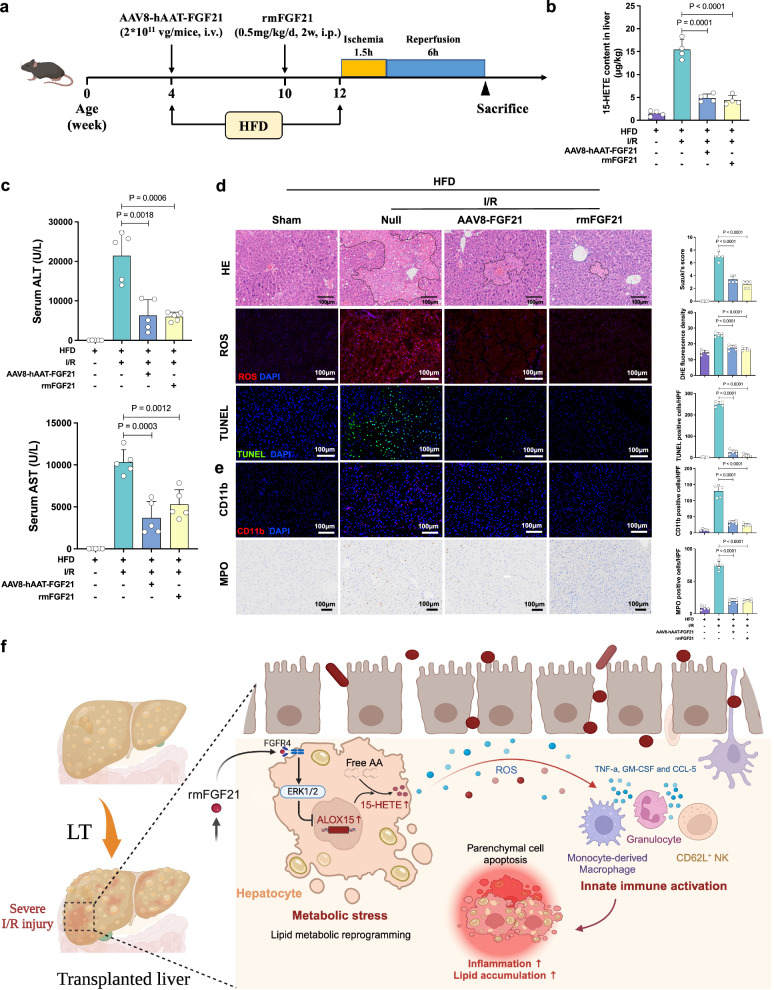
Fibroblast growth factor 21 (FGF21) is essential for modulating hepatic homeostasis, but the impact of FGF21 on liver graft injury remains uncertain. Here, we show that high FGF21 levels in liver graft and serum are associated with improved graft function and survival in liver transplantation (LT) recipients. FGF21 deficiency aggravates early graft injury and activates arachidonic acid metabolism and regional inflammation in male mouse models of hepatic ischemia/reperfusion (I/R) injury and orthotopic LT. Mechanistically, FGF21 deficiency results in abnormal activation of the arachidonate 15-lipoxygenase (ALOX15)/15-hydroxy eicosatetraenoic acid (15-HETE) pathway, which triggers a cascade of innate immunity-dominated pro-inflammatory responses in grafts. Notably, the modulating role of FGF21/ALOX15/15-HETE pathway is more significant in steatotic livers. In contrast, pharmacological administration of recombinant FGF21 effectively protects against hepatic I/R injury. Overall, our study reveals the regulatory mechanism of FGF21 and offers insights into its potential clinical application in early liver graft injury after LT.


Conflict of interest statement

The authors declare no competing interests.

Figures

Fig. 1
Fig. 1. The general workflow and the association of FGF21 expression with clinical outcomes.
a An overview of a general workflow for the study. b Comparison of pre- and post-transplantation Fgf21 mRNA expression in the liver graft based on the GSE15480 (n = 12 pairs, including pre- and post-LT donor livers) and GSE151648 (n = 40 pairs, including pre- and post-LT donor livers) derived from graft biopsies in liver transplantation. c Comparison of pre- and post-reperfusion FGF21 levels in the serum (Cohort 1, n = 88 pairs, including pre- and 2 h post-LT recipient serum). d The peripheral FGF21 level 2 h after reperfusion linearly correlated with maximal ALT within 7 days after transplantation. e The 88 patients were divided into the FGF21-elevated group (n = 44) and non-elevated group (n = 44) according to the median value of ratio change (post-reperfusion/pre-transplant). The elevated group had improved graft survival. f, g Pre-transplant FGF21 expression in biopsies (Cohort 2, n = 115) and its correlation with graft survival (after excluding liver grafts with CIT > 15 h, n = 107). h Information on graft steatotic change was missing for 19 cases in this cohort. We confirmed that 33 patients received steatotic liver grafts. Low FGF21 in the graft was associated with elevated ALT and AST after transplantation. However, there was no significant difference in the non-steatotic subgroup (n = 55). I/R, ischemia/reperfusion; KO knockout, ALT alanine aminotransferase, AST aspartate aminotransferase, CIT cold ischemia time. p values are shown on the graphs. Source data are provided as a Source Data file. Figure 1a created with BioRender. com released under a Creative Commons Attribution-NonCommercial-NoDerivs 4.0 International license (https://creativecommons.org/licenses/by-nc-nd/4.0/deed.en).
Fig. 2
Fig. 2. FGF21 deficiency aggravated I/R-induced liver injury.
a The time-dependent western blot analysis (left) and quantification (right) of FGF21 protein expression in the mouse liver undergoing ischemia for 1.5 h followed by the indicated duration of reperfusion, three independent biological mice samples. b Schematic for the establishment of the mouse I/R injury model. c Serum ALT and AST levels of wild-type and Fgf21 KO mice in the sham and I/R groups 6 h after reperfusion (n = 5, per group). d Representative H&E staining of liver sections from wild-type and Fgf21 KO mice in the sham and I/R groups. e Liver damage was evaluated using Suzuki’s histological score (n = 5, per group). f Representative TUNEL immunofluorescent staining in liver lobes of wild-type and Fgf21 KO mice in the sham and I/R groups. g Quantification analysis of the TUNEL-positive cells/high-power field (n = 5, per group). h Volcano plot of the differentially expressed genes (DEGs) between wild-type and Fgf21 KO livers after I/R treatment (n = 4) using the absolute value of log2 (fold change) >1.5 and p < 0.05 as the thresholds. i KEGG pathway enrichment analysis of the identified DEGs. j Heatmap of major metabolites catalyzed by lipoxygenases in wild-type and Fgf21 KO livers after I/R treatment (n = 4). The 15-HETE content was elevated in Fgf21 KO livers. k Co-expression network and KEGG pathway analysis of the hub metabolites. l The Pearson correlation coefficients between ALOX15/15-HETE (RNA-seq/metabolomic) and the co-expression modules identified by WGCNA. KEGG analysis of the module with the highest correlation coefficients (p < 0.05 by Fisher’s exact test, two-sided). WT, wild-type, KO knockout, I/R ischemia/reperfusion, ALT alanine aminotransferase, AST aspartate aminotransferase. a, c, e, g, j Two-tailed t test. Statistic data are presented as the mean ± SD, error bars represent the means of at least three independent experiments. p values are shown on the graphs, p < 0.05 was considered statistically significant. Source data are provided as a Source Data file. Figure 2b created with BioRender. com released under a Creative Commons Attribution-NonCommercial-NoDerivs 4.0 International license (https://creativecommons.org/licenses/by-nc-nd/4.0/deed.en).
Fig. 3
Fig. 3. The regulatory role of ALOX15/15-HETE in the setting of hepatic I/R injury.
a The experimental schema for establishing the mouse I/R injury model. The mice were intravenously administered PD146176 (10 mg/kg) or 15-HETE (0.5 mg/kg). b The 15-HETE level in the livers of each group 6 h after reperfusion (n = 4, per group). c Serum ALT and AST levels for each group 6 h after reperfusion (n = 7, per group). d Representative H&E staining, ROS staining, TUNEL staining and MPO IHC staining of liver sections from each group and quantification assessment (n = 7, per group). I/R, ischemia/reperfusion, ALT alanine aminotransferase, AST aspartate aminotransferase, HE hematoxylin and eosin, ROS reactive oxygen species, DHE dihydroethidium, TUNEL Terminal deoxynucleotidyl transferase dUTP nick end labeling, MPO cytosolic myeloperoxidase. Two-tailed t-test. Statistic data are presented as the mean ± SD, error bars represent the means of at least three independent experiments. p values are shown on the graphs, p < 0.05 was considered statistically significant. Source data are provided as a Source Data file. Figure 3a created with BioRender. com released under a Creative Commons Attribution-NonCommercial-NoDerivs 4.0 International license (https://creativecommons.org/licenses/by-nc-nd/4.0/deed.en).
Fig. 4
Fig. 4. Deficiency of FGF21 exacerbated inflammation and activated an excessive innate immune response in mouse liver transplantation.
a Wild-type and Fgf21 KO donor livers in the mouse orthotopic liver transplantation model were harvested, stored for 30 min at 4 °C, and transplanted into wild-type recipient mice. b Serum ALT and AST levels for each group after transplantation (n = 4, per group). c The 15-HETE level in the livers of each group 6 h after reperfusion (n = 4, per group). d The FGF21 level in the serum of each group 6 h after reperfusion (n = 4, per group). e Representative TUNEL staining of liver sections from each group (n = 4, per group). f Heatmap showing the differential expression of 41 immune markers in 34 cell clusters. g Two-dimensional t-SNE illustration of the CyTOF data of livers isolated from WT >> WT and KO >> WT (n = 4/group), the merged t-SNE graph was used for contrast. hj The frequencies of the identified clusters in granulocytes, Mono/Mac cells and NK cells and the comparisons between the groups (n = 4, per group), boxplot shows the median (center line), 25th, and 75th percentile (lower and upper boundary), and the whiskers are essentially range bars that extend to max and min values. k Multiplex immunohistochemistry staining of NK1.1 (green), CD62L (red) and DAPI (blue) in Fgf21 KO-transplanted livers, three independent biological mice samples. Scale bar, 50 μm. OLT orthotopic liver transplantation, WT wild-type, KO knockout, ALT, alanine aminotransferase, AST aspartate aminotransferase, TUNEL Terminal deoxynucleotidyl transferase dUTP nick end labeling, Mono/Mac monocyte/macrophage, NK natural killer. Two-tailed t-test. Statistic data are presented as the mean ± SD, error bars represent the means of at least three independent experiments. p values are shown on the graphs, p < 0.05 was considered statistically significant. Source data are provided as a Source Data file. Figure 4a created with BioRender. com released under a Creative Commons Attribution-NonCommercial-NoDerivs 4.0 International license (https://creativecommons.org/licenses/by-nc-nd/4.0/deed.en).
Fig. 5
Fig. 5. Treatment with rmFGF21 relieved I/R-induced hepatocellular injury.
a Experimental schema for establishing the I/R injury mouse model. The mice were intravenously administered rmFGF21 (0.5 mg/kg). b Serum ALT and AST levels 6 h after reperfusion (n = 5, per group). c Comparison of serum FGF21 levels 6 h after reperfusion (n = 5, per group). d H&E staining of liver sections 6 h after reperfusion (n = 5, per group). e Western blot analysis (left) and quantification (right) of FGF21and BAX in AML12 from each group. f Western blot analysis (left) and quantification (right) of ALOX15, BAX and p-ERK1/2 in AML12 from each group. g Western blot analysis (up) and quantification (down) of ALOX15, BAX and p-FGFR4 in AML12 from each group. eg three independent biological mice samples. I/R ischemia/reperfusion, ALT alanine aminotransferase, AST aspartate aminotransferase, H/R hypoxia/ reoxygenation. Two-tailed t-test. Statistic data are presented as the mean ± SD, error bars represent the means of at least three independent experiments. p values are shown on the graphs, p < 0.05 was considered statistically significant. Source data are provided as a Source Data file. Figure 5a created with BioRender. com released under a Creative Commons Attribution-NonCommercial-NoDerivs 4.0 International license (https://creativecommons.org/licenses/by-nc-nd/4.0/deed.en).
Fig. 6
Fig. 6. FGF21 deficiency further deteriorated I/R injury in steatotic livers.
a IHC staining for FGF21 in pre-transplant biopsies from the steatotic liver grafts in Cohort 3 (n = 78). b Comparison of the degree of hepatic steatosis between the low FGF21 group and the high FGF21 group. c Comparison of maximal serum ALT/AST within 7 days after transplantation between the low FGF21 group and the high FGF21 group. d Comparison of FGF21 staining (mean integrated optical density, IOD) between patients who did and did not develop EAD. e Schematic for the establishment of the I/R injury model using mice fed a high-fat diet (HFD) or normal chow diet. After 8 weeks of feeding, mice were subjected to I/R treatment. f Serum ALT and AST 6 hours after reperfusion (n = 5, per group). g 15-HETE content in the livers from each group 6 h after reperfusion (n = 5, per group). h H&E staining, ROS staining and TUNEL staining of liver sections from each group 6 h after reperfusion (n = 5, per group). i Quantification assessment of infiltrating CD11b+ and MPO+ cells in the livers from each group (n = 5, per group). I/R ischemia/reperfusion, WT wild-type, KO knockout, HFD high-fat diet, ALT alanine aminotransferase, AST aspartate aminotransferase, HE hematoxylin and eosin, ROS reactive oxygen species, DHE dihydroethidium, TUNEL terminal deoxynucleotidyl transferase dUTP nick end labeling, MPO cytosolic myeloperoxidase. Two-tailed t-test. Statistic data are presented as the mean ± SD, error bars represent the means of at least three independent experiments. p values are shown on the graphs, ns, not significant, p < 0.05 was considered statistically significant. Source data are provided as a Source Data file. Figure 6e created with BioRender. com released under a Creative Commons Attribution-NonCommercial-NoDerivs 4.0 International license (https://creativecommons.org/licenses/by-nc-nd/4.0/deed.en).
Fig. 7
Fig. 7. The ALOX15-15-HETE axis in I/R injury in steatotic livers.
a The steatotic mouse models were treated with AAV8-TBG-Alox15 shRNA (shAlox15) or PD146176 prior to I/R treatment. b 15-HETE content in the livers from the Sham group, Control group and shAlox15 group 6 h after reperfusion (n = 6, per group). c Serum ALT and AST levels for the Sham group, Control group and shAlox15 group 6 h after reperfusion (n = 6, per group). d H&E staining of liver sections from the Sham group, Control group and shAlox15 group 6 h after reperfusion (n = 6, per group). e TUNEL immunofluorescent staining in liver lobes of the Sham group, Control group and shAlox15 group 6 h after reperfusion (n = 6, per group). f CD11b and MPO IHC staining of liver sections from the Sham group, Control group and shAlox15 group 6 h after reperfusion (n = 6, per group). g 15-HETE content in the livers from the Sham group, Control group and PD146176 group 6 h after reperfusion (n = 5, per group). h Serum ALT and AST levels of the Sham group, Control group and PD146176 group 6 h after reperfusion (n = 5, per group). i H&E staining of liver sections from the Sham group, Control group and PD146176 group 6 h after reperfusion (n = 5, per group). j TUNEL immunofluorescent staining in liver lobes of the Sham group, Control group and PD146176 group 6 h after reperfusion (n = 5, per group). k CD11b and MPO IHC staining of liver sections from the Sham group, Control group and PD146176 group 6 h after reperfusion (n = 5, per group). I/R, ischemia/reperfusion; WT, wild-type; KO, knockout; HFD, high-fat diet; ALT, alanine aminotransferase; AST, aspartate aminotransferase; HE, hematoxylin and eosin; TUNEL, terminal deoxynucleotidyl transferase dUTP nick end labeling; MPO, cytosolic myeloperoxidase. Two-tailed t-test. Statistic data are presented as the mean ± SD, error bars represent the means of at least three independent experiments. p values are shown on the graphs, p < 0.05 was considered statistically significant. Source data are provided as a Source Data file. Figure 7a created with BioRender. com released under a Creative Commons Attribution-NonCommercial-NoDerivs 4.0 International license (https://creativecommons.org/licenses/by-nc-nd/4.0/deed.en).
Fig. 8
Fig. 8. Transgenic overexpression of hepatic Fgf21 or administration of rmFGF21 alleviated hepatic I/R injury in steatotic livers.
a The steatotic mouse models underwent intravenous injection of rmFGF21 (0.5 mg/kg) or tail vein injection of AAV8-hAAT-Fgf21 before I/R injury. b 15-HETE content in the livers from each group 6 h after reperfusion (n = 4, per group). c Serum ALT and AST 6 h after reperfusion (n = 5, per group). d H&E staining, ROS staining and TUNEL staining and quantification results of liver sections from each group 6 h after reperfusion (n = 5, per group). e Quantification assessment of infiltrating CD11b+ and MPO+ cells in the livers of each group (n = 5, per group). f The general schematic diagram. LT, liver transplantation; AA, arachidonic acid. I/R, ischemia/reperfusion; HFD, high-fat diet; ALT, alanine aminotransferase; AST, aspartate aminotransferase; HE, hematoxylin and eosin; ROS, reactive oxygen species; DHE, dihydroethidium; TUNEL, terminal deoxynucleotidyl transferase dUTP nick end labeling; MPO, cytosolic myeloperoxidase. Two-tailed t-test. Statistic data are presented as the mean ± SD, error bars represent the means of at least three independent experiments. p values are shown on the graphs, p < 0.05 was considered statistically significant. Source data are provided as a Source Data file. Figure 8a, f created with BioRender. com released under a Creative Commons Attribution-NonCommercial-NoDerivs 4.0 International license (https://creativecommons.org/licenses/by-nc-nd/4.0/deed.en).

References

    1. Wang, K. et al. Severity of early allograft dysfunction following donation after circulatory death liver transplantation: a multicentre study. Hepatobiliary Surg. Nutr.10, 10.21037/hbsn.2019.09.02 (2021). - PMC - PubMed
    1. Agopian, V. et al. Multicenter validation of the liver graft assessment following transplantation (L-GrAFT) score for assessment of early allograft dysfunction. J. Hepatol.10.1016/j.jhep.2020.09.015 (2020). - PubMed
    1. Bastos-Neves, D., Salvalaggio, P. Rd. O. & Almeida, M. D. Risk factors, surgical complications and graft survival in liver transplant recipients with early allograft dysfunction. Hepatobiliary Pancreatic Dis. Int.18, 423–429 (2019). - DOI - PubMed
    1. Hirao, H., Nakamura, K. & Kupiec-Weglinski, J. W. Liver ischaemia-reperfusion injury: a new understanding of the role of innate immunity. Nat. Rev. Gastroenterol. Hepatol.10.1038/s41575-021-00549-8 (2021). - PubMed
    1. Li, Z.-W. & Wang, L. The role of liver sinusoidal endothelial cells in liver remodeling after injury. Hepatobiliary Pancreatic Dis. Int.22, 22–27 (2023). - DOI - PubMed

Publication types

MeSH terms

Substances

LinkOut - more resources