. 2024 Oct 3;15(1):8571.
doi: 10.1038/s41467-024-52826-0.

Lack of SMARCB1 expression characterizes a subset of human and murine peripheral T-cell lymphomas

Affiliations

Lack of SMARCB1 expression characterizes a subset of human and murine peripheral T-cell lymphomas

Anja Fischer et al. Nat Commun. .

Abstract

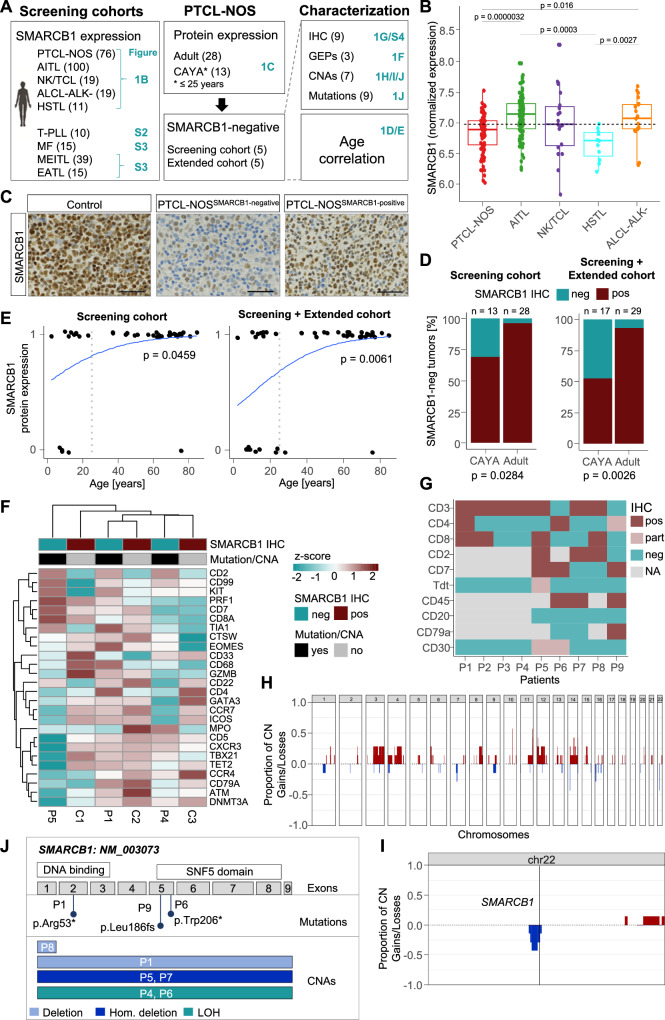
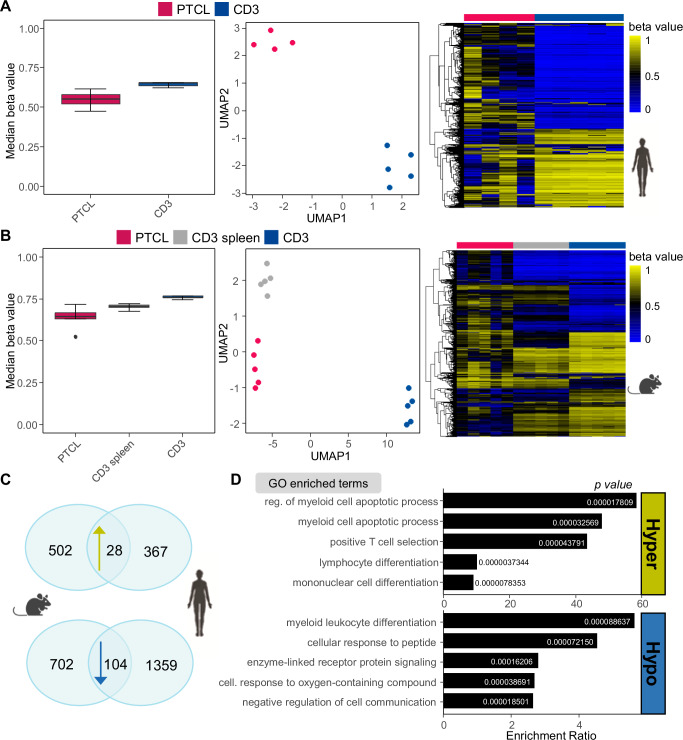
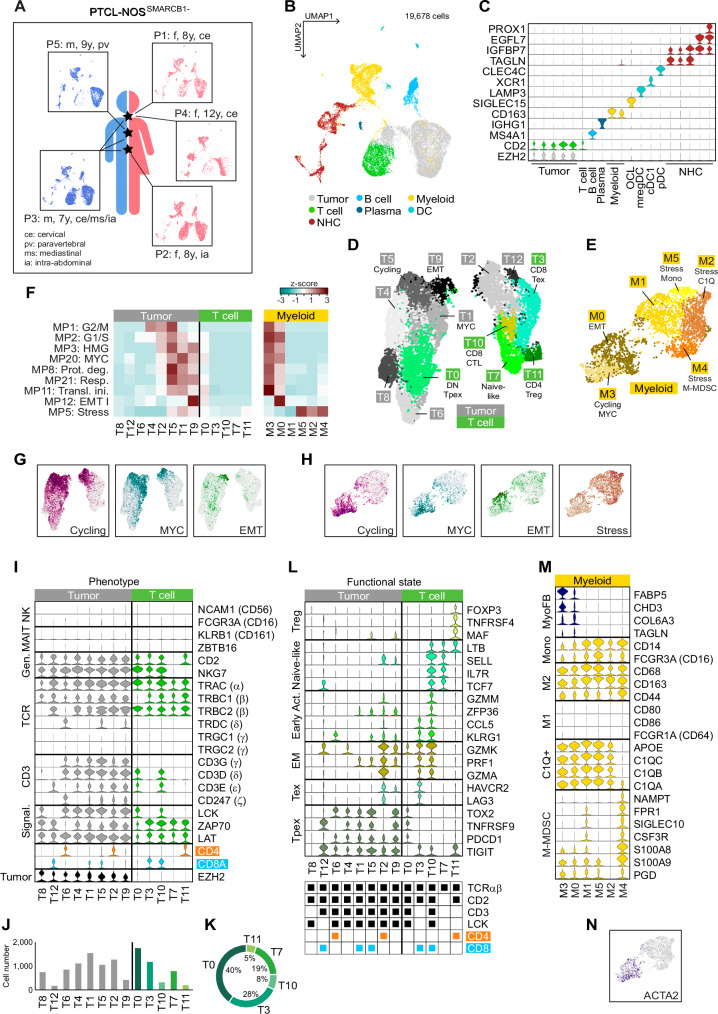
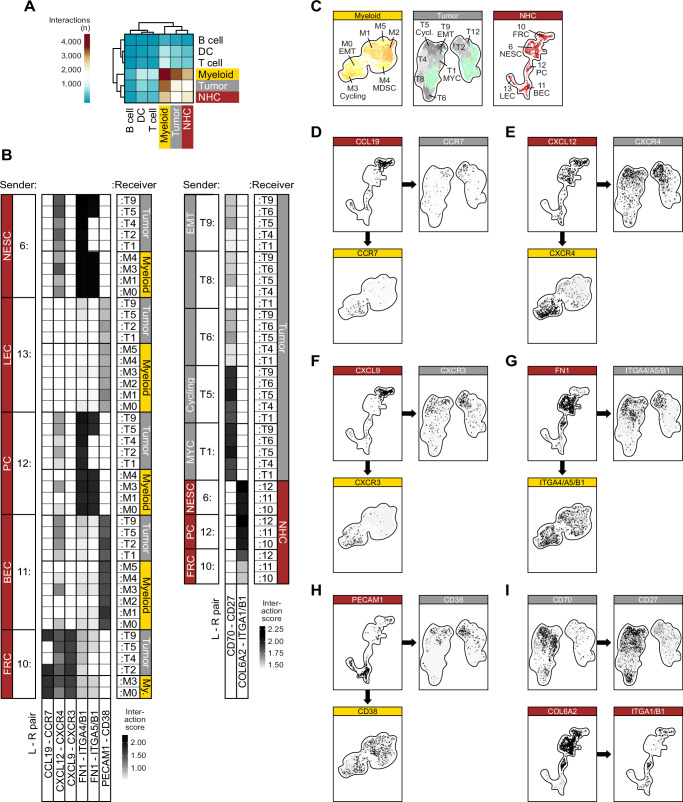
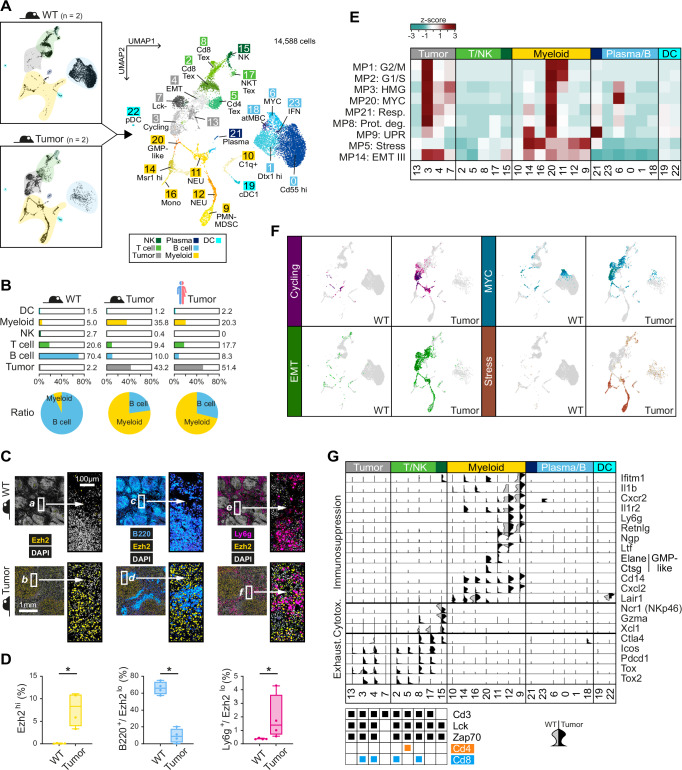
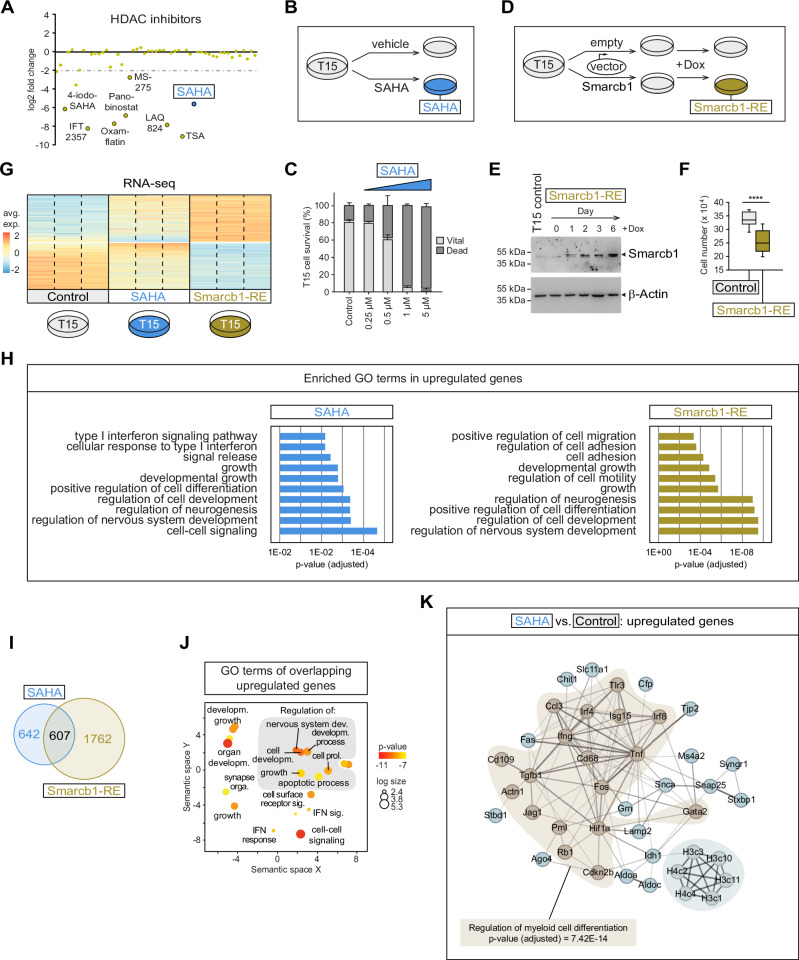
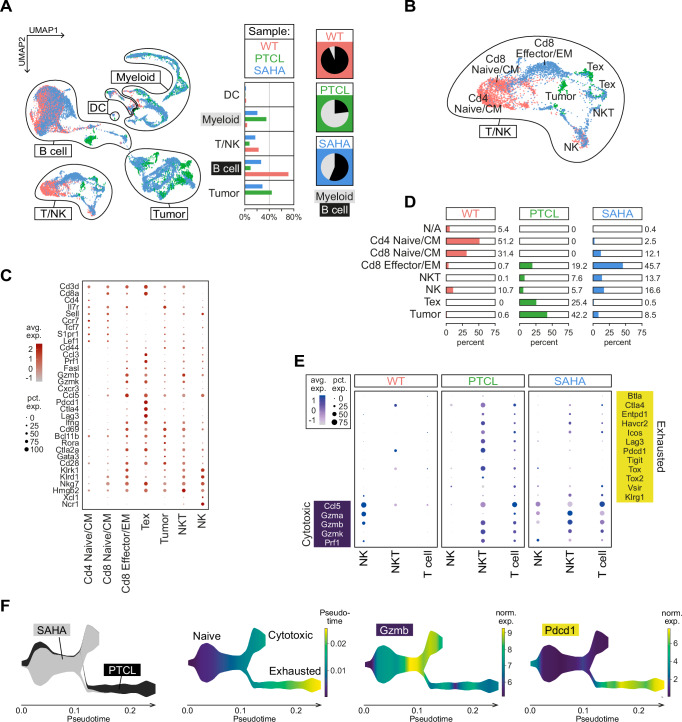
Peripheral T-cell lymphoma, not otherwise specified (PTCL-NOS) is a heterogeneous group of malignancies with poor outcome. Here, we identify a subgroup, PTCL-NOSSMARCB1-, which is characterized by the lack of the SMARCB1 protein and occurs more frequently in young patients. Human and murine PTCL-NOSSMARCB1- show similar DNA methylation profiles, with hypermethylation of T-cell-related genes and hypomethylation of genes involved in myeloid development. Single-cell analyses of human and murine tumors revealed a rich and complex network of interactions between tumor cells and an immunosuppressive and exhausted tumor microenvironment (TME). In a drug screen, we identified histone deacetylase inhibitors (HDACi) as a class of drugs effective against PTCL-NOSSmarcb1-. In vivo treatment of mouse tumors with SAHA, a pan-HDACi, triggered remodeling of the TME, promoting replenishment of lymphoid compartments and reversal of the exhaustion phenotype. These results provide a rationale for further exploration of HDACi combination therapies targeting PTCL-NOSSMARCB1- within the TME.


Conflict of interest statement

The authors declare no competing interests.

Figures

Fig. 1
Fig. 1. Thirty-one percent of PTCL-NOS are SMARCB1-negative in pediatric and young patients.
A Overview of patient cohorts and methods for genetic characterization of patients with T-cell lymphomas and exact patient number for each cohort. B SMARCB1 RNA expression in samples from the TENOMIC study (n = 225). Normalized expression is shown. The dashed line represents the median expression value of all subgroups. Wilcoxon test (two-sided), all significant adjusted p values (Benjamini–Hochberg) are indicated. Boxplot settings: middle, median; lower hinge, 25% quantile; upper hinge, 75% quantile; upper/lower whisker, largest/smallest observation less/greater than or equal to upper/lower hinge ±1.5 × IQR. C Immunohistochemistry of SMARCB1. Exemplary images of sections from SMARCB1-positive and negative human PTCL-NOS cases compared to control tissue (tonsils). Scale bars: 50 µm. The experiment was performed for five SMARCB1-negative lymphomas. D 31% of PTCL-NOS patients under 25 years old (CAYA) (n = 4/13) and 3.6% of adults (n = 1/28) present loss of SMARCB1 protein expression. Fisher’s exact test (two-sided), *p = 0.0284. Adding the extended cohort, 47% (n = 8/17) of CAYA patients and 7% (n = 2/29) of adults were negative for SMARCB1 expression. Fisher’s exact test, *p = 0.0026. Protein expression was evaluated using IHC. E Correlation of SMARCB1 protein expression and age in PTCL-NOS patients. Protein expression was evaluated using IHC. Negative cases with no SMARCB1 expression are labeled with ‘0’ while cases with complete or partial SMARCB1 expression are labeled with 1. Data is shown for 42 patients (14 CAYA patients, 28 adults). Wald test from binomial generalized linear model (two-sided), *p value = 0.0459. Adding the extended cohort, the p value decreases to 0.0061. F Transcriptomic profiling of three SMARCB-negative PTCL-NOS patient samples (patient 1, 4, and 5) and three control SMARCB1-positive PTCL-NOS samples (C1-3). HTG transcriptome panel was used and normalized gene expression is shown for genes connected to PTCL-NOS subtypes. G Immunohistochemical characterization of nine SMARCB1-negative cases. H, I Copy number profiling of seven SMARCB1-negative cases using OncoScan. The proportion of gains and losses is shown for all autosomes (H) and chromosome 22 in detail (I). J Summary of copy number and mutational profiling in nine SMARCB1-negative cases. Source data of B, D and E are provided as a Source Data file. A Created with BioRender.com released under a Creative Commons Attribution-NonCommercial-NoDerivs 4.0 International license. PTCL-NOS Peripheral T cell lymphoma not otherwise specified, AITL Angioimmunoblastic T cell lymphoma, NKTCL Natural killer/ T cell lymphoma, HSTL Hepatosplenic T cell lymphoma, ALCL-ALK- ALK-negative anaplastic large cell lymphoma, T-PLL T-cell prolymphocytic leukemia, MF mycosis fungoides, MEITL monomorphic epitheliotropic intestinal T cell lymphoma, EATL enteropathy-associated T-cell lymphoma, CAYA children adolescents and young adults, IHC immunohistochemistry, GEPs gene expression profiles, CNAs copy number alterations, pos positive, neg negative, part partial expression, P1-9 patient 1–9, hom homozygous, LOH loss of heterozygosity.
Fig. 2
Fig. 2. Human and murine SMARCB1-deficient PTCLs share common methylation profiles.
A Median global DNA methylation in human PTCLs (n = 4) and CD3 T cells (n = 5). UMAP analysis based on the 10,000 most variable CpGs and 5 neighbors. Heatmap showing 10,000 most variable CpGs. Boxplot settings: middle, median; lower hinge, 25% quantile; upper hinge, 75% quantile; upper/lower whisker, largest/smallest observation less/greater than or equal to upper/lower hinge ±1.5 × IQR. B Median global DNA methylation in murine PTCLs (n = 5), splenic cells (n = 5) and Cd3 T cells (n = 5). UMAP analysis based on the 10,000 most variable CpGs and 5 neighbors. Heatmap showing 10,000 most variable CpGs. Boxplot settings: middle, median; lower hinge, 25% quantile; upper hinge, 75% quantile; upper/lower whisker, largest/smallest observation less/greater than or equal to upper/lower hinge ±1.5 × IQR. C Overlap of genes hyper- or hypomethylated in murine in human PTCLs compared to Cd3 T cells. Hypomethylated cutoff: σ/σmax > 0.4, q < 0.01, Hypermethylated cutoff: σ/σmax > 0.4, q < 1e-5. D Biological process-associated GO terms assigned to concordantly hyper- and hypomethylated genes in PTCLs compared to Cd3 T cells. Over-representation analysis was performed using WebGestalt (https://2024.webgestalt.org/) with adjustment for multiple testing (Benjamini–Hochberg) (Table S9). Only gene sets with more than 10 genes were considered. (x axis, Enrichment ratio). Source data of AD are provided as a Source Data file. AC Created with BioRender.com released under a Creative Commons Attribution-NonCommercial-NoDerivs 4.0 International license.
Fig. 3
Fig. 3. Single-cell landscape of human PTCL-NOSSMARCB1-.
A Overview of the five patient samples P1-P5 with information on gender, age, and tumor location. B Uniform manifold approximation and projection (UMAP) plot of the integrated scRNA-seq dataset. C Violin plot showing expression of cell type-specific marker genes in individual clusters. OCL osteoclast, DC dendritic cell, pDC plasmacytoid DC, cDC1 conventional type 1 DC, mregDC mature DC enriched in immunoregulatory molecules, NHC non-hematopoietic cell. D UMAP plot of the Tumor/T-cell subset and (E) the Myeloid subset after re-clustering. F Heatmap showing overlaps of cluster-specific DEG sets with signatures of cancer hallmark metaprograms. Z-scores were calculated on a row-by-row basis. G Averaged expression levels of the identified gene signatures of tumor cell clusters T5 (Cycling), T1 (MYC) and T9 (EMT), and (H) of myeloid clusters M3 (Cycling and MYC), M0 (EMT) and M2/4/5 (Stress). I Classification of tumor and T-cell clusters. NK natural killer cell, MAIT mucosal-associated invariant T-cells, Gen. generic T-cell marker, TCR T-cell receptor, Signal. TCR signaling. J Cell numbers of the individual tumor clusters (gray bars) or T-cell clusters (green bars), and K relative proportions of T-cell clusters as a circular diagram. L Different functional states of the tumor and T-cell clusters based on marker gene expression. Treg regulatory T-cell, Early Act. early activation state, EM effector memory T-cell, Tex terminally exhausted state, Tpex precursor-exhausted state. M Immunosuppressive features within the Myeloid subset. MyoFB myofibroblasts, Mono monocytes, M1/2 M1/2 polarization, M-MDSC mononuclear myeloid-derived suppressor cells. N ACTA2 expression in the Myeloid subset. Source data of J and K are provided as a Source Data file. A Created with BioRender.com released under a Creative Commons Attribution-NonCommercial-NoDerivs 4.0 International license.
Fig. 4
Fig. 4. Cell-cell communication in the tumor niche.
A Heatmap showing the number of significant ligand-receptor pairs for each cellular compartment. B Heatmap showing selected ligand-receptor (L-R) pairs for interactions of sender clusters (left) and receiver clusters (right). The greyscale indicates interaction score values. C Overview maps of the participating clusters within the three analyzed compartments. DI Feature plots showing the average expression values of the displayed L-R pairs in the respective compartments.
Fig. 5
Fig. 5. Murine PTCL-NOSSmarcb1− recapitulates key features of human tumors.
A UMAP plot showing 24 clusters of the integrated scRNA-seq dataset from two control spleen samples (WT) and two PTCL-NOSSmarcb1− tumor samples. B Relative abundance of different cell types in murine WT spleens (left), PTCL spleens (middle), and human tumors (right; NB: in order to ensure comparability, the stromal cells were removed before quantification). The pie charts in the lower part show the ratio between B-cells and myeloid cells. C Multiplex immunofluorescence (IF) images of FFPE sections of murine PTCL-NOSSmarcb1− and control spleen samples (WT: upper panels; tumor: lower panels). For better visualization, the white boxed areas (a to f) are enlarged (2.5x; scale bar = 100 µm). DAPI (gray) provides a nuclear counterstain, Ezh2 (yellow) defines malignant cells (Ezh2hi), B220 (blue) is used as a pan B-cell marker (B220+), and Ly6g (pink) as a marker for neutrophils (Ly6g+). D Quantitative analysis of IF images from (C). Four representative regions of interest (ROIs; size: 1500 × 1500 µm) were selected and analyzed for mouse WT and Tumor samples. A Wilcoxon-Mann-Whitney test was calculated to determine if there are differences between WT and Tumor samples for all comparisons (*p = 0.0286). Boxplot settings: middle, median; lower hinge, 25% quantile; upper hinge, 75% quantile; upper/lower whisker, largest/smallest observation less/greater than or equal to upper/lower hinge ±1.5 * IQR. E The heatmap shows the overlap between cluster-specific DEG lists and the cancer hallmark metaprograms. F Signature plots of the programs Cycling, MYC, EMT and Stress in cells from WT (left) and tumor (right) samples. G A split violin plot (left/gray half: WT; right/black half: tumor) illustrates the increase in T-cell exhaustion features (Exhaust.) with a simultaneous decrease in NK cytotoxicity (Cytotox.) markers (e.g., Ncr1/NKp46) as well as infiltration of immunosuppressive myeloid cells in tumor versus WT samples. Source data of B and D are provided as a Source Data file. B Created with BioRender.com released under a Creative Commons Attribution-NonCommercial-NoDerivs 4.0 International license.
Fig. 6
Fig. 6. SAHA treatment recapitulates Smarcb1 re-expression in PTCL-NOSSmarcb1.
A Effect of HDAC inhibitors on the viability of T15 cells versus seven non-Hodgkin lymphoma (NHL) cell lines. Cells were treated twice with 1 µM inhibitor over the course of five days and measured using an MTT assay. T15 cell viability was set in relation to NHL cells and is shown as log2 fold change. B Scheme of SAHA treatment. C Dosage-dependent cytotoxic effects of SAHA on T15 cells (n = 4 biological replicates; data are presented as means +/– SD). D Scheme of Smarcb1 re-expression (Smarcb1-RE). T15 cells were transduced with an empty control vector or a Smarcb1 expression vector and induced by doxycycline (Dox; 0.5 μg/μl). E Representative immunoblots showing Dox-induced Smarcb1 re-expression. Beta-actin serves as a loading control. F Effect of Smarcb1 re-expression on T15 cell growth. The boxplots show median (center line), first and third quartile (bounds) and minima/maxima (whiskers) of Dox-treated (0.5 µg/µl; 72 h) T15 control and Smarcb1-RE cells (n = 3 biological replicates; paired two-sided T test; ****p = 2.17E-05). Boxplot settings: middle, median; lower hinge, 25% quantile; upper hinge, 75% quantile; upper/lower whisker, largest/smallest observation less/greater than or equal to upper/lower hinge ±1.5 × IQR. G RNA sequencing (RNA-seq) analysis of T15 control cells, SAHA-treated (1 µM, 72 h) cells or Dox-induced (0.5 µg/µl, 72 h) Smarcb1-RE cells (3 biological replicates each). The heatmap shows the averaged gene expression values (avg. exp.) of significantly up- and down-regulated genes. H ToppGene (https://toppgene.cchmc.org/) was used to determine significantly enriched gene ontology (GO) terms associated with upregulated genes in SAHA or Smarcb1-RE cells. Shown are p values adjusted for multiple testing (Benjamini–Hochberg). I Venn diagram showing the overlap of SAHA and Smarcb1-RE upregulated genes. J GO analysis of overlapping genes using REVIGO. The dot plot shows cluster representatives based on semantic similarities, where dot color indicates ToppGene-derived p values and dot size the frequency of the GO term in the underlying database. K Functional gene network analysis using STRING, showing that SAHA treatment regulates genes involved in myeloid cell differentiation (p value adjusted for multiple testing using Benjamini–Hochberg). Source data of A, C, E, F and HK are provided as a Source Data file.
Fig. 7
Fig. 7. SAHA treatment remodels the tumor microenvironment of PTCL-NOSSmarcb1 and reduces the exhaustion phenotype in vivo.
A Left: UMAP visualization of the integrated single-cell transcriptomes from control (WT), untreated, and SAHA-treated PTCL spleens (each n = 2 samples; 11,090 cells in total), Middle: relative contribution of different cellular compartments in the three sample groups; Right: pie charts showing the ratio between B-cells and myeloid cells in the three sample groups. B Expanded view of the T/NK cell compartment with a more detailed cell type annotation based on the dot plot shown in (C). D Proportions of distinct T/NK cell type subsets in the three sample groups. CM central memory T-cell, EM effector memory T-cell, Tex terminally exhausted T-cell, N/A unassigned cells. E Dot plot showing average expression levels (avg. exp.) and proportions of cells (pct. exp.) expressing exhaustion or cytotoxic marker genes in T-, NK and NKT cells from control, PTCL and SAHA-treated samples. F Trajectory analysis of Cd8+ T-cell clusters of untreated and SAHA-treated PTCL samples using STREAM. Stream plot visualization of (from left to right): sample contribution (untreated = PTCL, black; treated = SAHA, gray), inferred phenotype and normalized expression (norm. exp.) of the cytotoxicity marker Gzmb and the exhaustion marker Pdcd1 (PD-1) along the pseudotime axis. Source data of D are provided as a Source Data file.

References

    1. Fiore, D. et al. Peripheral T cell lymphomas: from the bench to the clinic. Nat. Rev. Cancer20, 323–342 (2020). - PubMed
    1. Laurent, C. et al. Impact of expert pathologic review of lymphoma diagnosis: study of patients from the french lymphopath network. J. Clin. Oncol.35, 2008–2017 (2017). - PubMed
    1. Broccoli, A. & Zinzani, P. L. Peripheral T-cell lymphoma, not otherwise specified. Blood129, 1103–1112 (2017). - PubMed
    1. Au-Yeung, R. K. H. et al. Molecular features of non-anaplastic peripheral T-cell lymphoma in children and adolescents. Pediatr. Blood Cancer68, e29285 (2021). - PubMed
    1. Alaggio, R. et al. The 5th edition of the World Health Organization Classification of Haematolymphoid Tumours: lymphoid Neoplasms. Leukemia36, 1720–1748 (2022). - PMC - PubMed

Publication types

MeSH terms

Associated data