. 2024 Oct 3;15(1):8572.
doi: 10.1038/s41467-024-52595-w.

Targeting Pseudomonas aeruginosa biofilm with an evolutionary trained bacteriophage cocktail exploiting phage resistance trade-offs

Affiliations

Targeting Pseudomonas aeruginosa biofilm with an evolutionary trained bacteriophage cocktail exploiting phage resistance trade-offs

Fabian Kunisch et al. Nat Commun. .

Abstract

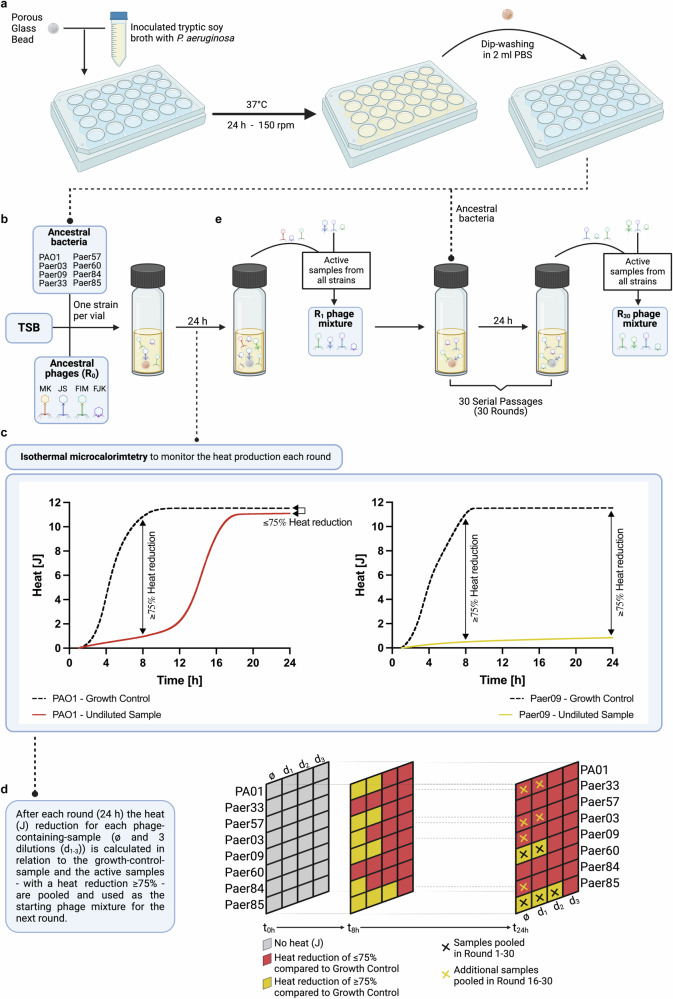
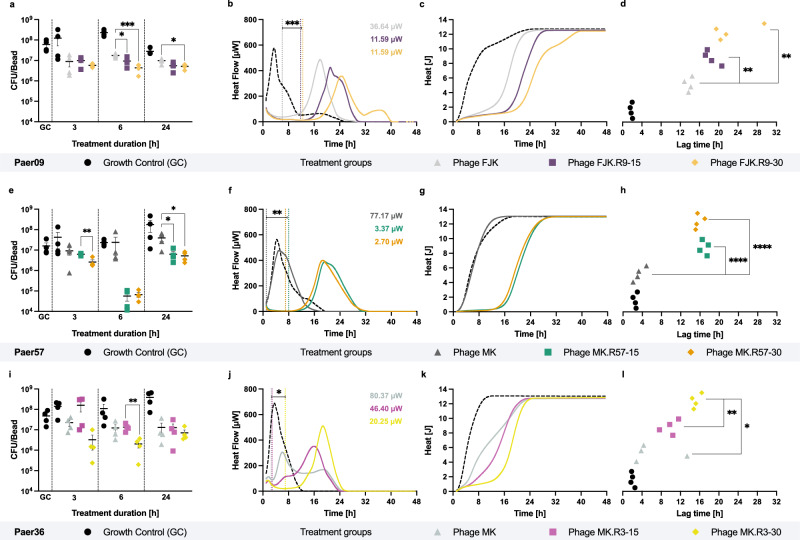
Spread of multidrug-resistant Pseudomonas aeruginosa strains threatens to render currently available antibiotics obsolete, with limited prospects for the development of new antibiotics. Lytic bacteriophages, the viruses of bacteria, represent a path to combat this threat. In vitro-directed evolution is traditionally applied to expand the bacteriophage host range or increase bacterial suppression in planktonic cultures. However, while up to 80% of human microbial infections are biofilm-associated, research towards targeted improvement of bacteriophages' ability to combat biofilms remains scarce. This study aims at an in vitro biofilm evolution assay to improve multiple bacteriophage parameters in parallel and the optimisation of bacteriophage cocktail design by exploiting a bacterial bacteriophage resistance trade-off. The evolved bacteriophages show an expanded host spectrum, improved antimicrobial efficacy and enhanced antibiofilm performance, as assessed by isothermal microcalorimetry and quantitative polymerase chain reaction, respectively. Our two-phage cocktail reveals further improved antimicrobial efficacy without incurring dual-bacteriophage-resistance in treated bacteria. We anticipate this assay will allow a better understanding of phenotypic-genomic relationships in bacteriophages and enable the training of bacteriophages against other desired pathogens. This, in turn, will strengthen bacteriophage therapy as a treatment adjunct to improve clinical outcomes of multidrug-resistant bacterial infections.


Conflict of interest statement

P.E.T. declares a conflict of interest as cofounder of Felix Biotechnology, Inc., a company that seeks to develop phages for human therapy. The other authors declare no competing interests.

Figures

Fig. 1
Fig. 1. Experimental design of the antibiofilm evolution assay.
Experimental setup of the evolution assay to extend the host range and improve the antimicrobial and antibiofilm activity of bacteriophages (phages). a Biofilm formation on porous glass beads by incubation with P. aeruginosa in tryptic soy broth (TSB) under agitation and 37 °C. Dip-washing of beads with 24 h pre-established biofilm in sterile phosphate-buffered saline (PBS) before transferal into the calorimetric ampules. b Representation of one calorimetric ampule containing a 24 h pre-stablished biofilm bead of one P. aeruginosa strain in TSB and the phage mixture at round 0 (R0) containing the four ancestral phages. A total of 43 ampules (one growth control and four phage mixture dilutions per strain and three sterility controls) were used during each round of evolution. c Heat production (J) was recorded for each individual ampule by isothermal calorimetry during 24 h. d At the end of each round, the percentage heat reduction of phage-containing ampules relative to growth control ampules was determined at a 24 h (rounds 1–15) or 8 h (rounds 16–30) time point. Samples showing a heat reduction equal or above 75% (referred to as active samples) were selected and pooled together with the undiluted phage samples (always included) into the new phage mixture. e Across all eight bacterial strains, the undiluted and the active samples after each round were pooled together, creating the phage mixture that served as starting point for the next round, and hence was added to pre-stablished biofilm beads anew. In total, 30 rounds of evolution were performed. Figure 1 was created with BioRender.com and released under a Creative Commons Attribution-NonCommercial-NoDerivs 4.0 International license (https://creativecommons.org/licences/by-nc-nd/4.0/deed.en).
Fig. 2
Fig. 2. Host range analysis of unevolved and evolved phages.
a Phylogenetic tree based on the core genes (3,667 of 19,556 genes) of the P. aeruginosa strain collection (80 strains) encompassing four genomic clusters (Cluster 1, black branch, 71.3%; Cluster 2, blue branch, 25.0%; Cluster 3, violet branch, 1.3%; Cluster 4, green branch, 2.5%). Classification of each strain according to its resistance profile (4MRGN, red lettering; 3MRGN, blue lettering; MRGN, multi-resistance Gram-negative). Strains marked with an asterisk were included in the experimental evolution. Activity determination of the unevolved (dark grey) and evolved (R15, blue; R30, green) phages against the bacterial collection by spot assay overlay (heat map). b Percentual (white lettering) and absolute (black lettering) infectivity of each phage among the bacterial collection. Vertical dotted line represents the percentage of bacterial strains susceptible to at least one phage (62.5%). 37.5% (30 strains) of bacterial strains were not susceptible to any phage (CRS, completely resistant strains). c Representation of the infectivity gains and losses of the evolved phages. An infectivity gain (yellow bar) is defined as the capability of an evolved phage to infect a bacterial strain that was initially not susceptible to the phage’s genomically closest unevolved progenitor phage. A loss of infectivity (red bar) occurred when a bacterial strain is susceptible to the unevolved ancestral phage but resistant to the corresponding evolved phage. d Representation of the cumulated infectivity gains of the evolved phages among the evolution strains (ES) or all strains (AS, excluding the ES and CRS). Among the ES (n = 8), three strains (stacked blue boxes, numbers at the side of the boxes indicate the infectivity gains on the according strain) resulted in 14 infectivity gains (Paer85, 8 gains; PAO1, 4 gains; Paer09, 2 gains). The 53 infectivity gains among AS (n = 42) correspond to gains on 22 strains (stacked grey boxes, numbers at the side of the boxes indicate the infectivity gains on the according strain). For direct comparability of the two strain populations (ES and AS), the cumulated values were divided by the number of strains in each group, resulting in averaged gains per strain (yellow circles).
Fig. 3
Fig. 3. Antibiofilm and antimicrobial activity of unevolved and evolved phages.
a qPCR-determined bacterial load (CFU/bead) of 24 h pre-established Paer09 (included in the evolution) biofilm untreated (GC) and after co-incubation (3, 6 and 24 h) with phage FJK (unevolved), FJK.R9-15 (15 rounds of evolution) and FJK.R9-30 (30 rounds of evolution). The p-values are 0.0365 (6 h, FJK vs. FJK.R9-15), 0.0010 (6 h, FJK vs. FJK.R9-30) and 0.0242 (24 h, FJK vs. FJK.R9-30). b Heat flow (µW) curves measured for 48 h of Paer09 biofilm co-incubated with phage FJK, FJK.R9-15, FJK.R9-30, or untreated (GC, dashed line). Vertical dotted lines indicate the minimum heat flow (µW values in the right upper corner) detected in each treated sample, related to the highest suppressive effect of the phage on bacterial cells. The p-value is 0.0004 (FJK vs. FJK.R9-15/30). c, d Respective heat (J) curves of phage-treated Paer09 biofilm and the calculated suppression time for each tested condition. The p-values are 0.0014 (FJK vs. FJK.R9-15) and 0.0085 (FJK vs. FJK.R9-30). Identical setup for Paer57 (included in the evolution) treated with phage MK, MK.R57-15, MK.R57-30 or untreated (GC). The p-values are 0.0032 (e, 3 h, MK.R57-15 vs. MK.R57-30), 0.0493 (e, 24 h, MK vs. MK.R57-15), 0.0431 (e, 24 h, MK vs. MK.R57-30), 0.0056 (f, MK vs. MK.R57-15), 0.0053 (f, MK vs. MK.R57-30) and <0.0001 (h, MK vs. MK.R57-15/30). Identical setup for Paer36 (not included in the evolution) treated with phage MK, MK.R3-15, MK.R3-30 or untreated (GC). The p-values are 0.0067 (i, 6 h, MK.R3-15 vs. MK.R3-30), 0.0182 (j, MK vs. MK.R3-30), 0.0369 (j, MK.R3-15 vs. MK.R3-30), 0.0105 (l, MK vs. MK.R3-30) and 0.0012 (l, MK.R3-15 vs. MK.R3-30). All experiments were conducted in fourfold and the curves (b, c, f, g, j, k) display the mean. The error bars represent the standard error of the mean. Statistical analysis was conducted by unpaired two-tailed Student’s t test and p-values indicated with asterisks (*, p = <0.05; **, p = <0.01; ***, p = <0.001; ****, p = <0.0001). Source data are provided as a source data file.
Fig. 4
Fig. 4. Schematic genome representation of the evolved phages.
ac For each bacteriophage (phage) genus, a genome map is provided for the ancestral phage (FJK, FIM, or MK/JS) with the relevant functional annotations highlighted on top. Each coloured arrow represents a coding sequence with white encoding hypothetical proteins, blue (DNA) metabolism-associated proteins, green virion proteins, and red genome packaging or cell lysis proteins. The genomic changes in the evolved phages after round 15 and round 30 are displayed below each ancestral phage genome, with deletions being shown as a delta symbol and the individual SNPs annotated. For the Pakpunavirus members, a BLAST comparison between both ancestral phages is also shown. d Tertiary structure prediction of EPS depolymerase FJK_gp62. In red, the cysteine residue on position 98 is highlighted, which is mutated to the aromatic amino acid phenylalanine in the evolved phage.
Fig. 5
Fig. 5. Phenotypic and genomic characterisation of phage-treated Paer09 isolates.
a Efficiency of plating (EOP) of five bacteriophages (phages) (FJK, FJK.R9-15, FJK.R9-30, MK, and MK.R3-15) for 48 Paer09 strains treated with individual phages (FJK, FJK.R9-15, FJK.R9-30). The EOP is defined as the concentration ratio of a phage on the phage-treated isolate (numerator) and the naive Paer09 strain (denominator; Control). An EOP above 10 was considered as increased efficiency (green), while an EOP of 0.1 to 10 was ranked as unchanged efficiency (grey). A reduced efficiency was defined as an EOP between 0.001 and 0.1 (light blue). When no individual plaques were visible or the EOP was equal to or under 0.001 the isolate was determined resistant to the phage (blue). Mutation-associated protein of each strain with amino acid change in parentheses. A lack of labelling refers to isolates in which no apparent mutation could be identified. b Illustration of the cumulative number of isolates by mutant protein. c Illustration of the number of isolates by mutant protein according to the treatment group (phage FJK; phage FJK.R9-15; phage FJK.R9-30). Optical density (OD600) measurements of a three-day co-incubation of planktonic naive Paer09 strain with phage FJK (d), phage FJK.R9-15 (e) and phage FJK.R9-30 (f) at an MOI of 0.001. The thin black lines represent each individual replicate (n = 8), and the thick coloured line represents the average. For phages FJK.R9-15/30 the completely suppressed replicate was excluded from the average calculation. g Illustration of the averaged co-incubation curves for phages FJK (grey line; panel d), FJK.R9-15 (violet line; e) and FJK.R9-30 (yellow line; f) over three days in comparison to a growth control (dotted black line) and negative control (black line). Source data are provided as a source data file.
Fig. 6
Fig. 6. Antibiofilm and antimicrobial activity of the phage cocktail.
a Efficiency of plating (EOP) of five phages (FJK, FJK.R9-15, FJK.R9-30, MK, and MK.R3-15) on 18 Paer09 strains treated with the phage cocktail (FJK.R9-30 + MK.R3-15). EOP is defined within the methods. Mutation-associated protein of each strain with amino acid change in parentheses (1c.203_204dupTC p.R69fs and 2c.205delA p.R69fs). Lack of labelling refers to isolates with no apparent mutation. b Illustration of the number of isolates by mutant protein and treatment group (FJK; FJK.R9-15; FJK.R9-30; Cocktail). c qPCR-determined bacterial load (CFU/bead) of 24 h pre-established Paer09 biofilm untreated (GC) and after co-incubation (3, 6 and 24 h) with FJK.R9-30 or the cocktail. The p-value is 0.0077 (6 h, Cocktail vs. FJK.R9-30). d, e Heat flow (µW) and heat (J) curves measured for 48, 72 and 96 h of Paer09 biofilm co-incubated with MK.R3-15, FJK.R9-30, cocktail (individual replicates) or untreated (GC, dashed black line). Minimum heat flow values in the right upper corner (d). The p-values are 0.0404 (FJK.R9-30 vs. Cocktail) and 0.0024 (MK.R3-15 vs. Cocktail). f Calculated lag time (h) from the heat curves for each tested condition. The p-values are 0.0051 (FJK.R9-30 vs. Cocktail) and 0.0002 (MK.R3-15 vs. Cocktail). OD600 measurement of a seven-day (g) and three-day (h) co-incubation of planktonic naive Paer09 strain with the cocktail (MOI: 0.001, g; MOI: 0.0001, h). Thin lines represent the individual replicates (n = 8), and the thick coloured line the average, excluding completely suppressed replicates (n = 4, g; n = 2, h). i Illustration of averaged co-incubation curves (including grey, violet, and yellow curves from Fig. 5d) over three days compared to a growth control (dotted black line) and negative control (black line). The cocktail (MOI: 0.0001) is shown as a dotted green curve. All experiments were performed in fourfold and unless specified otherwise, the calorimetric curves (d, e) display the mean. The error bars represent the standard error of the mean. Statistical analysis was conducted by unpaired two-tailed Student’s t test and p-values indicated with asterisks (*p = <0.05; **p = <0.01; ***p = <0.001). Source data are provided as a source data file.

References

    1. Antimicrobial resistance surveillance in Europe 2022 – 2020 data. (WHO Regional Office for Europe/European Centre for Disease Prevention and Control, Copenhagen: WHO Regional Office for Europe, 2022).
    1. Antimicrobial resistance in the EU/EEA (EARS-Net) - Annual Epidemiological Report 2021. (European Centre for Disease Prevention and Control, Stockholm: ECDC, 2022).
    1. Tacconelli, E. et al. Discovery, research, and development of new antibiotics: the WHO priority list of antibiotic-resistant bacteria and tuberculosis. Lancet Infect. Dis.18, 318–327 (2018). - PubMed
    1. Centers for Disease, C., Prevention, National Center for Emerging, Z., Infectious Diseases. Division of Healthcare Quality Promotion. Antibiotic Resistance, C. & Strategy, U. Antibiotic resistance threats in the United States, 2019. 10.15620/cdc:82532 (2019).
    1. Nathwani, D., Raman, G., Sulham, K., Gavaghan, M. & Menon, V. Clinical and economic consequences of hospital-acquired resistant and multidrug-resistant Pseudomonas aeruginosa infections: a systematic review and meta-analysis. Antimicrob. Resist. Infect. Control3, 32 (2014). - PMC - PubMed

Publication types

MeSH terms

Substances

Associated data

LinkOut - more resources