. 2024 Oct 3;15(1):8569.
doi: 10.1038/s41467-024-52902-5.

Aberrant cytoplasmic expression of UHRF1 restrains the MHC-I-mediated anti-tumor immune response

Affiliations

Aberrant cytoplasmic expression of UHRF1 restrains the MHC-I-mediated anti-tumor immune response

Lianmei Tan et al. Nat Commun. .

Abstract

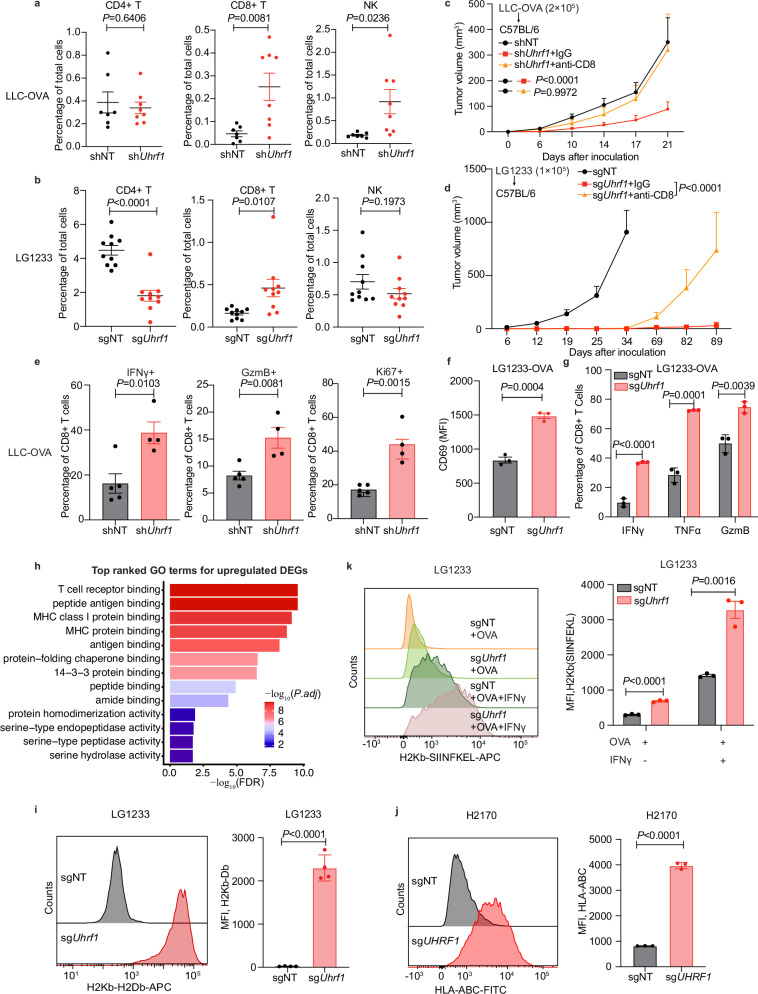
Immunotherapy successfully complements traditional cancer treatment. However, primary and acquired resistance might limit efficacy. Reduced antigen presentation by MHC-I has been identified as potential resistance factor. Here we show that the epigenetic regulator ubiquitin-like with PHD and ring finger domains 1 (UHRF1), exhibits altered expression and aberrant cytosolic localization in cancerous tissues, where it promotes MHC-I ubiquitination and degradation. Cytoplasmic translocation of UHRF1 is induced by its phosphorylation on a specific serine in response to signals provided by factors present in the tumor microenvironment (TME), such as TGF-β, enabling UHRF1 to bind MHC-I. Downregulation of MHC-I results in suppression of the antigen presentation pathway to establish an immune hostile TME. UHRF1 inactivation by genetic deletion synergizes with immune checkpoint blockade (ICB) treatment and induces an anti-tumour memory response by evoking low-affinity T cells. Our study adds to the understanding of UHRF1 in cancer immune evasion and provides a potential target to synergize with immunotherapy and overcome immunotherapeutic resistance.


Conflict of interest statement

Q.-J.L. is a scientific co-founder and shareholder of TCRCure Biopharma and Hervor Therapeutics. The other authors declare no competing interests.

Figures

Fig. 1
Fig. 1. UHRF1 is overexpressed in cancer and promotes tumor growth in syngenic mouse models.
a UHRF1 expression in cancers versus normal tissues. TPM, transcripts per million. BLCA, bladder urothelial carcinoma; BRCA, breast invasive carcinoma; CESC, cervical squamous cell carcinoma; CHOL, cholangiocarcinoma; COAD, colon adenocarcinoma; ESCA, esophageal carcinoma; GBM, glioblastoma multiforme; HNSC, head and neck squamous cell carcinoma; KICH, kidney chromophobe; KIRC, kidney renal clear cell carcinoma; KIRP, kidney renal papillary cell carcinoma; LIHC, liver hepatocellular carcinoma; LUAD, lung adenocarcinoma; LUSC, lung squamous cell carcinoma; PRAD, prostate adenocarcinoma; READ, rectum adenocarcinoma; STAD, stomach adenocarcinoma; THCA, thyroid carcinoma; UCEC, uterine corpus endometrial carcinoma; SKCM, skin cutaneous melanoma. b UHRF1 expression in GSE32867 dataset (n = 58). c Survival analysis of lung cancer patients stratified by UHRF1 mRNA expression (n = 376 low, 1035 high). d UHRF1 Protein expression in Gillett et al. cohort (n = 102). e Survival analysis based on UHRF1 protein expression in Xu et al. cohort (n = 56 low, 9 high). f, g Tumor photos for LG1233 with 1 × 10⁵ (f) or 1 × 10⁶ (g) cells injected into female C57BL/6 mice. h, i Tumor growth (h) and survival(i) curves for LG1233 cells injected into female C57BL/6 mice. n = 7 per group. jl Tumor photo (j) and growth curves (l) for LLC-OVA cells injected into female C57BL/6 mice. n = 7 (shNT), 8 (shUhrf1). k, m Tumor photo (k) and growth curves (m) for LLC-OVA cells injected into male nude mice. n = 5 per group. Data are mean ± SEM (h, l, m). For box plots, the box limits show the 25th to 75th percentile, the centre line shows the median value and the whiskers show the minimum to maximum values. n indicates the number of biological replicates. P values were determined using two-sided Wilcoxon signed-rank test (a, b, d), log-rank test (c, e, i), two-way ANOVA test (h, l, m). Source data are provided as a Source Data file. Data in (h, i, l, m) were repeated independently at least twice with similar results.
Fig. 2
Fig. 2. UHRF1 restrains CD8+ T cell response through downregulate MHC-I expression.
a, b Flow cytometry analysis of tumor-infiltrating lymphocytes. shNT or shUhrf1 LLC-OVA cells were injected into female C57BL/6 mice, tumors were collected on day 17 for analysis, n = 7 (shNT), 8 (shUhrf1) (a); sgNT or sgUhrf1 LG1233 cells were injected into female C57BL/6 mice, tumors were collected on day 8 for analysis, n = 10 per group (b). c, d Tumor growth curves of tumor bearing female C57BL/6 mice treated with IgG or anti-CD8 neutralizing antibodies. n = 6 (shNT), 7 (shUhrf1 + IgG, shUhrf1+anti-CD8)(c), n = 7 per group (d). e Flow cytometry assessing IFNγ+, GzmB+ and Ki67+ CD8+ T cells in shNT or shUhrf1 tumors. n = 5 (shNT), 4 (shUhrf1). fg Flow cytometry assessing CD69 expression (f) and cytokine production (g) in OT-I T cells co-cultured with sgNT or sgUhrf1 LG1233-OVA cells. n = 3 per group. h Gene set enrichment analysis (GO molecular function) of upregulated genes in sgUhrf1 tumors compared with sgNT tumors. n = 3 per group. i Flow cytometry determines the surface level of H2Kb-H2Db in LG1233 sgNT and sgUhrf1 cells. n = 4 per group. j Flow cytometry determines the surface level of HLA-ABC in sgNT and sgUHRF1 H2170 cells. n = 3 per group. k Flow cytometry measurement of cell surface OVA 257-264 (SIINFEKL) peptide bound to MHC-I complex in LG1233 sgNT and sgUhrf1 cells, with or without 5 ng/mL IFNγ for 16 h. n = 3 per group. Data are mean ± SEM (ag, ik). n indicates the number of biological (ae, h) or technical (f, g and ik) replicates. P values were determined using two-tailed Student’s t test (a, b, eg, ik), two-way ANOVA test (c, d) and one sided hypergeometric test then adjusted using multiple-test correction (h). MFI, mean fluorescence intensity; FDR, false discovery rate. Source data are provided as a Source Data file. All the data except h was repeated independently at least twice with similar results.
Fig. 3
Fig. 3. Cytoplasmic UHRF1 mediates MHC-I degradation.
a Affinity purification of Flag-HLAA using antibody against Flag-tag. The top hits from mass spectrometry analysis were shown. b Interaction of mouse UHRF1 and H2K1 was determined by Co-immunoprecipitation (Co-IP). HEK293T cells were transfected with Flag-Uhrf1 in combination with HA-H2k1. c Wild-type and Uhrf1-knockdown LLC-OVA cells were transfected with HA-H2k1. Ubiquitination of H2K1 was examined by Co-IP. d Representative images of UHRF1 expression by IHC staining from LUSC and LUAD patient samples and corresponding adjacent normal tissues. UHRF1 monoclonal antibody (H-8) from Santa Cruz (Cat# sc-373750) was used for the IHC staining. Scale bars, 25 µm. e Quantification of the cytoplasmic UHRF1 positive cells by Qupath from LUSC (n = 90) and LUAD (n = 86) patients with corresponding adjacent normal tissues. f Representative confocal images showing UHRF1 localization in cultured LG1233 cells (upper panel), LG1233 tumor tissues developed in C57BL/6 mice (middle panel) and normal spleen tissues (lower panel). Nuclei were stained with DAPI. Scale bars, 10 µm. n indicates the number of biological replicates. Data are mean ± SEM (e). P values were determined using two-tailed Student’s t test (e). Data in (b, c, f) were repeated independently at least twice with similar results. Source data are provided as a Source Data file.
Fig. 4
Fig. 4. Phosphorylated UHRF1 is localized to the cytoplasm in response to TGF-β within the TME.
a Representative confocal images showing pUHRF1 (green) in LG1233 tumor tissues and normal lung tissues. Scale bars, 25 µm. b The UHRF1-HLAA interaction was examined by Co-IP. HEK293T cells were co-transfected with HA-HLAA and Flag-UHRF1 (wild-type, S661A or S661D). c Localization of HLA-ABC with pUHRF1. Dashed box regions were magnified. Scale bar, 25 µm. d Surface level of HLA-ABC in A549 cells with overexpressed Flag-UHRF1 (S661A) or Flag-UHRF1 (S661D), n = 5 per group. e LG1233 cells with S656A or S656D Uhrf1 expression were subcutaneously injected into male C57BL/6 mice. Tumor volume was monitored. Uhrf1 (S656A), n = 7; Uhrf1 (S656D), n = 8. f Representative IHC images of pUHRF1 and HLA-ABC staining, showing low pUHRF1 with high HLA-ABC (patient 1) and high pUHRF1 with low HLA-ABC (patient 2). Scale bars, 50 µm. g Pearson correlation of pUHRF1 expression with HLA-ABC level in lung cancer samples (n = 90). h Representative confocal images showing LG1233 cells treated with or without 200 ng/mL TGF-β1 for 72 h, stained for UHRF1 (green) and DAPI (blue). Scale bars, 25 µm. i Representative confocal images showing pUHRF1 (red) localization in sgNT and sgTgfbr2 LG1233 tumor tissues. Scale bars, 25 µm. j Tumor growth curves of sgNT or sgTgfbr2 LG1233 cells injected into male C57BL/6 mice. n = 6 per group. Data are mean ± SD (d) and mean ± SEM (e, j). n indicates the number of biological (e, j) or technical (d) replicates. For (g), n = 18 of biological samples, five technical replicates in per biological sample were included. P values were determined using two-tailed Student’s t test (d) and two-way ANOVA test (e, j), the correlation coefficient (r) and P value in (g) were determined using two-tailed Pearson correlation analysis. Data in (ad, h, i) were repeated independently twice with similar results. MFI, mean fluorescence intensity. Source data are provided as a Source Data file.
Fig. 5
Fig. 5. Inactivating UHRF1 induces memory formation via expansion of T cell clones with low-affinity TCRs and synergizes with anti-CTLA4-based ICB therapy.
a, b Survivor mice that rejected Uhrf1-knockout tumors were rechallenged parental LG1233-OVA cells. Tumor growth (a) and survival (b) curves were plotted. n = 5 each group. c Frequency of high- and low-affinity TCR clonotypes in tumors from mice injected with sgNT or sgUhrf1 LG1233-OVA cells. n = 5 per group. d Schematic representation of T cell therapy. e, f Tumor growth curves of LG1233-OVA (N4) (e) or LG1233-OVA (Q4) (f) cells injected into male C57BL/6 mice. n = 5 per group. g, h Tumor growth (g) and survival (h) curves of female mice with shNT or shUhrf1 tumors treated with anti-CTLA4 on days 7, 10 and 14. n = 6 per group (g). n = 10 (shNT+IgG), 8 (shNT+anti-CTLA4), 6 (shUhrf1 + IgG), 8 (shUhrf1+anti-CTLA4) (h). g, h were performed independently. i Rechallenge of survivor mice from (h) with parental LLC-OVA cells. n = 5 (control), 4 (survivor). jn TCRβ sequencing for LLC-OVA tumors. TCR similarity (jm) and expanded TCR clones, constituting >10%, >5%, >2%, >1%, and >0.5% are shown as gradient segments (n). n = 6 (shNT+IgG, shNT+anti-CTLA4 and shUhrf1 + IgG), 5 (shUhrf1+anti-CTLA4). Data are mean ± SEM (a, c, eg, i). Box plots (jm), the horizontal lines indicate the first, second (median) and third quartiles; the whiskers extend to ±1.5× the interquartile range. n indicates the number of biological replicates. P values were determined using two-way ANOVA test (a, eg, i), log-rank test (b, h), two-tailed Student’s t test (c, jm) and Chi-square test (n). AA, amino acid. Source data are provided as a Source Data file.

References

    1. Ferris, R. L. et al. Nivolumab for recurrent squamous-cell carcinoma of the head and neck. N. Engl. J. Med.375, 1856–1867 (2016). - PMC - PubMed
    1. McDermott, D. F. et al. Atezolizumab, an anti-programmed death-ligand 1 antibody, in metastatic renal cell carcinoma: long-term safety, clinical activity, and immune correlates from a phase ia study. J. Clin. Oncol.34, 833–842 (2016). - PubMed
    1. Chen, D. S. & Mellman, I. Oncology meets immunology: the cancer-immunity cycle. Immunity39, 1–10 (2013). - PubMed
    1. Sharma, P., Hu-Lieskovan, S., Wargo, J. A. & Ribas, A. Primary, adaptive, and acquired resistance to cancer immunotherapy. Cell168, 707–723 (2017). - PMC - PubMed
    1. Bai, R. et al. Mechanisms of cancer resistance to immunotherapy. Front. Oncol.10, 1290 (2020). - PMC - PubMed

Publication types

MeSH terms

Substances

Associated data