. 2024 Oct 3;15(1):8549.
doi: 10.1038/s41467-024-52579-w.

Whole-genome sequencing in 333,100 individuals reveals rare non-coding single variant and aggregate associations with height

Affiliations

Whole-genome sequencing in 333,100 individuals reveals rare non-coding single variant and aggregate associations with height

Gareth Hawkes et al. Nat Commun. .

Abstract

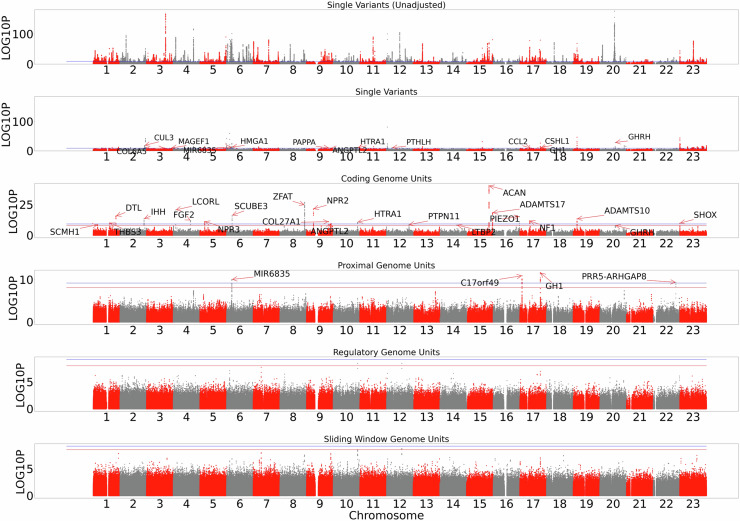
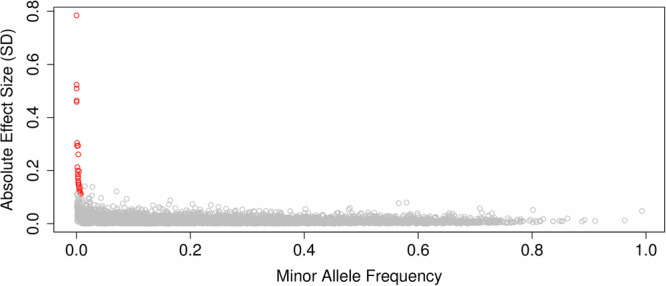
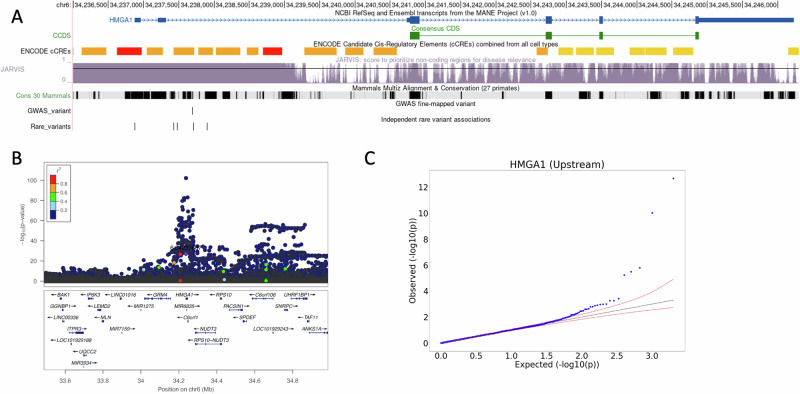
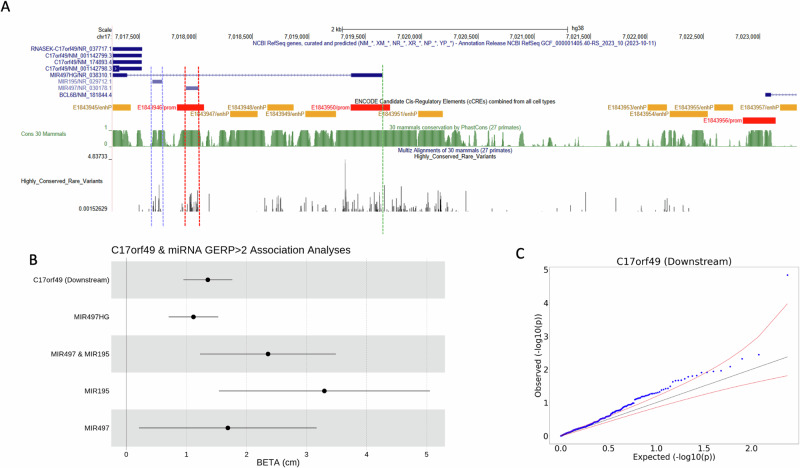
The role of rare non-coding variation in complex human phenotypes is still largely unknown. To elucidate the impact of rare variants in regulatory elements, we performed a whole-genome sequencing association analysis for height using 333,100 individuals from three datasets: UK Biobank (N = 200,003), TOPMed (N = 87,652) and All of Us (N = 45,445). We performed rare ( < 0.1% minor-allele-frequency) single-variant and aggregate testing of non-coding variants in regulatory regions based on proximal-regulatory, intergenic-regulatory and deep-intronic annotation. We observed 29 independent variants associated with height at P < 6 × 10 - 10 after conditioning on previously reported variants, with effect sizes ranging from -7cm to +4.7 cm. We also identified and replicated non-coding aggregate-based associations proximal to HMGA1 containing variants associated with a 5 cm taller height and of highly-conserved variants in MIR497HG on chromosome 17. We have developed an approach for identifying non-coding rare variants in regulatory regions with large effects from whole-genome sequencing data associated with complex traits.


Conflict of interest statement

Bruce M. Psaty serves on the Steering Committee of the Yale Open Data Access Project funded by Johnson & Johnson. Xihong Lin is a consultant of AbbVie Pharmaceuticals and Verily Life Sciences. The remaining authors declare no competing interests.

Figures

Fig. 1
Fig. 1. Manhattan plots of a whole-genome sequencing analysis of height.
Manhattan plots of results split by single variant and genomic aggregate analysis. From top to bottom: unconditioned single variants, single variants conditioned on known height loci, rare ( < 0.1% minor-allele frequency) coding genome aggregates, followed by rare non-coding genome units proximal genome aggregates, regulatory genome aggregates and sliding window aggregates. We plot–log10(p) on the y-axis. Red horizontal lines indicate the position of genome-wide significance considering only that panel, whilst blue indicates genome-wide significance across the entire study. For the single variant, coding and proximal panels, loci leads are labelled by their annotated gene based on the output of the Variant Effect Predictor. All plotted statistics were derived from the discovery UK Biobank analysis set (N = 183,078), based on a two-sided chi-squared statistic.
Fig. 2
Fig. 2. Comparisons of rare variant effect sizes with known common effects.
Variant minor-allele-frequency versus absolute effect size for the 28 genetic variants (red) identified after adjusting for previously published height loci (derived from the discovery UK Biobank analysis set; N = 183,078), contrasted against the results of Yengo et al. for common variants (grey).
Fig. 3
Fig. 3. Identification of a regulatory region associated with height proximal to HMGA1.
A UCSC genome browser window showing genomic features in the region upstream of HMGA1, including JARVIS score, conservation score, known ENCODE cCRE’s and consensus coding sequence. Custom track ‘Common Variants’ shows the locations and –log10(P) values of variants with MAF > 0.01%, and ‘Rare Variant Associations’ displays the locations and –log10(P) values of variants which contributed to the genomic aggregate (MAF < 0.001%). B Manhattan plot showing the distribution of log10-pvalues centred on the common GWAS signal at the HMGA1 locus. C QQ-plot of –log10(P) values for variants which were included in the aggregate test. All plotted statistics were calculated from the discovery UK Biobank analysis set (N = 183,078) based on a two-sided chi-squared statistic.
Fig. 4
Fig. 4. Identification of a regulatory region associated with height proximal to C17orf49, overlapping a miRNA.
A UCSC genome browser window showing genomic features in the region of the region upstream of C17orf49, including JARVIS score and conservation score. –log10(P) values of rare ( < 0.01%) variants which contributed to the aggregate association are highlighted in a custom track based on a two-sided chi-squared test statistic. The vertical blue, red and green lines show the boundaries of MIR195, MIR497 and MIR497-HG respectively. B Forest plot demonstrating how the effect estimate for the association between the proximal and miRNA aggregates, depending on how variants are allocated. Error bars show the standard error of the effect size estimate. C QQ plot for variants in the C17orf49 proximal aggregate. All plotted statistics were calculated from the discovery UK Biobank analysis set (N = 183,078) based on a two-sided chi-squared statistic.

References

    1. Maurano, M. T. et al. Systematic localization of common disease-associated variation in regulatory DNA. Sci. (80-.).337, 1190–1195 (2012). - PMC - PubMed
    1. Yengo, L. et al. A saturated map of common genetic variants associated with human height. Nature610, 704–712 (2022). - PMC - PubMed
    1. Zhao, Y. et al. GIGYF1 loss of function is associated with clonal mosaicism and adverse metabolic health. Nat. Commun.12, 1–6 (2021). - PMC - PubMed
    1. Smedley, D. et al. 100,000 Genomes pilot on rare-disease diagnosis in health care—preliminary report. N. Engl. J. Med.385, 1868–1880 (2021). - PMC - PubMed
    1. Blakes, A. J. M. et al. A systematic analysis of splicing variants identifies new diagnoses in the 100,000 genomes project. Genome Med14, 1–11 (2022). - PMC - PubMed

Publication types

LinkOut - more resources