. 2024 Oct 4;15(1):8588.
doi: 10.1038/s41467-024-52965-4.

Targeting osteoblastic 11β-HSD1 to combat high-fat diet-induced bone loss and obesity

Affiliations

Targeting osteoblastic 11β-HSD1 to combat high-fat diet-induced bone loss and obesity

Chuanxin Zhong et al. Nat Commun. .

Abstract

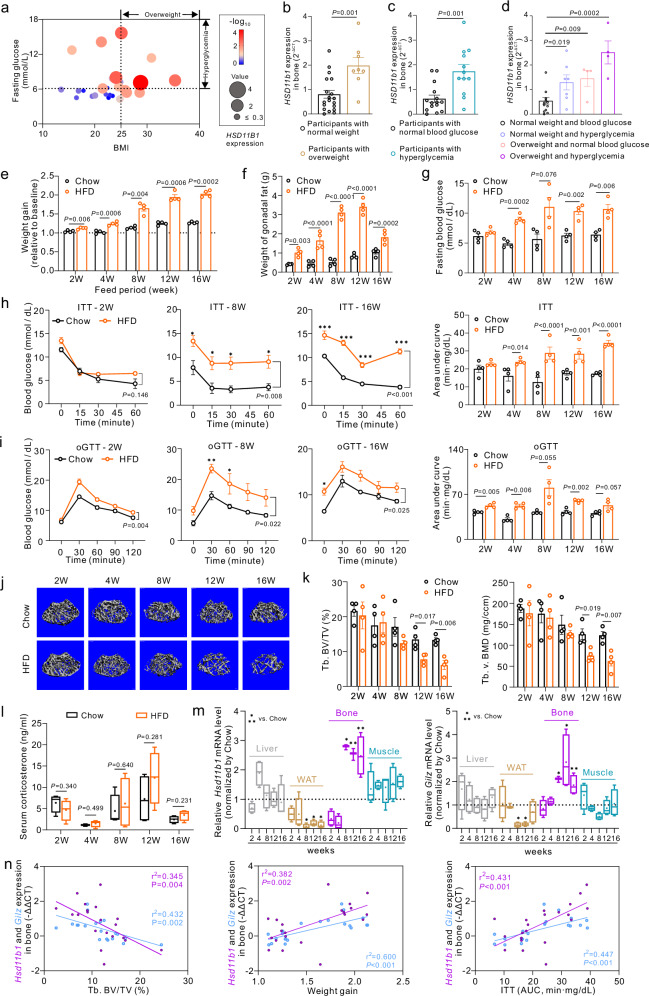
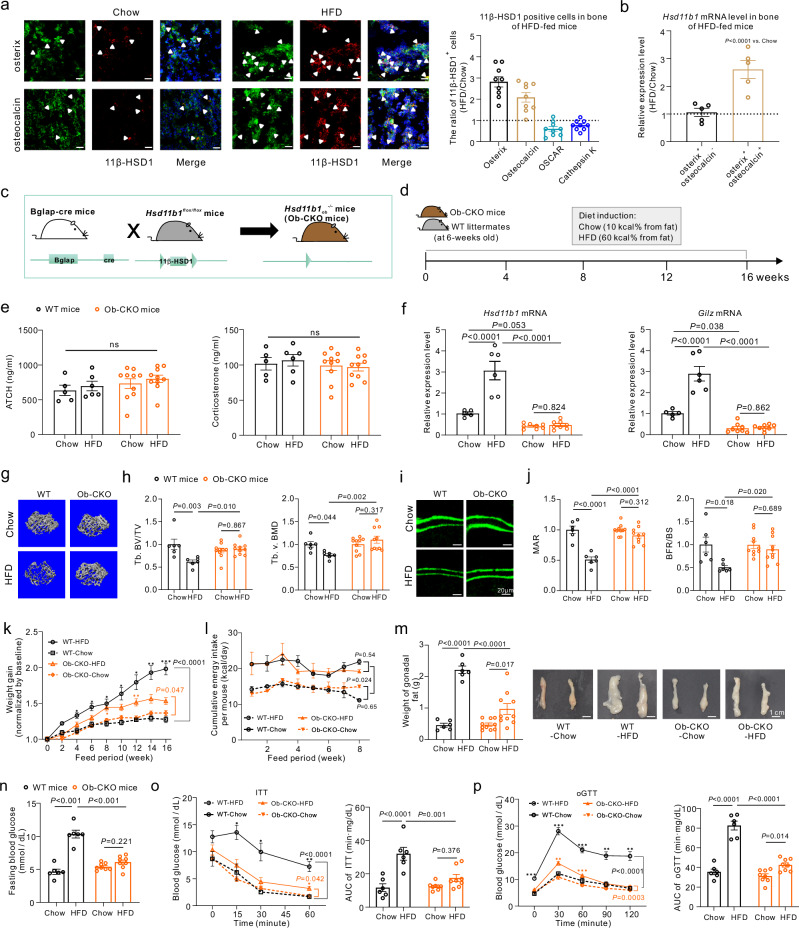
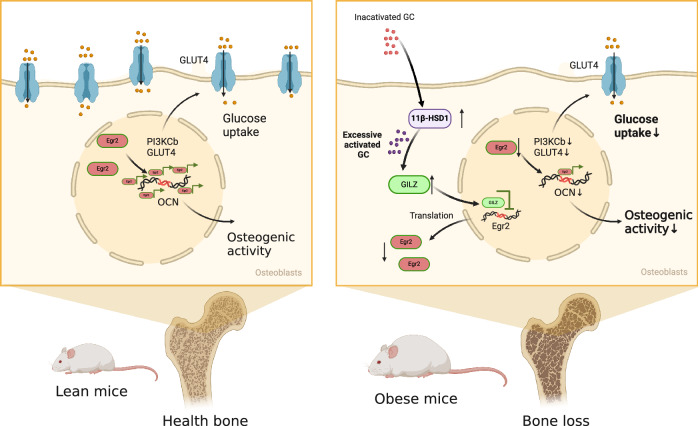
Excessive glucocorticoid (GC) action is linked to various metabolic disorders. Recent findings suggest that disrupting skeletal GC signaling prevents bone loss and alleviates metabolic disorders in high-fat diet (HFD)-fed obese mice, underpinning the neglected contribution of skeletal GC action to obesity and related bone loss. Here, we show that the elevated expression of 11β-hydroxysteroid dehydrogenase type 1 (11β-HSD1), the enzyme driving local GC activation, and GC signaling in osteoblasts, are associated with bone loss and obesity in HFD-fed male mice. Osteoblast-specific 11β-HSD1 knockout male mice exhibit resistance to HFD-induced bone loss and metabolic disorders. Mechanistically, elevated 11β-HSD1 restrains glucose uptake and osteogenic activity in osteoblast. Pharmacologically inhibiting osteoblastic 11β-HSD1 by using bone-targeted 11β-HSD1 inhibitor markedly promotes bone formation, ameliorates glucose handling and mitigated obesity in HFD-fed male mice. Taken together, our study demonstrates that osteoblastic 11β-HSD1 directly contributes to HFD-induced bone loss, glucose handling impairment and obesity.


Conflict of interest statement

The authors declare no competing interests.

Figures

Fig. 1
Fig. 1. Increased glucocorticoid activation and 11β-HSD1 expression in bone are associated with systemic metabolic disorders and trabecular bone loss in mice with high-fat diet.
ad The HSD11B1 expression of cancellous bone in human femoral head. a Bubble Chart depicting body mass index (BMI), blood glucose level (BG), and skeletal HSD11B1 expression in 27 human participants. b Participants with overweight (n = 8) and normal weight (n = 19). c Participants with hyperglycemia (n = 12) and normal blood glucose level (n = 15). d Participants with both normal weight and normal blood glucose level (n = 12), only hyperglycemia (n = 7), only normal glucose level (n = 4), and with both overweight and hyperglycemia (n = 4). Overweight: BMI > 25. Hyperglycemia: BG > 6.11 mmol/L. ei Weight gain, weights of gonadal white adipose tissues (gWAT) and glucose handling tests of wild-type mice with high-fat diet (HFD) or chow diet (Chow). *P < 0.05, **P < 0.01, ***P < 0.001 when HFD vs. Chow. e Weight gain. f Weights of gWAT. g The fasting blood glucose. h The insulin resistant test (ITT). i The oral glucose tolerance test (oGTT). jk The micro-CT analysis of wild-type mice with HFD or Chow. j The trabecular bone microstructure. k The trabecular bone volume/total volume (Tb. BV/TV) and trabecular bone density (Tb. v. BMD). l Systemic corticosterone in wild-type mice with HFD or Chow. m The mRNA expression of the 11β-HSD1 gene (Hsd11b1) and the glucocorticoid target gene Glucocorticoid-induced leucine zipper (Gilz) in liver, WAT, bone and muscle in wild-type mice with HFD, *P < 0.05, **P < 0.01 when HFD vs. Chow. n Linear regression analysis of skeletal Hsd11b1 / Gilz expression versus Tb. BV/TV, weight gain and ITT, respectively, in wild-type mice with HFD or Chow. Note: Data were presented as mean value ± SEM for (bi, km). Box plot with centre line = median, cross = mean, box limits = upper and lower quartiles, whiskers = min to max (lm). n = 4 biologically independent samples at each time-point for (en). Statistical significance was calculated using two-tailed Student’s t-test (ad) and two-way ANOVA followed by two-stage step-up method by Benjamini, Krieger and Yekutieli to adjust for multiple comparisons (ei, km). All tests were two-sided.
Fig. 2
Fig. 2. Osteoblast-specific Hsd11b1 knockout mice are resistant to high-fat diet-induced trabecular bone loss and systemic metabolic disorders.
a Fluorescent immunohistochemistry analysis of 11β-HSD1 expression in bone cells of wild-type mice high-fat diet (HFD, n = 9) or chow diet (Chow, n = 9) for 16 weeks. Left: representative fluorescent images. Right: the ratio of 11β-HSD1-positive cells in either osteoblast lineage cells (Osx+ and Ocn+) or osteoclast lineage cells (Oscar+ and Ctsk+). Scale bar=50 μm. b The Hsd11b1 mRNA expression in osteoblast precursors (Osx+Ocn-) and osteoblasts (Osx+Ocn+) harvested from bone of mice with HFD (n = 5) or Chow (n = 5). c The constructing strategy. d Experimental design of osteoblast-specific Hsd11b1 knockout mice (Ob-CKO) and their littermates (WT mice) fed with HFD or Chow. e Systemic adrenocorticotropic hormone (ACTH) and corticosterone (n = 10 for Ob-CKO, n = 6 for WT). f Skeletal mRNA expression of the 11β-HSD1 gene (Hsd11b1) and the glucocorticoid target gene Glucocorticoid-induced leucine zipper (Gilz) (n = 8 for Ob-CKO, n = 6 for WT). gj The micro-CT analysis and bone histometric analysis (n = 10 for Ob-CKO, n = 6 for WT). The data was normalized by WT-Chow group. g The trabecular bone microstructure. h The trabecular bone volume/total volume (Tb. BV/TV) and trabecular bone density (Tb. v. BMD). i The calcein double labeling. j The quantitative analysis of mineral apposition rate (MAR) and bone formation rate per bone surface (BFR/BS). km Weight gain, food intake and adipose tissues (n = 10 for Ob-CKO, n = 6 for WT). *P < 0.05, **P < 0.01 when HFD vs. Chow at the same genotype. k: Weight gain. The data was normalized by baseline. l: Food intake. m Weights and representative photographs of gonadal white adipose tissues (gWAT). np Glucose handling tests (n = 8 for Ob-CKO, n = 6 for WT). *P < 0.05, **P < 0.01, ***P < 0.001 when HFD vs. Chow at the same genotype. n Fasting blood glucose. o Insulin tolerance test (ITT). p Oral glucose tolerance test (oGTT). Note: Data were presented as mean value ± SEM for (b, e, f, h, jp). All samples are biologically independent samples. Statistical significance was calculated using one-way ANOVA followed by Tukey’s post-hoc test (a) and two-way ANOVA followed by Sidak’s multiple comparisons test (b, ep). All tests were two-sided.
Fig. 3
Fig. 3. 11β-HSD1-mediated GC signaling overactivation restrains the early growth response 2 (Egr2)-governed osteogenic activity and glucose uptake in osteoblast.
a, b Osteogenic activity of MC3T3-E1 osteoblastic cells with 11β-HSD1 overexpression (MC3T3-HSD1 cells) and transfected control cells (MC3T3-GFP cells). a Alkaline phosphatase (ALP) and alizarin red staining. b The mRNA expression of RUNX family transcription factor 2 (Runx2) and bone gamma-carboxyglutamate protein (Bglap). c, d Combination analysis of RNA sequencing (RNA-seq) and assays for transposase-accessible chromatin sequencing (ATAC-seq) in MC3T3-GFP cells and MC3T3-HSD1 cells. c Intersection of differential genes from RNA-seq and ATAC-seq. d Biological processes associated with Egr2. e The mRNA and protein expression of Egr2 in MC3T3-GFP cells and MC3T3-HSD1 cells. f The mRNA expression of Egr2 during osteogenic differentiation. g, h The osteogenic activity of MC3T3-HSD1 cells with Egr2 overexpressing. g Alizarin red staining. h Bglap mRNA expression. i The glucose uptake test of MC3T3-GFP cells and MC3T3-HSD1 cells. j, k The mRNA expression of key glucose transporter proteins and components of insulin-dependent glucose uptake pathway in MC3T3-GFP cells and MC3T3-HSD1 cells. j Glucose transporter type 1 (Glut1), 3 (Glut3) and 4 (Glut4). k: Insulin receptor (Ir), Insulin receptor substrate 1 (Irs1), Phosphatidylinositol-3-kinase catalytic subunit regulatory subunit 1 (Pik3r), alpha (Pik3ca) and subunit beta (Pik3cb). l, m The glucose uptake test and mRNA expression of Glut4 and Pik3cb in MC3T3-HSD1 cells with Egr2 overexpressing. l Glucose uptake test. m Glut4 and Pik3cb. n Dual-luciferase reporter analysis and ChIP quantitative polymerase chain reaction (ChIP-qPCR) analysis of Ege2 target interactions for Pik3cb and Glut4 gene promotors. n Pik3cb and Glut4 gene promotors. o ChIP-qPCR analysis. p Pik3cb and Glut4 gene promotors with different mutations. Note: Data were presented as mean value ± SEM for (a, b, em, p). n = 3 biologically independent samples for RNA-seq, ATAC-seq, western blot analysis, glucose uptake test and osteogenic staining; n = 6 biologically independent samples for RT-qPCR analysis. Statistical significance was calculated using two-tailed Student’s t-test (e), one-way ANOVA followed by Tukey’s post-hoc test (n, p), and two-way ANOVA followed by a two-stage step-up method by Benjamini, Krieger and Yekutieli (a, b, fm) to adjust for multiple comparisons. All tests were two-sided.
Fig. 4
Fig. 4. Inhibiting 11β-HSD1 activity restores impaired osteogenic activity and glucose uptake in osteoblasts with GC signaling overactivation.
a The mRNA expression of glucocorticoid target gene Glucocorticoid-induced leucine zipper (Gilz) in MC3T3-GFP cells and MC3T3-HSD1 cells after treating with 11β-HSD1 inhibitor (AZD8329). b, c The mRNA and protein expression of early growth response 2 (Egr2) in MC3T3-GFP cells and MC3T3-HSD1 cells after treatment of AZD8329. b The mRNA expression. c The protein expression. d The mRNA expression of Egr2 in MC3T3-GFP cells and MC3T3-HSD1 cells after treating with AZD8329 during osteogenic differentiation. eh The osteogenic activity of MC3T3-GFP cells and MC3T3-HSD1 cells after treatment of AZD8329. e Alizarin red staining. f Bone gamma-carboxyglutamate protein (Bglap) mRNA expression. g Runt-related transcription factor 2 (Runx2) mRNA expression. h Osterix mRNA expression. ij The glucose uptake test and mRNA expression levels of Glucose transporter type 4 (Glut4) and Phosphatidylinositol-3-kinase catalytic subunit beta (Pik3cb) in MC3T3-GFP cells and MC3T3-HSD1 cells after treatment of AZD8329. g: Glucose uptake test. h Glut4 and Pik3cb mRNA expression. Note: Data were presented as mean value ± SEM for (a, b, dj). n = 3 biologically independent samples for osteogenic staining, western blot analysis and LC-MS/MS analysis, n = 6 biologically independent samples for RT-qPCR analysis. Statistical significance was calculated using one-way ANOVA followed by Tukey’s post-hoc test (ac), and two-way ANOVA followed by a two-stage step-up method by Benjamini, Krieger and Yekutieli (dj) to adjust for multiple comparisons. All tests were two-sided.
Fig. 5
Fig. 5. Pharmacological inhibition of 11β-HSD1 in osteoblasts attenuates the established high-fat diet-induced obesity, and related glucose handling impairment and bone loss.
a Design of the bone-targeted 11β-HSD1 inhibitor, (DSS)6-AZD8329. b, c Organ distribution and skeletal distribution of (DSS)6-AZD8329 (n = 3) and (RKK)6-AZD8329 (n = 3). b The organ distribution. c The skeletal distribution, scale bar=20 μm. d Experimental design of wild-type mice treated with (DSS)6-AZD8329 and (RKK)6-AZD8329. eg The micro-CT analysis and bone histometric analysis. e The trabecular bone and cortical bone microstructure. f The percentage change of trabecular bone volume/total volume (Tb. BV/TV) and trabecular bone density (Tb. v. BMD). g The percentage change of cortical bone density (Ct. v. BMD). h The calcein double labeling, scale bar=20 μm. i The percentage change of mineral apposition rate (MAR), bone formation rate per bone surface (BFR/BS) and the number of osteoblasts per bone surface (N.Ob/BS). jk Weight gain and energy intake during HFD. *P < 0.05, **P < 0.01, ***P < 0.001 when other groups vs. HFD+vehicle group. j Weight gain. k Energy intake. l Weights and representative photographs of gonadal white adipose tissues (gWAT). mo Glucose handling tests (n = 8 for two vehicle-treated groups, n = 12 for two drug-treated groups). *P < 0.05, **P < 0.01, ***P < 0.001 when other groups vs. HFD + vehicle group. m Fasting blood glucose. n: Insulin tolerance test (ITT). o Oral glucose tolerance test (oGTT). p Glucose uptake tests (n = 8 for two vehicle-treated groups, n = 12 for two drug-treated groups). Left: Representative images of glucose uptake. Right: Quantitative analysis of glucose uptake into liver, WAT, muscle and bone. q Skeletal mRNA expression of Hsd11b1, Gilz, Egr2, Pik3cb and Glut4. Note: Data were presented as mean value ± SEM for (f, g, iq). Chow+vehicle (n = 8), mice with Chow feeding and start administration of vehicle since week 8; HFD+vehicle (n = 8), HFD + (RKK)6-AZD8329 (n = 13), HFD + (DSS)6-AZD8329 (n = 13), mice with HFD feeding and start administration of vehicle, (RKK)6-AZD8329, or (DSS)6-AZD8329, respectively, since week 8. All samples are biologically independent samples. Statistical significance was calculated using one-way ANOVA followed by Tukey’s post-hoc test (fg, i, l, mq) and two-way ANOVA followed by Sidak’s multiple comparisons test (jk, no). All tests were two-sided.
Fig. 6
Fig. 6. Schematic diagram of elevated 11β-HSD1 in osteoblasts contributes to HFD-induced bone loss, glucose handling impairment and obesity.
In the context of HFD-induced obesity, osteoblastic 11β-HSD1 levels are upregulated, leading to overactivated glucocorticoid (GC) signaling. This augmented GC signaling downregulates the expression of Early Growth Response 2 (Egr2) in osteoblasts, and the suppressed Egr2 further restrains skeletal glucose uptake and bone formation. Consequently, the reduction in skeletal glucose uptake and bone formation contributes to bone loss and glucose handling impairment associated with obesity. This figure was created in BioRender. Zhang, G. (2023) BioRender.com/c52z877.

References

    1. Li, J. et al. An obligatory role for neurotensin in high-fat-diet-induced obesity. Nature533, 411–415 (2016). - PMC - PubMed
    1. Hancock, C. R. et al. High-fat diets cause insulin resistance despite an increase in muscle mitochondria. Proc. Natl. Acad. Sci.102, 7815–7820 (2008). - PMC - PubMed
    1. Patsch, J. M. et al. Increased bone resorption and impaired bone microarchitecture in short-term and extended high-fat diet–induced obesity. Metabolism60, 243–249 (2011). - PMC - PubMed
    1. Cain, D. W. & Cidlowski, J. A. Immune regulation by glucocorticoids. Nat. Rev. Immunol.17, 233–247 (2017). - PMC - PubMed
    1. Quax, R. A. et al. Glucocorticoid sensitivity in health and disease. Nat. Rev. Endocrinol.9, 670–686 (2013). - PubMed

Publication types

MeSH terms