. 2024 Oct 3;14(1):22953.
doi: 10.1038/s41598-024-74266-y.

Non-contact photoacoustic imaging with a silicon photonics-based Laser Doppler Vibrometer

Affiliations

Non-contact photoacoustic imaging with a silicon photonics-based Laser Doppler Vibrometer

Emiel Dieussaert et al. Sci Rep. .

Abstract

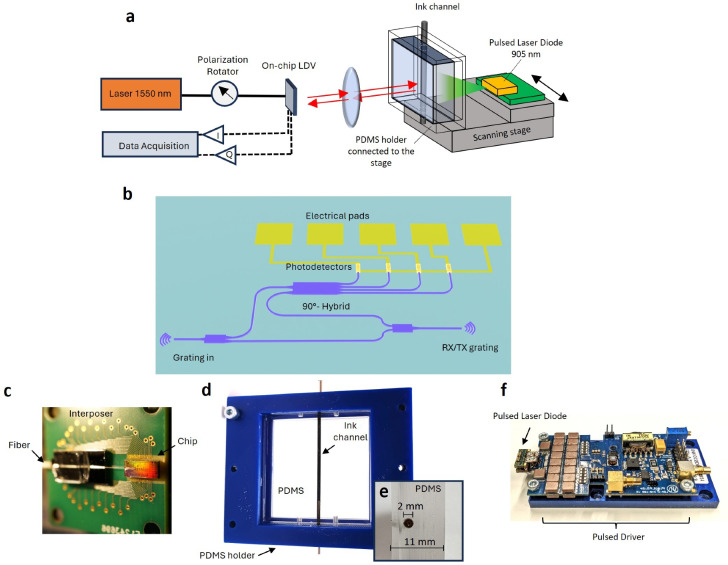
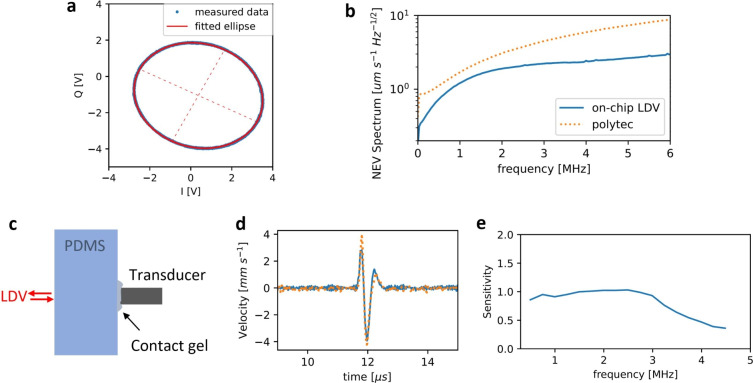
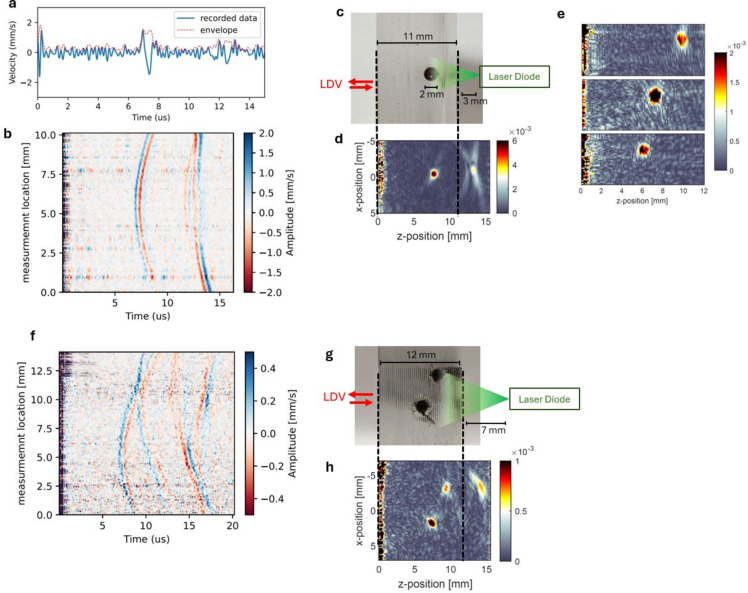
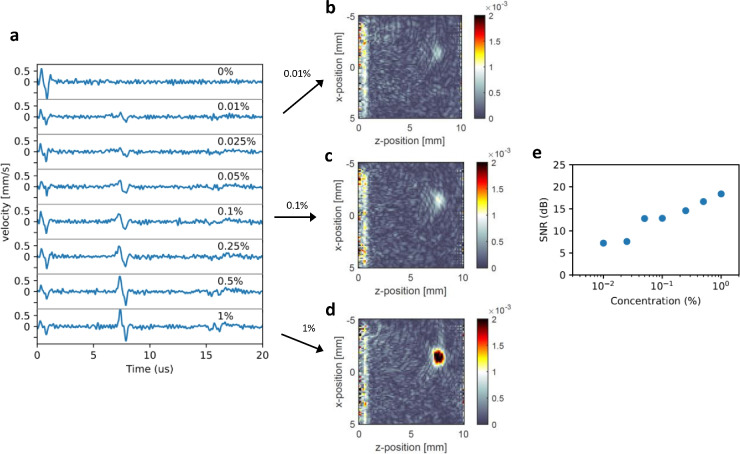
Photoacoustic imaging has emerged as a powerful, non-invasive modality for various biomedical applications. Conventional photoacoustic systems require contact-based ultrasound detection and expensive, bulky high-power lasers for the excitation. The use of contact-based detectors involves the risk of contamination, which is undesirable for most biomedical applications. While other non-contact detection methods can be bulky, in this paper, we demonstrate a proof-of-concept experiment for compact and contactless detection of photoacoustic signals on silicone samples embedded with ink-filled channels. A silicon photonics-based Laser Doppler Vibrometer (LDV) detects the acoustic waves excited by a compact pulsed laser diode. By scanning the LDV beam over the surface of the sample, 2D photoacoustic images were reconstructed of the sample.

Keywords: Laser Doppler Vibrometer (LDV); Photoacoustic imaging; Remote detection; Silicon Photonics.


Conflict of interest statement

The authors declare no competing interests.

Figures

Fig. 1
Fig. 1
(a) A photoacoustic setup consisting of an on-chip LDV with a 1550 nm laser, connected to a data acquisition module. The probe beam is delivered by an optical lens system to the surface of the sample. On the right side of the sample, the pump laser diode fires optical pulses toward the silicone sample where the ink in the channel absorbs the light, hereby generating acoustic waves. (b) Schematic of an on-chip homodyne LDV where light is entering the chip through ’Grating in’ and after splitting into a reference and measurement arm is probing the target using the RX/TX grating. Reference and probe light are combined in a 90-degree optical hybrid and 5 electrical pads are used to read out 4 photodetectors. (c) Picture of the optical chip wire-bonded to an interposer PCB and an optical fiber glued to the input grating. (d) and (e) Pictures of the transparent silicone with an ink-filled embedded channel and its cross-section. (f) A picture of the 905 nm laser diode connected to the Picolas pulsed laser driver.
Fig. 2
Fig. 2
(a) Reference measurement of the I and Q signals and fitting of the ellipse before demodulation. (b) Measured velocity noise floor for the polytec and the on-chip LDV after demodulation. (c) Schematic of setup used to compare pulse responses. The LDV is swapped between the Polytec and the on-chip LDV. (d) A pulse time trace measured by the Polytec (orange) and on-chip LDV (blue). (e) The sensitivity from the LDV compared to the polytec resulting from the spectrum comparison of the pulse response.
Fig. 3
Fig. 3
(a) Time trace of a recorded and demodulated photoacoustic signal and its envelope calculated by the Hilbert transform. (b) Plot of the photoacoustic signal for different locations along the scanning direction of the probe beam on the surface of the sample depicted in (c). (d) Time reversal reconstruction of (c) using the data of (b). (e) Reconstructed images for channels with their centers at different depths of 5.8, 7 and 9.6 mm. (f) Scanning data for a dual channel sample (depicted in g). (h) Time reversal reconstruction for the dual channel sample. All of the channels in this figure are 2 mm in diameter.
Fig. 4
Fig. 4
2D COMSOL simulation of acoustic propagation in a geometry similar to Fig. 1 e for an initial pressure distribution with increased pressure inside the tube filled with a water-based solution surrounded by PDMS at (a) t=0μs, (b) t=5μs and (c) t=9μs.
Fig. 5
Fig. 5
(a) Signal time traces of the recorded velocity of the surface after photoacoustic excitation for different ink concentrations inside the sample. Increasing the concentrations results in stronger signals. The 0.1 % ink solution was measured to have an absorption of 12.5 cm-1 at a 905 nm wavelength. (b, c, d) Show image reconstructions for different ink concentrations showing reduced contrast for lower concentrations. (e) SNR for the different concentrations.

References

    1. Wang, L. V. & Hu, S. Photoacoustic tomography: In vivo imaging from organelles to organs. Science335, 1458–1462. 10.1126/science.1216210 (2012). - PMC - PubMed
    1. Yao, J. & Wang, L. V. Photoacoustic microscopy. Laser and Photonics Reviews7, 758–778. 10.1002/lpor.201200060 (2013). - PMC - PubMed
    1. Zhang, H. F., Maslov, K., Stoica, G. & Wang, L. V. Functional photoacoustic microscopy for high-resolution and noninvasive in vivo imaging. Nature Biotechnology24, 848–851. 10.1038/nbt1220 (2006). - PubMed
    1. Xu, M. & Wang, L. V. Photoacoustic imaging in biomedicine. Review of Scientific Instruments77, 041101. 10.1063/1.2195024 (2006).
    1. Kim, C. et al. In vivo molecular photoacoustic tomography of melanomas targeted by bioconjugated gold nanocages. ACS Nano4, 4559–4564. 10.1021/nn100736c (2010). - PMC - PubMed

LinkOut - more resources