. 2024 Oct 3;8(1):222.
doi: 10.1038/s41698-024-00723-6.

Serial single-cell RNA sequencing unveils drug resistance and metastatic traits in stage IV breast cancer

Affiliations

Serial single-cell RNA sequencing unveils drug resistance and metastatic traits in stage IV breast cancer

Kazutaka Otsuji et al. NPJ Precis Oncol. .

Abstract

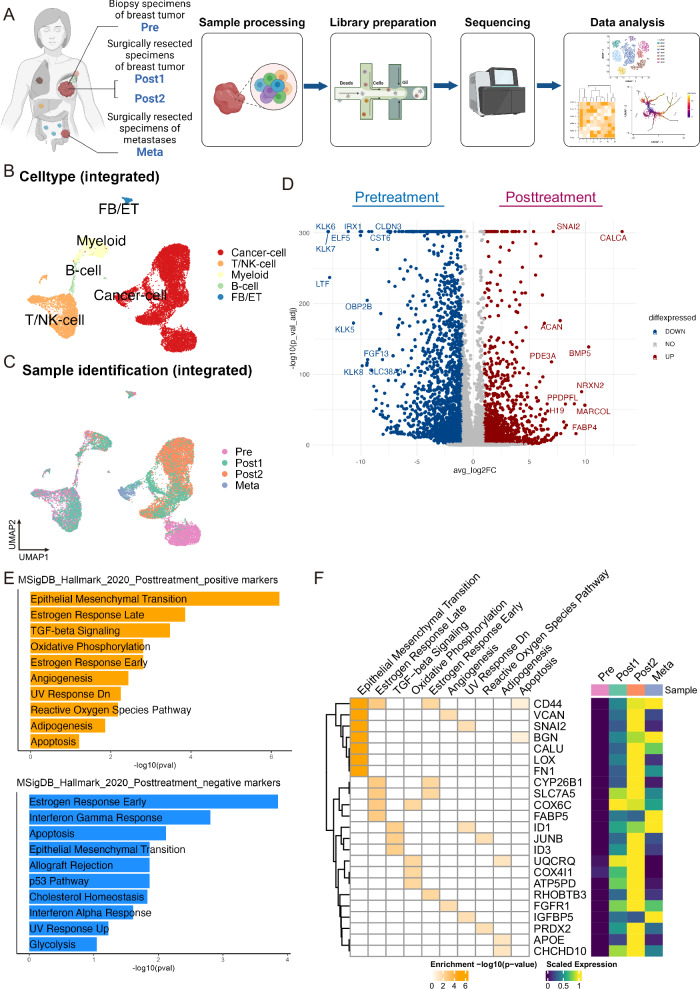
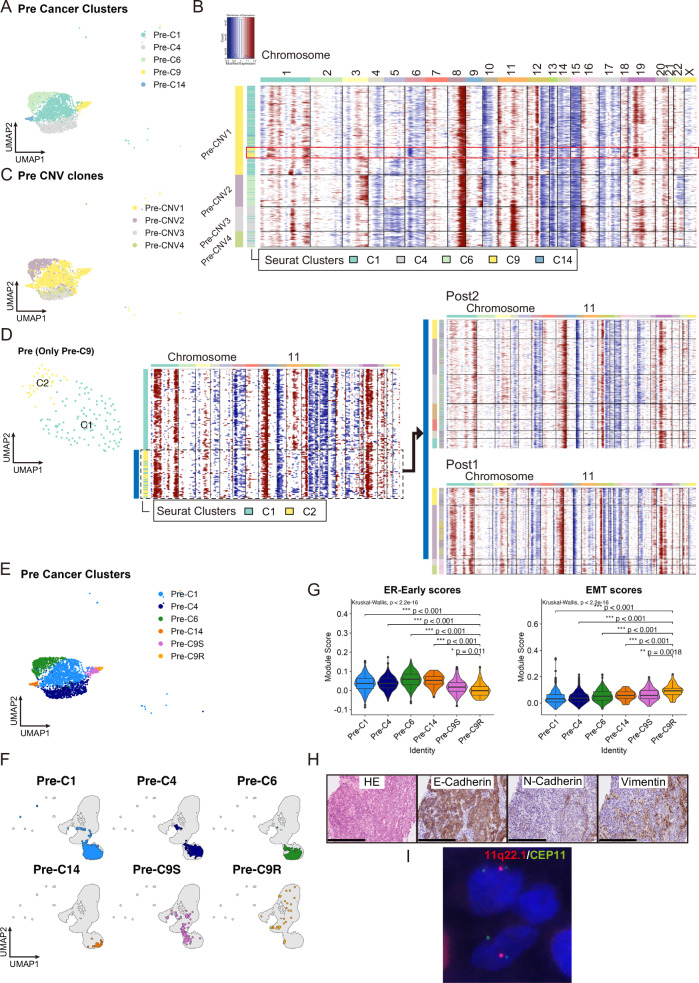
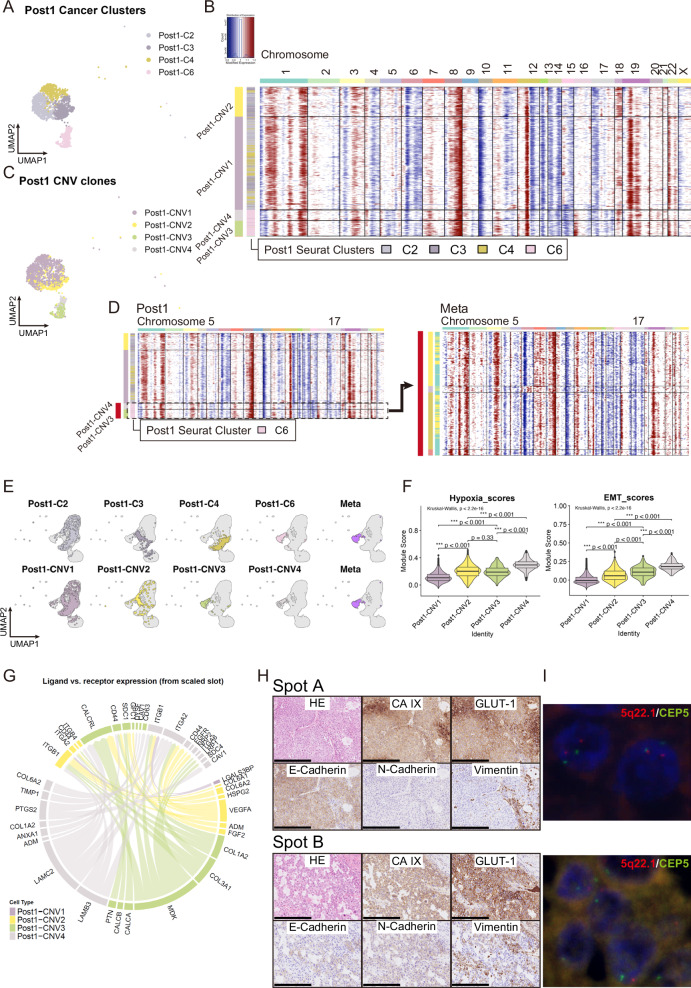
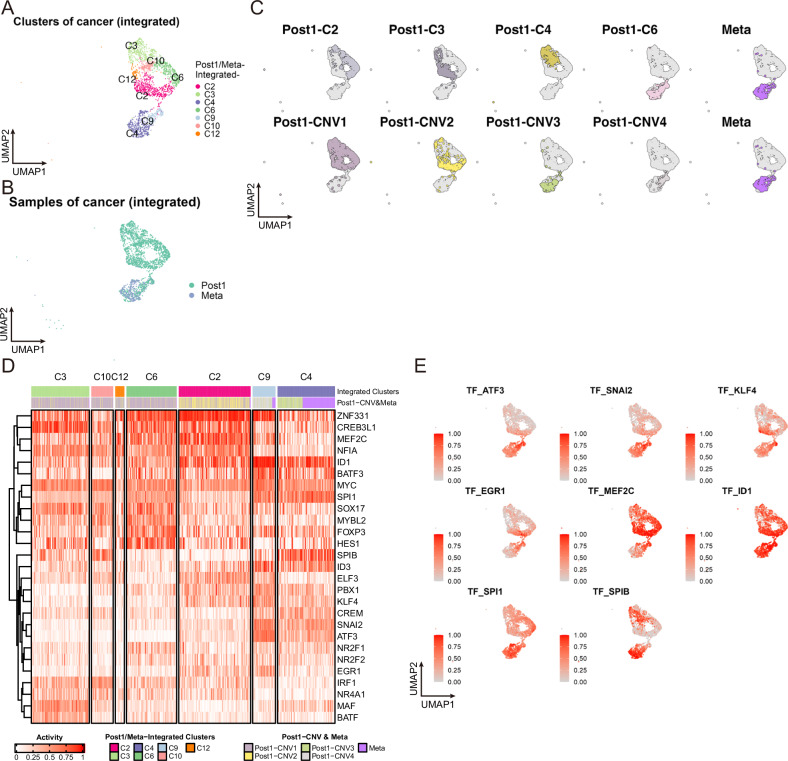
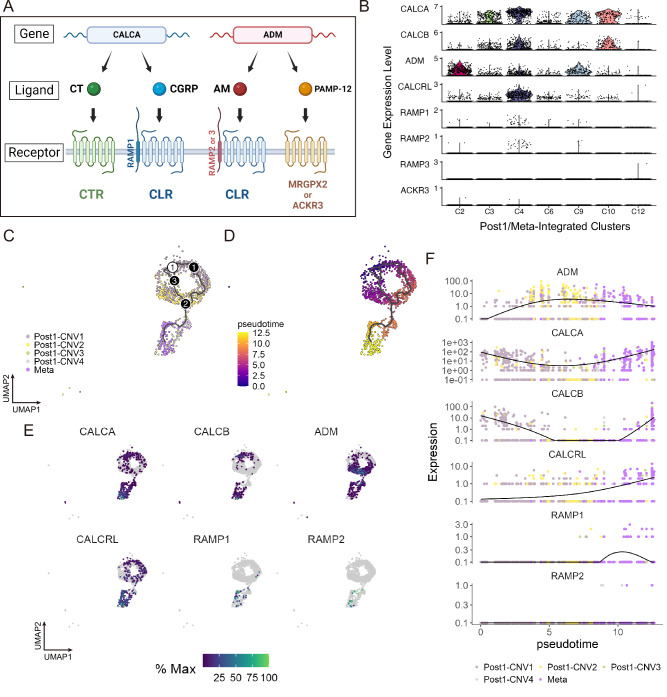
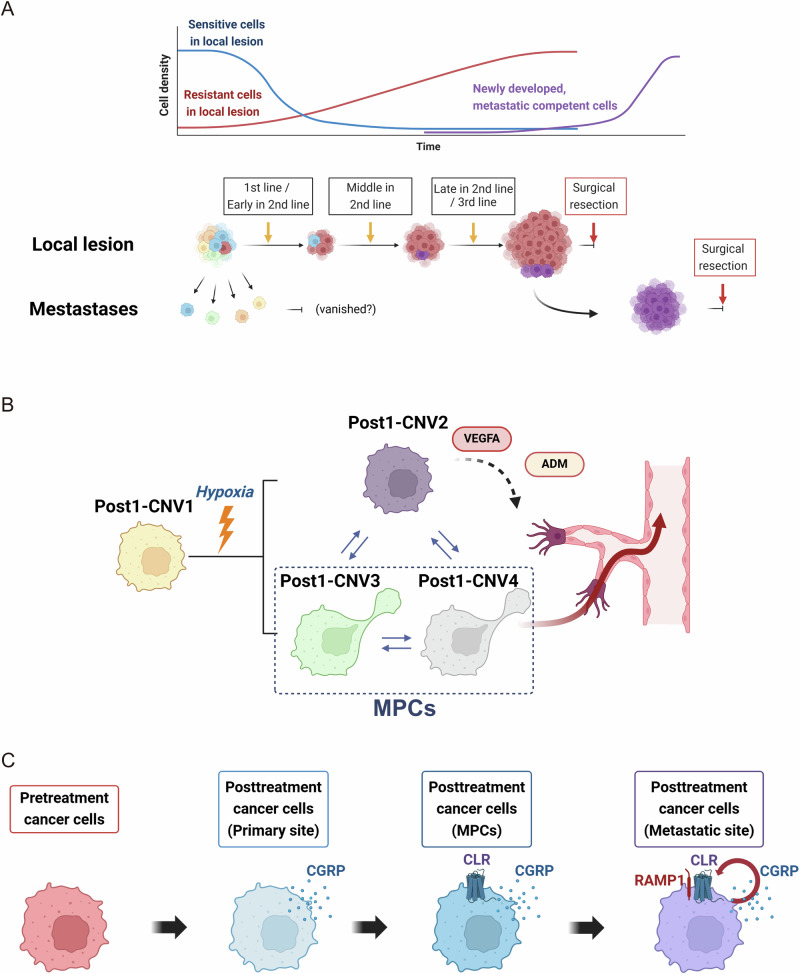
Metastasis is a complex process that remains poorly understood at the molecular levels. We profiled single-cell transcriptomic, genomic, and epigenomic changes associated with cancer cell progression, chemotherapy resistance, and metastasis from a Stage IV breast cancer patient. Pretreatment- and posttreatment-specimens from the primary tumor and distant metastases were collected for single-cell RNA sequencing and subsequent cell clustering, copy number variation (CNV) estimation, transcriptomic factor estimation, and pseudotime analyses. CNV analysis revealed that a small population of pretreatment cancer cells resisted chemotherapy and expanded. New clones including Metastatic Precursor Cells (MPCs), emerged in the posttreatment primary tumors in CNV similar to metastatic cells. MPCs exhibited expression profiles indicative of epithelial-mesenchymal transition. Comparison of MPCs with metastatic cancer cells also revealed dynamic changes in transcription factors and calcitonin pathway gene expression. These findings demonstrate the utility of single-patient clinical sample analysis for understanding tumor drug resistance, regrowth, and metastasis.


Conflict of interest statement

The authors declare no competing Interests.

Figures

Fig. 1
Fig. 1. Experimental scheme, and changes in breast cancer cell gene expression induced by chemotherapy.
A Schema of sample naming, processing, and analysis. (Created by BioRender) B, C UMAP plots for merged cells after integration, color-coded by cluster cell type (B) and sample (C). D Volcano plot comparing differential gene expression in cancer cells before and after chemotherapy. E Pathway enrichment analysis of these differentially expressed genes (D). F Clustergram of positively enriched terms in posttreatment cancer cells (left) and heatmap displaying the average expression of genes related to enriched terms in cancer cells of each sample.
Fig. 2
Fig. 2. Genomic, transcriptomic, and pathological characteristics in cancer cells of Pre sample.
A UMAP plot of cancer cell clustering of Pre (numbering of Seurat-identified Pre clusters is based on the UMAP clustering in Supplementary Fig. 2A). B Heatmap of cancer cell CNV signals by inferCNV in Pre. Horizontal lines divide subclones defined by inferCNV. A subset of cells mostly comprised of Pre-C9 are highlighted with a red square. C UMAP plot of cancer cells in Pre, color-coded according to CNV clone. D Comparison of CNV patterns in cancer from primary site before and after drug therapy. UMAP plot (left) and heatmap of CNV signals (middle) after extracting and reclustering only cells from Pre-C9 in A. Cells with loss on the long arm of chromosome 11 correspond mainly to cells in newly formed cluster C2 and show CNV patterns (blue bar) similar to most surgical (Post1 and Post2) specimens (right). E UMAP plot of cancer cells of Pre, overlayed the information of Pre-C9S and -C9R onto that in A. F UMAP of integrated cancer cells displaying Pre clusters, including -C9S and -C9R. G Violin plot and box plot of gene signature scores in each Pre cluster. Box plots represent the following: center line, median; box limits, upper and lower quartiles; whiskers, 1.5× interquartile range; points, outliers. EMT, epithelial–mesenchymal transition; ER-Early, estrogen response early. H Hematoxylin and eosin staining and immunohistochemical analysis of clinical biopsy specimens of Pre. Scale bar: 250 µm. I Fluorescence in situ hybridization analysis of clinical biopsy specimens from Pre. Image shows the loss of 11q22.1 (spectrum red signals) in some cancer cells.
Fig. 3
Fig. 3. Genomic, transcriptomic, and pathological characteristics in cancer cells of Pre sample.
A UMAP plot of Post1 cancer cells. The numbering of Seurat-identified Post1 clusters is based on the clustering of Post1 in Supplementary Fig. 2A. B Heatmap of Post1 cancer cell CNV signals by inferCNV. Horizontal lines divide subclones defined by inferCNV. C UMAP plot of Post1 cancer cells color-coded according to CNV clone. D Heatmap of CNV signals of Post1 (left) and Meta (right). Cells with loss on the long arm of chromosomes 5 and 17 correspond mainly to Post1-CNV3 and -CNV4, and show CNV patterns (red bar) similar to those of Meta. E UMAP of integrated cancer cells displaying Seurat-identified Post1 clusters plus Meta (upper) and Post1-CNV clones plus Meta (lower). F Violin plot and box plot of gene signature scores in each Post1-CNV clone. Box plots represent the following: center line, median; box limits, upper and lower quartiles; whiskers, 1.5× interquartile range; points, outliers. EMT, epithelial-mesenchymal transition. G Circos plots visualizing the cell–cell connectivity among Post1-CNV clones. Ligands occupy the lower semicircle, and corresponding receptors the upper semicircle. Subclones are color-coded by edge, ligand, and receptor. H Hematoxylin and eosin staining and immunohistochemical analysis of clinical surgically resected specimens from Post1 at two locations on the same slide: Spot A (upper) and Spot B (lower). Scale bar: 250 µm. I Fluorescence in situ hybridization analysis of clinical surgically resected specimens from Post1 at two locations on the same slide: Spot A (upper) and Spot B (lower). At Spot A, cancer cells showed normal copy numbers with two spectrum red signals (5q22.1) and two spectrum green signals (CEP5). At Spot B, cancer cells exhibited the loss of 5q22.1 (spectrum red signals).
Fig. 4
Fig. 4. Transcription factors contributing to MPC transition and metastasis.
A, B UMAP plots of integrated Post1 and Meta with only cancer cells. Cells are color-coded according to cluster number (A), and sample (B). C UMAP of integrated Post1- and Meta-cancer cells displaying Seurat-identified Post1 clusters plus Meta (upper) and Post1-CNV clones plus Meta (lower). D Heatmap of the TF activity alteration scores inferred from gene expression. TFs were vertically aligned by hierarchical clustering. Horizontal bars at the top of the heatmap depict cluster numbers in A and Post1-CNV clones plus Meta. E TFs whose activity was highly altered in Post1/Meta-Integrated-C4 and -C9 are featured on the UMAP plot.
Fig. 5
Fig. 5. Potential contributions of calcitonin signaling to progression from MPC to metastatic cell.
A Genes, products, and their receptors for the human calcitonin family. CALCA, located on chromosome 11p15, encodes two hormones, calcitonin (CT) and calcitonin gene-related peptide (CGRP), produced through alternative mRNA processing. CT binds to the calcitonin receptor (encoded by CALCR), while CGRP binds to the calcitonin receptor-like receptor (CLR, coded by CALCRL). ADM encodes adrenomedullin (AM), which shares structural similarities with CGRP and also binds to the CLR. The specific ligand to which CLR binds is regulated by complex formation with receptor activity-modifying proteins. If RAMP1 forms a complex with CLR, CGRP is the ligand; if RAMP2 or RAMP3 forms the complex, AM is the ligand. In addition to AM, ADM encodes a protein called PAMP-12, which does not interact with the CLR but binds to MRGPX2 and ACKR3. (Created by BioRender) B Violin plots visualizing the expression levels of calcitonin-related genes in integrated cancer clusters of Post1 and Meta (Fig. 4A). C, D Pseudotime analysis of cells in integrated cancer clusters of Post1 and Meta (Fig. 4A). Only cancer cells in G1 cell-cycle phase are contained in this analysis. C Developmental trajectories (color-coded by Post1-CNV clones plus Meta). D Pseudotime values. E Expression level changes of ADM, CALCA, CALCB, RAMP1, and RAMP2 in cancer cells of Post1 and Meta (only in G1 cell-cycle phase) during pseudotime analysis, plotted on the UMAP. F Pseudo-temporal kinetics of ADM, CALCA, CALCB, RAMP1, and RAMP2 expression.
Fig. 6
Fig. 6. Cancer progression estimation in the studied case.
A Putative cancer cell evolutionary pathways in the studied case. B Schematic representation illustrating the generation of subclones within Post1 and their respective roles in cancer progression. Post1-CNV2–4 may have originated from Post1-CNV1 owing to hypoxic conditions within the tumor core. Cancer cells within the Post1-CNV2 clone may have contributed to angiogenesis within the primary tumor by expressing ADM and VEGFA, thereby prompting MPC survival and migration within Post1-CNV3 and -CNV4. C Putative contributions of calcitonin gene-related peptide (CGRP) secretion and expression of calcitonin receptor-like receptor (CLR) and RAMP1 in breast cancer cell evolution. (Created by BioRender).

References

    1. Parker, J. S. et al. Supervised risk predictor of breast cancer based on intrinsic subtypes. J. Clin. Oncol.41, 4192–4199 (2023). - PubMed
    1. Kast, K. et al. Impact of breast cancer subtypes and patterns of metastasis on outcome. Breast Cancer Res Treat.150, 621–629 (2015). - PubMed
    1. Tarighati, E., Keivan, H. & Mahani, H. A review of prognostic and predictive biomarkers in breast cancer. Clin. Exp. Med23, 1–16 (2023). - PubMed
    1. Marusyk, A., Janiszewska, M. & Polyak, K. Intratumor heterogeneity: The Rosetta stone of therapy resistance. Cancer Cell37, 471–484 (2020). - PMC - PubMed
    1. Ramon, Y. C. S. et al. Clinical implications of intratumor heterogeneity: challenges and opportunities. J. Mol. Med.98, 161–177 (2020). - PMC - PubMed