. 2024 Oct;56(10):2027-2035.
doi: 10.1038/s41588-024-01913-5. Epub 2024 Oct 3.

Population-specific putative causal variants shape quantitative traits

Collaborators, Affiliations

Population-specific putative causal variants shape quantitative traits

Satoshi Koyama et al. Nat Genet. 2024 Oct.

Abstract

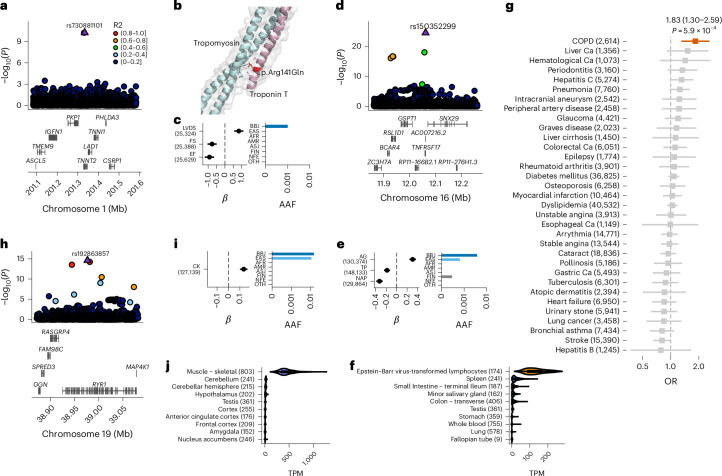
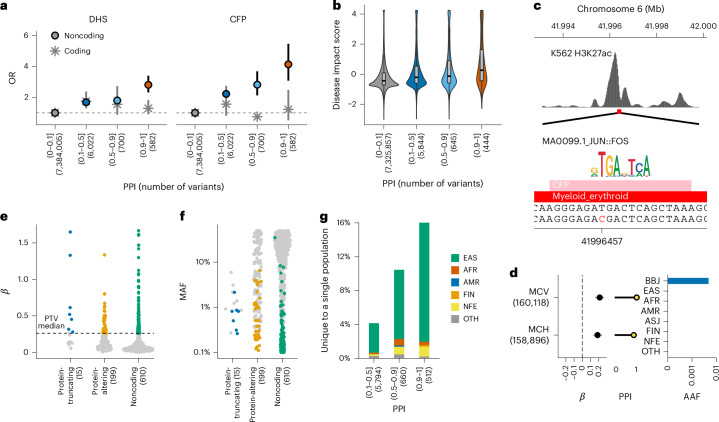
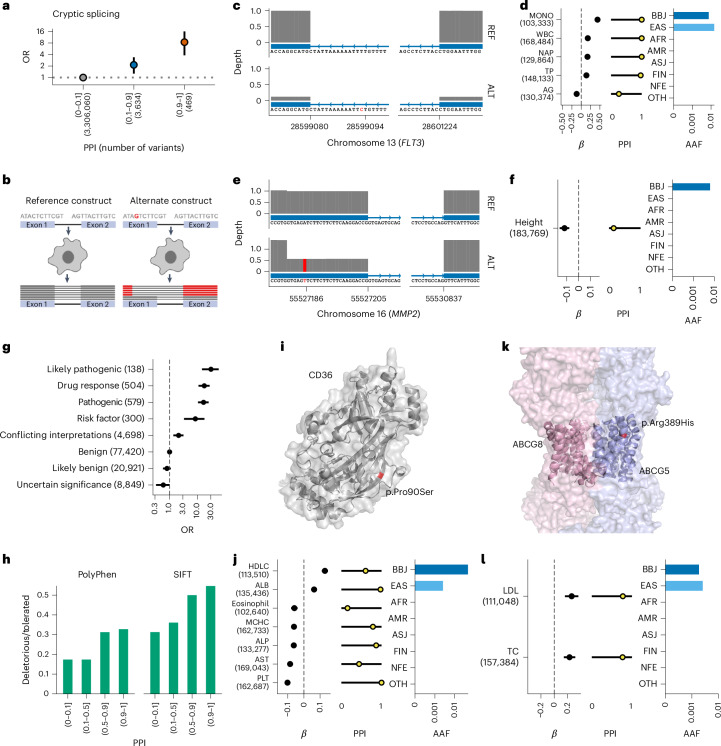
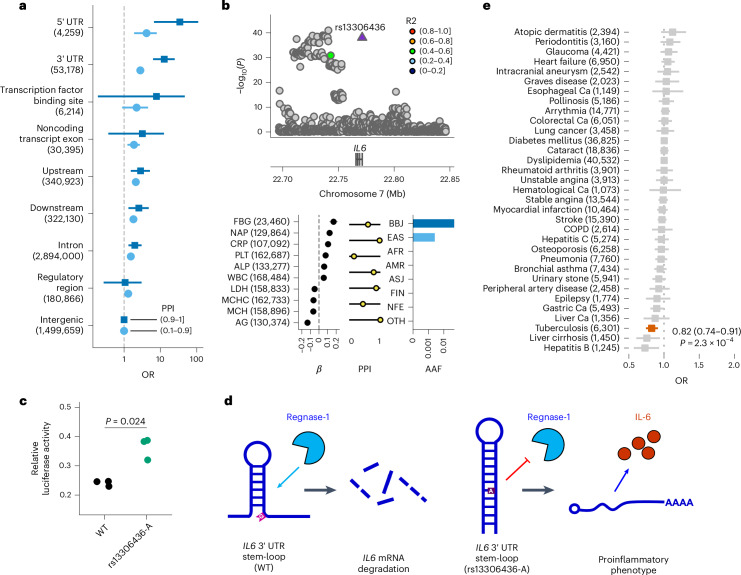
Human genetic variants are associated with many traits through largely unknown mechanisms. Here, combining approximately 260,000 Japanese study participants, a Japanese-specific genotype reference panel and statistical fine-mapping, we identified 4,423 significant loci across 63 quantitative traits, among which 601 were new, and 9,406 putatively causal variants. New associations included Japanese-specific coding, splicing and noncoding variants, exemplified by a damaging missense variant rs730881101 in TNNT2 associated with lower heart function and increased risk for heart failure (P = 1.4 × 10⁻¹⁵ and odds ratio = 4.5, 95% confidence interval = 3.1-6.5). Putative causal noncoding variants were supported by state-of-art in silico functional assays and had comparable effect sizes to coding variants. A plausible example of new mechanisms of causal variants is an enrichment of causal variants in 3' untranslated regions (UTRs), including the Japanese-specific rs13306436 in IL6 associated with pro-inflammatory traits and protection against tuberculosis. We experimentally showed that transcripts with rs13306436 are resistant to mRNA degradation by regnase-1, an RNA-binding protein. Our study provides a list of fine-mapped causal variants to be tested for functionality and underscores the importance of sequencing, genotyping and association efforts in diverse populations.


Conflict of interest statement

P.N. reports research grants from Allelica, Amgen, Apple, Boston Scientific, Genentech/Roche and Novartis; personal fees from Allelica, Apple, AstraZeneca, Blackstone Life Sciences, Creative Education Concepts, CRISPR Therapeutics, Eli Lilly & Co, Foresite Labs, Genentech/Roche, GV, HeartFlow, Magnet Biomedicine, Merck and Novartis; and scientific advisory board membership of Esperion Therapeutics, Preciseli and TenSixteen Bio. He is scientific cofounder of TenSixteen Bio; holds equity in MyOme, Preciseli and TenSixteen Bio; and reports spousal employment at Vertex Pharmaceuticals, all unrelated to the present work. The other authors declare no competing interests.

Figures

Fig. 1
Fig. 1. New rare putative causal coding variants associated with human quantitative traits implicate candidate causal genes.
a, Deleterious coding variant in TNNT2 (rs730881101) showing strong associations with cardiac functions. The horizontal axis indicates the genomic coordinates; the vertical axis indicates the negative log10(P). Statistical significance was tested using a linear mixed model. The displayed P values are two-sided and not adjusted for multiple testing. b, Three-dimensional structure of Troponin-T and putative effect of the coding variant. c, β estimates, PPI and alternative allele frequency (AAF) of rs730881101. The error bar for the β estimates indicates the 95% CI. The number of individuals included in the analysis is shown after the trait names. d, A deleterious coding variant in TNFRSF17 (rs150352299) showing strong associations with AG ratio and non-ALB protein levels. The horizontal axis indicates the genomic coordinates; the vertical axis indicates the negative log10(P). e, β estimates, PPI and AAF of rs150352299. f, Bulk tissue expression of TNFRSF17 in the GTEx. The number of samples is shown after the organ name. The violin plots show the distribution of gene expression in transcripts per million (TPM). The box plot shows the median value as the centerline; the box boundaries show the first and third quartiles and the whiskers extend 1.5 times the interquartile range. g, OR for 29 diseases of rs150352299 in unrelated Biobank Japan (BBJ) participants. Case counts are shown after the outcomes (nTotal = 169,020). The squares indicate the OR; the error bars indicate the 95% CI. Statistical significance was tested using a logistic regression with two-sided test at P < 0.05/29. The displayed P values were not adjusted for multiple testing. h, Deleterious coding variant in RYR1 (rs192863857) associated with CK levels. i, β estimate, PPI and AAF of rs192863857. j, Bulk tissue expression of RYR1 in the GTEx. AFR, African; AMR, Admixed American; ASJ, Ashkenazi Jewish; Ca, cancer; FIN, Finnish; NFE, non-Finnish European; OTH, others. The AAF was obtained from the Genome Aggregation Database (gnomAD) dataset. The number of individuals included in the association analysis is found in Supplementary Table 1; the abbreviations for the phenotypes are found in Supplementary Table 2.
Fig. 2
Fig. 2. Noncoding rare variants associated with human quantitative traits represent a substantial fraction of putative causal variants.
a, Enrichment of variants within the regulatory region in variants with high PPI. The vertical axis indicates the OR of variants in each PPI bin within the DHS/CFP or not in comparison with the variants with the lowest PPI bin (0–0.1). The error bars indicate the 95% CIs. The circles and stars indicate noncoding and coding variants, respectively. b, Higher predicted pathogenicity of noncoding putative causal variants. The vertical axis indicates the disease impact score predicted from its sequence changes (Methods). The box plot shows the median value as the centerline; the box boundaries show the first and third quartiles and the whiskers extend 1.5 times the interquartile range. c, A rare Japanese-specific noncoding variant rs146018792 in CCND3 strongly associated with MCV and MCH is in the CFP of the myeloid cell line K562. d, β estimates, PPI and AAF of rs146018792. The error bar for the β estimates indicates the 95% CI. The number of individuals included in the analysis is shown after the trait names. e, Distribution of the absolute β estimates of associations with a PPI > 0.9. The dashed line shows the median absolute β estimate of protein-truncating associations (median |βPTV | = 0.261). The colored dots indicate large effect associations with |β| > 0.261. f, Distribution of the MAFs of associations with a PPI > 0.9. The colored dots indicate the large effect associations defined in e. g, Proportion of population-specific variants within each PPI bin. The y axis indicates the fraction of variants found in only one population in each indicated PPI bin. The color indicates the population in which the variants were found. The AAF was obtained from the gnomAD dataset. The number of individuals included in the association analysis is found in Supplementary Table 1; the abbreviations for the phenotypes are found in Supplementary Table 2.
Fig. 3
Fig. 3. Rare population-specific putative causal splice variants and pathogenic variants associated with human quantitative traits.
a, Enrichment of putative cryptic splice variants among variants with high PPI. The vertical axis indicates the OR and 95% CI of the cryptic splice variants (Splice-AI delta score > 0.2) for each PPI bin (the horizontal axis) to the lowest PPI bin. The OR and 95% CI were estimated using a Fisher’s exact test. The number of variants included in the analysis is shown after the PPI bins. b, Schematic representation of the in vitro splicing assay. cf, Schematic representation of alternative splicing, effect size, PPI and population frequency of the cryptic splice variant rs76080105 (FLT3, c,d) and rs141440582 (MMP2, e,f). The error bar for the β estimates indicates the 95% CI. The number of individuals included in the analysis is shown after the trait names. The horizontal axes indicate the genomic coordinate. The vertical axes indicate the exon coverage of the RNA sequence from the reference construct (top) and the alternate construct (bottom). Variant sites are indicated in red. g, Enrichment of ClinVar variants among variants with a high PPI. The vertical axis indicates the categories in ClinVar. The horizontal axis indicates the OR of a high PPI using benign variants as reference and the 95% CI estimated using a Fisher’s exact test. The number of variants included in the analysis is shown after the variant annotations. h, Fraction of deleterious to tolerated variants evaluated using PolyPhen or sorting intolerant from tolerant (SIFT) in each PPI bin (horizontal axis). i, Schematic representation of the CD36 locus where rs75326924 is located. j, β estimates, PPI and AAF of rs75326924. k, Schematic representation of the ABCG5 locus where rs119480069 is located. l, β estimates, PPI and AAF of rs119480069. The AAF was obtained from the gnomAD dataset. The number of individuals included in the association analysis is found in Supplementary Table 1; the abbreviations for the phenotypes are found in Supplementary Table 2.
Fig. 4
Fig. 4. Enrichment of putative causal noncoding variants for functional annotations and a new mechanism of causal variants in 3′ UTR.
a, Enrichment of causal noncoding variants for functional annotations. Each point and error bar indicates the OR of variants with a high PPI ((0.1, 0.9] or (0.9, 1]) and the 95% CI, respectively. The 95% CIs were estimated using a Fisher’s exact test. b, Regional association plot and strong associations of the IL6 locus. The horizontal axis indicates the genomic coordinates and the vertical axis indicates a negative log10(P). Statistical significance was tested using a linear mixed model. The displayed P values are two-sided and were not adjusted for multiple testing. The β estimate, PPI and AAF in the global population of rs13306436 are shown. The error bar for the β estimates indicates the 95% CI. The number of individuals included in the analysis is shown after the trait name. c, rs13306436 showed resistance to regnase-1-mediated inhibition of a IL6 3′ UTR reporter. Overexpression of regnase-1 (10 ng per well) decreased expression of the reporter harboring the IL6 3′ UTR of both the wild-type (WT) (G) and variant (A) alleles of rs13306436, but the variant (A) allele of rs13306436 exhibited less of a decrease. The results are representative of experiments carried out in triplicate. Statistical significance was assessed using two-sided t-test. d, Working hypothesis of rs13306436 altering the posttranscriptional regulation of IL6 expression. Regnase-1 recognizes the stem-loop structure within the 3′ UTR of IL6 and leads to mRNA degradation. rs13306436 is located close to the stem-loop sequence; the variant (A) allele is more structured, which might suppress regnase-1-mediated degradation, thereby making the mRNA more stable (Supplementary Note 6.3). Short transcripts indicate degraded ones. e, OR for 29 diseases among carriers of rs13306436 in unrelated BBJ participants. Case counts are shown after the outcomes (nTotal = 169,020). The squares indicate the OR; the error bars indicate the 95% CI. Statistical significance was tested using a logistic regression with a two-sided test at P < 0.05/29. The displayed P values were not adjusted for multiple testing. The AAF was obtained from the gnomAD dataset. The number of individuals included in the association analysis is found in Supplementary Table 1; the abbreviations for the phenotypes are found in Supplementary Table 2.
Extended Data Fig. 1
Extended Data Fig. 1. Schematic of the study design.
BBJ, Biobank Japan; NCGG, National Center for Geriatrics and Gerontology; TOMMO, Tohoku Medical Megabank Organization; MHC, Major histocompatibility complex. The numbers of study participants (n) are those after quality control.
Extended Data Fig. 2
Extended Data Fig. 2. B cell-specific expression of TNFRSF17 and muscle-specific expression of RYR1 and CACNA1S.
a, Single-cell expression status of TNFRSF17 in 31,021 human peripheral blood mononuclear cells. In the right panel, TNFRSF17-expressing cells are highlighted. Color intensity indicates TNFRSF17 expression level. The left panel shows the cell population. Data were obtained from Single Cell Portal (Single Cell Comparison: PBMC data). b,c, Muscle-specific expression of RYR1 (b) and CACNA1S (c). Numbers of samples are shown after the organ name. Violin plots show distribution of gene expression in TPM. Boxplot shows the median value as the centerline; box boundaries show the first and third quartiles and whiskers extending 1.5 times the interquartile range. d, Strong association of CACNA1S with creatine kinase (CK) levels. Regional plot, beta estimate, PPI, and AAF of rs3850625 are indicated. The numbers of individuals included in the analysis are shown after the trait names. PPI, posterior probability of inclusion; AAF, alternate allele frequency; BBJ, Biobank Japan; EAS, East Asian; AFR, African; AMR, Admixed American; ASJ, Ashkenazi Jewish; FIN, Finnish; NFE, non-Finnish European; OTH, others. AAF was obtained from the gnomAD dataset. The numbers of individuals included in the association analysis are found in Supplementary Table 1.
Extended Data Fig. 3
Extended Data Fig. 3. Rare population-specific coding variants in novel gene-phenotype pairs.
a, The EAS-specific rare missense variant in USP47, rs138329346, is strongly associated with blood glucose levels. b, The Japanese-specific rare missense variant in ARHGAP36, rs773732451, is strongly associated with blood sodium and chloride levels. c, The EAS-specific rare missense variants in RFWD2, rs75124417, is associated with basophil counts. Beta estimates, PPI, and AAF of the associated variants are also indicated in each panel. The error bar for beta estimates indicates 95% confidence interval. The numbers of individuals included in the analysis are shown after the trait names. d, Enrichment of coding deleterious variants in variants with high PPI. The numbers of variants included in the analysis are shown after the PPI bins. PPI, posterior probability of inclusion; AAF, alternate allele frequency; BBJ, Biobank Japan; EAS, East Asian; AFR, African; AMR, Admixed American; ASJ, Ashkenazi Jewish; FIN, Finnish; NFE, non-Finnish European; OTH, others. AAF was obtained from the gnomAD dataset. The numbers of individuals included in the association analysis are found in Supplementary Table 1, and abbreviations for phenotypes are found in Supplementary Table 2.
Extended Data Fig. 4
Extended Data Fig. 4. Non-coding variants much more frequent in East Asians than Europeans in novel gene-phenotype pairs.
a, The non-coding variant in the LINC00670 region, rs78568419, which is much more frequent in EAS than EUR, is associated with platelet counts. b, The non-coding variant in the LIFR region, rs6451398, quite rare in Europeans, is associated with LDL levels. c, The non-coding variant in the HEY1 region, rs3841187, which is much more frequent in EAS than the other populations (almost absent in Europeans), showed an association with hemoglobin and hematocrit. d, The non-coding variant in the PAX4 region is associated with blood glucose levels. While this variant is similarly frequent between EAS and EUR, this association was not previously reported. Beta estimates, PPI, and AAF of the associated variants are also indicated in each panel. The error bar for beta estimates indicates 95% confidence interval. The numbers of individuals included in the analysis are shown after the trait names. PPI, posterior probability of inclusion; AAF, alternate allele frequency; BBJ, Biobank Japan; EAS, East Asian; AFR, African; AMR, Admixed American; ASJ, Ashkenazi Jewish; FIN, Finnish; NFE, non-Finnish European; OTH, others. AAF was obtained from the gnomAD dataset. The numbers of individuals included in the association analysis are found in Supplementary Table 1, and abbreviations for phenotypes are found in Supplementary Table 2.
Extended Data Fig. 5
Extended Data Fig. 5. In silico functional assessment of rs146018792, a blood-trait associated non-coding rare variant.
Functional prediction of a very rare putative causal variant rs146018792 by DeepSEA. a, Distribution of disease impact score of 7,289,211 non-coding variants in the 3,309 fine-mapped loci. b, Distribution of probability differences caused by rs146018792 in 2,002 regulatory features implemented in the DeepSEA model. The inset is a zoomed plot of the top 9 features negatively dysregulated by rs146018792. c, Distribution of probability differences of K562|c-Jun caused by 7,289,211 variants. PPI, posterior probability of inclusion.
Extended Data Fig. 6
Extended Data Fig. 6. High impact non-coding variant in the LDHB locus.
a, Regional association plot for the LDHB locus. The horizontal axis indicates genomic coordinates, and the vertical axis shows the negative log10 P-value. b, Beta estimate, PPI, and allele frequency in the global population of rs542962114. c, Schematic representation of LDHB locus where rs542962114 is located. The horizontal axis shows the genomic coordinate. d, Machine learning derived feature for rs542962114 (Methods). PPI, posterior probability of inclusion; AAF, alternate allele frequency; BBJ, Biobank Japan; EAS, East Asian; AFR, African; AMR, Admixed American; ASJ, Ashkenazi Jewish; FIN, Finnish; NFE, non-Finnish European; OTH, others. AAF was obtained from the gnomAD dataset. The numbers of individuals included in the association analysis are found in Supplementary Table 1, and abbreviations for phenotypes are found in Supplementary Table 2.
Extended Data Fig. 7
Extended Data Fig. 7. A novel rare non-coding variant in the PCSK9 locus confers very strong association with LDLC levels.
a, Estimated causal variant configuration at the PCSK9 locus for serum LDLC. The horizontal axes indicate genomic coordinates. Beta and P-value were determined by LDLC GWAS (n = 111,048). PPIs were determined by FINEMAP (Methods). The very rare non-coding variant rs188211891 showed a very strong association with the LDLC levels with high PPI. b, Pairwise linkage disequilibrium matrix of 7 putative causal variants in PCSK9 locus for LDLC association. Numeric values inside the rectangles indicate r2. c, Population frequencies of seven putative causal variants in this locus. Population frequencies were obtained from the gnomAD database. Chromatin immune-precipitation data were obtained from ENCODE portal. LDLC, low-density lipoprotein cholesterol; MAF, minor allele frequency; PPI, posterior probability of inclusion; AAF, alternate allele frequency; BBJ, Biobank Japan; EAS, East Asian; AFR, African; AMR, Admixed American; ASJ, Ashkenazi Jewish; FIN, Finnish; NFE, non-Finnish European; OTH, others. AAF was obtained from the gnomAD dataset. The numbers of individuals included in the association analysis are found in Supplementary Table 1, and abbreviations for phenotypes are found in Supplementary Table 2.
Extended Data Fig. 8
Extended Data Fig. 8. Tissue-specific enrichment of putative causal variants in regulatory elements.
The horizontal axes indicate the odds ratio of high PPI (0.1–1.0] variants within tissue-specific DHS to low PPI [0.0–0.1] variants. We display only DHS-vocabulary and trait pairs which showed significant associations after multiple-testing adjustment. Each point and error bar shows the odds ratios and 95% confidence intervals. The odds ratio and its 95% confidence interval were estimated by Fisher’s exact test. The numbers of variants included in the analysis are shown after the trait names. The numbers of individuals included in the association analysis are found in Supplementary Table 1, and abbreviations for phenotypes are found in Supplementary Table 2.
Extended Data Fig. 9
Extended Data Fig. 9. Enrichment of high PPI variants for causal eQTL variants and comparable enrichment of causal variants for functional annotations between UK and Japan.
a, Enrichment of causal eQTL variants in GTEx for variants with high PPI in the current study. The fine-mapped eQTL variants are obtained from results using DAP-G as a representative. Each point and error bar shows the enrichment odds ratios and 95% confidence interval. The odds ratio and its 95% confidence interval were estimated by Fisher’s exact test. The numbers of variants included in the analysis are shown after the PPI bins. b, Comparable distribution of credible set sizes between UKB and BBJ. c, Enhanced enrichment of causal variants in functional annotations in high PPI variants and comparable enrichment for functional annotations between Japanese data and UKB data. Each point and error bar shows the enrichment odds ratios and 95% confidence interval. The odds ratio and its 95% confidence interval were estimated by Fisher’s exact test. The numbers of variants included in the analysis are shown after the variant annotations (BBJ/UKB). d, Correlations of functional enrichment between UK and Japan in both sets of variants with different PPI. PPI, posterior probability of inclusion; BBJ, Biobank Japan; UKB UK Biobank; UTR, untranslated region; TF, transcription factor.
Extended Data Fig. 10
Extended Data Fig. 10. Enrichment of coding and non-coding causal variants in druggable genes.
a, Enrichment of drug-target genes for fine-mapped genes with variants with high PPI for coding and non-coding variants. b, Enrichment of genes in protein-protein networks for genes with variants with high PPI for coding and non-coding variants. c, Enrichment of genes containing pathogenic variants in the ClinVar for fine-mapped genes with variants with high PPI for coding and non-coding variants. Error bars indicate the first and third quartiles. Annotated P-value was estimated comparing genes with the highest PPI > 10% to the highest PPI ≤ 10% by two-sided Fisher’s exact test (a,c) and Wilcoxon rank-sum test (b). The numbers of variants included in the analysis are shown after the PPI bins. PPI, posterior probability of inclusion.

References

    1. Akiyama, M. et al. Genome-wide association study identifies 112 new loci for body mass index in the Japanese population. Nat. Genet.49, 1458–1467 (2017). - PubMed
    1. Buniello, A. et al. The NHGRI-EBI GWAS Catalog of published genome-wide association studies, targeted arrays and summary statistics 2019. Nucleic Acids Res.47, D1005–D1012 (2019). - PMC - PubMed
    1. Christophersen, I. E. et al. Large-scale analyses of common and rare variants identify 12 new loci associated with atrial fibrillation. Nat. Genet.49, 946–952 (2017). - PMC - PubMed
    1. Ghoussaini, M. et al. Open Targets Genetics: systematic identification of trait-associated genes using large-scale genetics and functional genomics. Nucleic Acids Res.49, D1311–D1320 (2021). - PMC - PubMed
    1. Ishigaki, K. et al. Large-scale genome-wide association study in a Japanese population identifies novel susceptibility loci across different diseases. Nat. Genet.52, 669–679 (2020). - PMC - PubMed

LinkOut - more resources