. 2024 Oct 3;14(1):22984.
doi: 10.1038/s41598-024-73345-4.

Persistence of post-stress blood pressure elevation requires activation of astrocytes

Affiliations

Persistence of post-stress blood pressure elevation requires activation of astrocytes

Yohei Hasebe et al. Sci Rep. .

Abstract

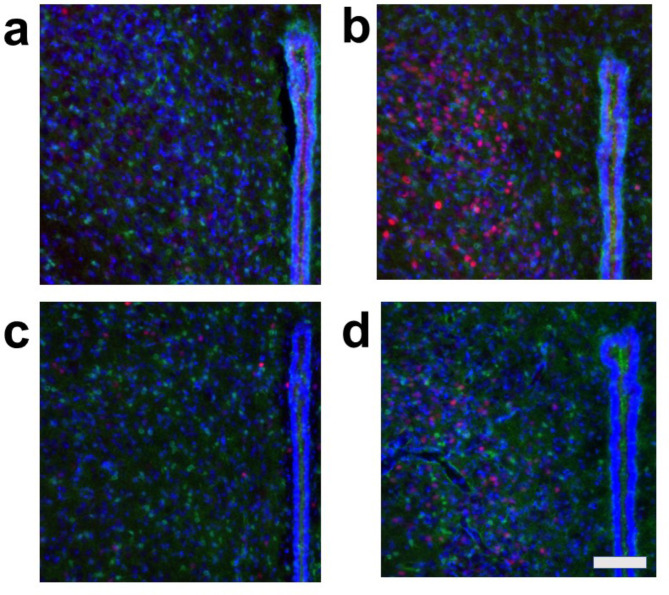
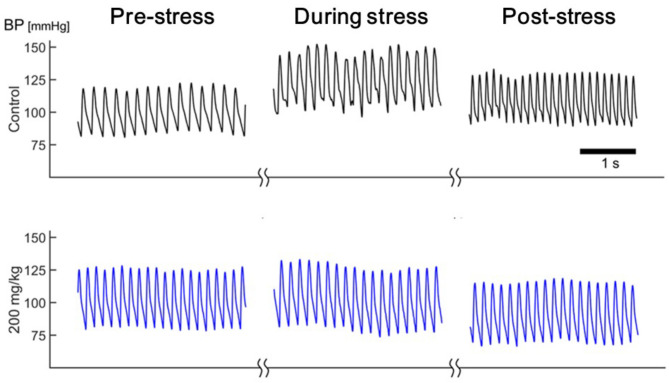
The reflexive excitation of the sympathetic nervous system in response to psychological stress leads to elevated blood pressure, a condition that persists even after the stress has been alleviated. This sustained increase in blood pressure, which may contribute to the pathophysiology of hypertension, could be linked to neural plasticity in sympathetic nervous activity. Given the critical role of astrocytes in various forms of neural plasticity, we investigated their involvement in maintaining elevated blood pressure during the post-stress phase. Specifically, we examined the effects of arundic acid, an astrocytic inhibitor, on blood pressure and heart rate responses to air-jet stress. First, we confirmed that the inhibitory effect of arundic acid is specific to astrocytes. Using c-Fos immunohistology, we then observed that psychological stress activates neurons in cardiovascular brain regions, and that this stress-induced neuronal activation was suppressed by arundic acid pre-treatment in rats. By evaluating astrocytic process thickness, we also confirmed that astrocytes in the cardiovascular brain regions were activated by stress, and this activation was blocked by arundic acid pre-treatment. Next, we conducted blood pressure measurements on unanesthetized, unrestrained rats. Air-jet stress elevated blood pressure, which remained high for a significant period during the post-stress phase. However, pre-treatment with arundic acid, which inhibited astrocytic activation, suppressed stress-induced blood pressure elevation both during and after stress. In contrast, arundic acid had no significant impact on heart rate. These findings suggest that both neurons and astrocytes play integral roles in stress-induced blood pressure elevation and its persistence after stress, offering new insights into the pathophysiological mechanisms underlying hypertension.


Conflict of interest statement

The authors declare no competing interests.

Figures

Fig. 1
Fig. 1
Cell-type specificity of arundic acid actions analyzed by ratiometric calcium imaging. (a,b) Arundic acid at concentrations of 0.01, 0.1 and 1 mM inhibited high potassium-induced astrocytic activation in a dose-dependent manner. (c,d) In contrast to astrocytes, arundic acid at concentrations of 0.01 or 0.1 mM did not affect high potassium-induced neuronal activation, while a higher concentration (1 mM) of arundic acid paradoxically activated neurons.
Fig. 2
Fig. 2
Double fluorescent immunostaining of c-Fos (red) and S100 (green) with DAPI (blue) staining in the central amygdala nucleus (CeA). (a) Condition a without arundic acid pre-treatment and without stress loading; (b) Condition b: without arundic acid pre-treatment and with stress loading; (c) Condition c: with arundic acid pre-treatment and without stress loading; (d) Condition d: with arundic acid pre-treatment and with stress loading. Under Condition b, a number of c-Fos positive cells were observed. The anatomical portion of the depicted brain region is shown in Fig. S3. Scale bar 100 μm.
Fig. 3
Fig. 3
Double fluorescent immunostaining of c-Fos (red) and S100 (green) with DAPI (blue) staining in the paraventricular nucleus of the hypothalamus (PVN). (a) Condition a without arundic acid pre-treatment and without stress loading; (b) Condition b: without arundic acid pre-treatment and with stress loading; (c) Condition c: with arundic acid pre-treatment and without stress loading; (d) Condition d: with arundic acid pre-treatment and with stress loading. Under Condition b, a number of c-Fos positive cells were observed. The anatomical portion of the depicted brain region is shown in Fig. S3. Scale bar 100 μm.
Fig. 4
Fig. 4
Double fluorescent immunostaining of c-Fos (red) and S100 (green) with DAPI (blue) staining in the dorsomedial hypothalamus (DMH). (a) Condition a without arundic acid pre-treatment and without stress loading; (b) Condition b: without arundic acid pre-treatment and with stress loading; (c) Condition c: with arundic acid pre-treatment and without stress loading; (d) Condition d: with arundic acid pre-treatment and with stress loading. Under Condition b, a number of c-Fos positive cells were observed. The anatomical portion of the depicted brain region is shown in Fig. S3. Scale bar 100 μm.
Fig. 5
Fig. 5
Double fluorescent immunostaining of c-Fos (red) and S100 (green) with DAPI (blue) staining in the rostral ventral medulla (RVM). (a) Condition a without arundic acid pre-treatment and without stress loading; (b) Condition b: without arundic acid pre-treatment and with stress loading; (c) Condition c: with arundic acid pre-treatment and without stress loading; (d) Condition d: with arundic acid pre-treatment and with stress loading. Under Condition b, a number of c-Fos positive cells were observed in the superficial ventral medullary region, i.e., in the cardiovascular region RVM. Double positivity for c-Fos and S100 (yellow in color) was rare, as exemplified by a cell under Condition a (arrow). Bottom oblique line, ventral medullary surface. The anatomical portion of the depicted brain region is shown in Fig. S3. Scale bar 100 μm.
Fig. 6
Fig. 6
Double fluorescent immunostaining of c-Fos (red) and GFAP (green) with DAPI (blue) staining in the central amygdala nucleus (CeA). (a) Condition a without arundic acid pre-treatment and without stress loading; (b) Condition b: without arundic acid pre-treatment and with stress loading; (c) Condition c: with arundic acid pre-treatment and without stress loading; (d) Condition d: with arundic acid pre-treatment and with stress loading. Under Conditions b and c, a number of c-Fos positive cells were observed. The anatomical portion of the depicted brain region is shown in Fig. S3. Scale bar 100 μm.
Fig. 7
Fig. 7
Double fluorescent immunostaining of c-Fos (red) and GFAP (green) with DAPI (blue) staining in the paraventricular nucleus of the hypothalamus (PVN). (a) Condition a without arundic acid pre-treatment and without stress loading; (b) Condition b: without arundic acid pre-treatment and with stress loading; (c) Condition c: with arundic acid pre-treatment and without stress loading; (d) Condition d: with arundic acid pre-treatment and with stress loading. Under Condition b, a number of c-Fos positive cells were observed. The anatomical portion of the depicted brain region is shown in Fig. S3. Scale bar 100 μm.
Fig. 8
Fig. 8
Double fluorescent immunostaining of c-Fos (red) and GFAP (green) with DAPI (blue) staining in the dorsomedial hypothalamus (DMH). (a) Condition a without arundic acid pre-treatment and without stress loading; (b) Condition b: without arundic acid pre-treatment and with stress loading; (c) Condition c: with arundic acid pre-treatment and without stress loading; (d) Condition d: with arundic acid pre-treatment and with stress loading. Under Condition b, a number of c-Fos positive cells were observed. The anatomical portion of the depicted brain region is shown in Fig. S3. Scale bar; 100 μm.
Fig. 9
Fig. 9
Double fluorescent immunostaining of c-Fos (red) and GFAP (green) with DAPI (blue) staining in the rostral ventral medulla (RVM). (a) Condition a without arundic acid pre-treatment and without stress loading; (b) Condition b: without arundic acid pre-treatment and with stress loading; (c) Condition c: with arundic acid pre-treatment and without stress loading; (d) Condition d: with arundic acid pre-treatment and with stress loading. GFAP positive fibers were densely distributed just beneath the ventral medullary surface and constituted the glia limitans (marginal glial layer). Under Condition b, a number of c-Fos positive cells were observed in the superficial ventral medullary region, i.e., in the cardiovascular region RVM, Although the cells with arrows appeared yellow or orange, they were not double-positive for c-Fos and GFAP; their c-Fos-positive nuclei and GFAP-positive structures were not precisely aligned on the same z-axis planes. Bottom oblique line, ventral medullary surface. The anatomical portion of the depicted brain region is shown in Fig. S3. Scale bar; 100 μm.
Fig. 10
Fig. 10
Diameters of the first-order processes of astrocytes in the cardiovascular brain areas CeA, PVN, DMH and RVM under each drug condition. The diameter of astrocytic first-order processes under Condition b (without arundic acid, with stress) tended to be consistently larger than under other conditions, suggesting that air-jet stress activated astrocytes in the cardiovascular brain areas. This activation was suppressed by pre-treatment with arundic acid. (a) Condition a without arundic acid pre-treatment and without stress loading; (b) Condition b: without arundic acid pre-treatment and with stress loading; (c) Condition c: with arundic acid pre-treatment and without stress loading; (d) Condition d: with arundic acid pre-treatment and with stress loading. Horizontal dotted lines indicate the pairs that are statistically different, Bonferroni corrected p < 0.05. Horizontal dotted lines indicate statistically significant differences (Bonferroni corrected, p < 0.05), while horizontal solid lines indicate more robust statistical significance (Bonferroni corrected, p < 0.01).
Fig. 11
Fig. 11
Representative blood pressure recordings during pre-stress, stress loading and post-stress periods in a rat under each drug condition. In the pre-stress resting state, blood pressure did not differ across drug conditions. Under the control condition (without arundic acid pre-treatment), the rat exhibited significant blood pressure elevation with fluctuations during stress, which persisted throughout the post-stress observation period. After arundic acid pre-treatment, blood pressure elevation during stress loading was reduced, and the blood pressure tended to be lower once the stress loading ended. The “during stress” panel represents 1 min after the onset of stress loading; the “post-stress” panel represents 8 min after the end of stress loading. Time bar: 1 s.
Fig. 12
Fig. 12
Changes in mean arterial blood pressure (MAP). (a) Time course of MAP before, during, and after stress loading. MAP values obtained from all tested rats were averaged and normalized to baseline (MAP recorded for 2.5 min before stress loading) and set as 100%. Stress-induced blood pressure elevation during and after stress loading was suppressed by prior administration of arundic acid in a dose-dependent manner. (b) Average change in MAP (ΔMAP) during air-jet stress (left) and post-stress (right) periods compared to the pre-stress resting state. ΔMAP during stress was significantly diminished by arundic acid pre-treatment in a dose-dependent manner. Although ΔMAP during the post-stress period remained positive under the control condition, it decreased and became negative with arundic acid pre-treatment in a dose-dependent manner. Data are presented as means ± SE, n = 13 per group. *Bonferroni corrected, p < 0.05 vs. control group.
Fig. 13
Fig. 13
Changes in heart rate (HR). (a) Time course of HR before, during, and after stress loading. HR values from all tested rats were averaged and normalized to baseline (HR recorded for 2.5 min before stress loading) and set as 100%. Stress-induced HR increase was suppressed by prior administration of a representative high dose of arundic acid (200 mg/kg), although the effect of arundic acid on HR responses to stress was not dose-dependent. (b) Average change in HR (ΔHR) during air-jet stress (left) and post-stress (right) periods compared to the pre-stress resting state. There was no significant difference compared to the control in any period. Data are presented as means ± SE, n = 13 per group.

References

    1. Grassi, G., Mark, A. & Esler, M. The sympathetic nervous system alterations in human hypertension. Circ. Res.116, 976–990 (2015). - PMC - PubMed
    1. Lawler, J. E. et al. Blood pressure and heart rate responses to environmental stress in the spontaneously hypertensive rat. Physiol. Behav.34, 973–976 (1985). - PubMed
    1. Gerin, W. & Pickering, T. G. Association between delayed recovery of blood pressure after acute mental stress and parental history of hypertension. J. Hypertens.13, 603–610 (1995). - PubMed
    1. Steptoe, A. & Marmot, M. Impaired cardiovascular recovery following stress predicts 3-year increases in blood pressure. J. Hypertens.23, 529–536 (2005). - PubMed
    1. Bobrovskaya, L. et al. Does exposure to chronic stress influence blood pressure in rats? Auton. Neurosci.177, 217–223 (2013). - PubMed

Substances

LinkOut - more resources