. 2024 Oct;27(10):1864-1879.
doi: 10.1038/s41593-024-01747-8. Epub 2024 Oct 3.

Exome sequencing of 20,979 individuals with epilepsy reveals shared and distinct ultra-rare genetic risk across disorder subtypes

Collaborators

Exome sequencing of 20,979 individuals with epilepsy reveals shared and distinct ultra-rare genetic risk across disorder subtypes

Epi25 Collaborative. Nat Neurosci. 2024 Oct.

Abstract

Identifying genetic risk factors for highly heterogeneous disorders such as epilepsy remains challenging. Here we present, to our knowledge, the largest whole-exome sequencing study of epilepsy to date, with more than 54,000 human exomes, comprising 20,979 deeply phenotyped patients from multiple genetic ancestry groups with diverse epilepsy subtypes and 33,444 controls, to investigate rare variants that confer disease risk. These analyses implicate seven individual genes, three gene sets and four copy number variants at exome-wide significance. Genes encoding ion channels show strong association with multiple epilepsy subtypes, including epileptic encephalopathies and generalized and focal epilepsies, whereas most other gene discoveries are subtype specific, highlighting distinct genetic contributions to different epilepsies. Combining results from rare single-nucleotide/short insertion and deletion variants, copy number variants and common variants, we offer an expanded view of the genetic architecture of epilepsy, with growing evidence of convergence among different genetic risk loci on the same genes. Top candidate genes are enriched for roles in synaptic transmission and neuronal excitability, particularly postnatally and in the neocortex. We also identify shared rare variant risk between epilepsy and other neurodevelopmental disorders. Our data can be accessed via an interactive browser, hopefully facilitating diagnostic efforts and accelerating the development of follow-up studies.


Figures

Extended Data Fig. 1:
Results from burden analysis of synonymous URVs. a,b, Burden of synonymous URVs at the individual-gene (a) and the gene-set (b) level. The observed −log10-transformed P values are plotted against the expectation given a uniform distribution. Burden analyses are performed across four epilepsy groups – 1,938 DEEs, 5,499 GGE, 9,219 NAFE, and 20,979 epilepsy-affected individuals combined – versus 33,444 controls. P values are computed using a Firth logistic regression model testing the association between the case-control status and the number of URVs (two-sided); the red dashed line indicates exome-wide significance P=3.4×10⁻⁷ after Bonferroni correction (see Methods).
Extended Data Fig. 2:
Spatiotemporal expression of 13 exome-wide significant genes in the human brain. Expression values (log2[TPM+1]) are normalized to the mean for each BrainSpan sample; each dot represents the expression value of a particular gene in a sample collected in a particular brain region and developmental time (from early fetal to adulthood: N=47/5/5/9/5/4, 69/6/6/7/5/4, 19/2/1/2/1/2, 27/2/2/2/2/3, 30/2/3/2/3/3, 41/3/4/3/4/5, 30/3/3/1/1/3, 36/3/3/2/2/4, and 63/6/6/6/6/6 neocortex/hippocampus/amygdala/striatum/thalamus/cerebellum samples, respectively). LOESS smooth curves are plotted for each brain region across developmental time.
Extended Data Fig. 3:
Distributions of URVs from this study and de novo variants from other NDD studies on the same genes. Schematic protein plots of nine genes that are significant in both our epilepsy cohort (DEE: developmental and epileptic encephalopathy; EPI: all-epilepsy combined) and previous large-scale WES studies of severe developmental disorders (DD) and/or autism spectrum disorder (ASD) are shown. Asterisk indicates recurring URVs in epilepsy; recurring de novo variants in DD/ASD as well as detailed variant information are provided in Supplementary Data 13.
Extended Data Fig. 4:
Results from genetic ancestry- and sex-specific burden analyses. a, The numbers of epilepsy cases (orange) and controls (blue) by genetic ancestry. b, Comparison of protein-truncating (left) and damaging missense (right) URV burden in the top ten genes from the primary analysis (“All”) across genetic ancestry subgroups. Red color indicates enrichment in cases (log[OR]>1), with an asterisk indicating nominal significance (P≤0.05; see Supplementary Data 14 for exact P values). P values are computed using a Firth logistic regression model testing the association between the case-control status and the number of URVs (two-sided). c, Genetic ancestry-specific burden of URVs in established epilepsy genes (N=171 curated by the Genetic Epilepsy Syndromes [GMS] panel with a known monogenic/X-linked cause), constrained genes (N=1,917 scored by the loss-of-function observed/expected upper bound fraction [LOEUF] metric as the most constrained 10% genes), and constrained genes excluding established epilepsy genes (N=1,813). Overall, different ancestral groups show at least partially shared burden of deleterious URVs in these gene sets. In a-c, NFE: Non-Finnish European (Ncase=16,040, Ncontrol=25,641), AFR: African (Ncase=1,598, Ncontrol=2,592), AMR: Ad Mixed American (Ncase=480, Ncontrol=3,106), EAS: East Asian (Ncase=1,698, Ncontrol=1,215), FIN: Finnish (Ncase=926, Ncontrol=537), SAS: South Asian (Ncase=237, Ncontrol=353). d, Sex-specific burden of URVs in established epilepsy genes. Burden analyses are performed for three gene sets described in c, with an additional set of 37 X-linked GMS epilepsy genes, across four epilepsy groups (female: NDEE=811, NGGE=4,807, NNAFE=3,511, NEPI(all)=11,372, Ncontrol=18,144; male: NDEE=997, NGGE=2,579, NNAFE=4,395, NEPI(all)=10,397, Ncontrol=15,302). There is an overall trend of shared URV burden between female and male subgroups in these gene sets. In c and d, the dot represents the log odds ratio and the error bars represent the 95% confidence intervals of the point estimates. For presentation purposes, error bars that exceed a large log odds ratio value are capped, indicated by arrows at the end of the error bars (see Supplementary Data 14 and 15 for exact values). e, Comparison of sex-specific burden of protein-truncating URVs at level of the individual genes. For each gene, the −log10-transformed P value from the female subgroup analysis (y-axis) is plotted against that from the male subgroup analysis (x-axis). Top ten genes with URV burden in epilepsy are labeled for each subgroup, with genes on the sex chromosomes colored in blue. The red dashed line indicates exome-wide significance P=3.4×10⁻⁷ after Bonferroni correction.
Extended Data Fig. 5:
Results from burden analysis of protein-truncating and damaging missense URVs combined. a, Joint burden of protein-truncating and damaging missense URVs at the individual-gene level. The observed −log10-transformed P values are plotted against the expectation given a uniform distribution. Burden analyses are performed across four epilepsy groups – 1,938 DEEs, 5,499 GGE, 9,219 NAFE, and 20,979 epilepsy-affected individuals combined – versus 33,444 controls. P values are computed using a Firth logistic regression model testing the association between the case-control status and the number of URVs (two-sided); the red dashed line indicates exome-wide significance P=3.4×10⁻⁷ after Bonferroni correction (see Methods). b, Comparison of the joint burden in a with the burden of protein-truncating URVs. The odds ratio (OR) of protein-truncating plus damaging missense URVs (y-axis) and that of protein-truncating URVs alone (x-axis) are compared. Each dot represents a gene with significant enrichment (OR>0 and P≤0.05) of either protein-truncating URVs or the two variant classes combined.
Extended Data Fig. 6:
URV discovery and burden results across Epi25 data collection. a, Increase in the number of protein-truncating and damaging missense URVs discovered in epilepsy genes with a known monogenic cause. b, Increase in the number of monogenic epilepsy genes identified with a protein-truncating or damaging missense URV. In a and b, variant/gene count is plotted against the year of Epi25 data collection; the total number of epilepsy cases analyzed in each year is indicated in parenthesis. c, URV burden of previously top-ranked genes in this study. The odds ratio of protein-truncating URVs in genes from this study (y-axis) and the prior Epi25 publication (x-axis) are compared. Each dot represents one of the top ten genes implicated by our previous burden analysis (across three epilepsy subtypes). Genes with a known monogenic/X-linked cause are labeled and colored in purple. d, Increase in the total, non-European ancestry, and effective sample size in this study over our previous publications. The effective sample size is computed as 4/(1/Ncase+1/Ncontrol). e,f, The sample size required for well-powered gene burden testing. The percentage of genes powered to detect significant URV burden (Fisher’s exact P ≤0.05) at different effect sizes (e) and case:control ratios (f) is shown as a function of log-scaled sample size of epilepsy cases. Lighter color indicates smaller effect size (weaker burden), which requires a larger sample size to detect. The gray vertical line indicates the current sample size of 20,979 cases. In e, horizontal lines indicate 80% and 50% detection power, and vertical dashed lines indicate the estimated number of cases required to achieve 80% at the benchmarked effective sizes. In f, dashed and dotted curves indicate power estimation with increased control:case ratios from 1.6 (in this study) to 3.2 and 6.4, respectively; horizontal lines indicate the estimated power achieved by doubling and quadrupling the number of controls at the current sample size of cases. g, Epilepsy subtype-specific burden of URVs in established epilepsy genes (N=171 curated by the Genetic Epilepsy Syndromes [GMS] panel with a known monogenic/X-linked cause), constrained genes (N=1,917 scored by the loss-of-function observed/expected upper bound fraction [LOEUF] metric as the most constrained 10% genes), and constrained genes excluding established epilepsy genes (N=1,813). Burden analyses are performed across three epilepsy subtypes – 1,938 DEEs, 5,499 GGE, and 9,219 NAFE – versus 33,444 controls. Protein-truncating and damaging missense URVs from DEEs exhibit the strongest enrichment in epilepsy panel genes, while all epilepsy subtypes show significant enrichment in constrained genes even after excluding the panel genes. No enrichment is observed for synonymous URVs. The dot represents the log odds ratio and the error bars represent the 95% confidence intervals of the point estimates.
Fig. 1:
Fig. 1:
Results from gene-based burden analysis of URVs. a,b, Burden of protein-truncating (a) and damaging missense (b) URVs in each protein-coding gene with at least one epilepsy or control carrier. The observed −log10-transformed P values are plotted against the expectation given a uniform distribution. For each variant class, burden analyses are performed across four epilepsy groups – 1,938 DEEs, 5,499 GGE, 9,219 NAFE, and 20,979 epilepsy-affected individuals combined – versus 33,444 controls. P values are computed using a Firth logistic regression model testing the association between the case-control status and the number of URVs (two-sided); the red dashed line indicates exome-wide significance P=3.4×10⁻⁷ after Bonferroni correction (see Methods). Top ten genes with URV burden in epilepsy are labeled.
Fig. 2:
Fig. 2:
Results from gene-set-based burden analysis of URVs. a,b, Burden of protein-truncating (a) and damaging missense (b) URVs in each gene set (gene family/protein complex) with at least one epilepsy or control carrier. The observed −log10-transformed P values are plotted against the expectation given a uniform distribution. For each variant class, burden analyses are performed across four epilepsy groups – 1,938 DEEs, 5,499 GGE, 9,219 NAFE, and 20,979 epilepsy-affected individuals combined – versus 33,444 controls. P values are computed using a Firth logistic regression model testing the association between the case-control status and the number of URVs (two-sided); the red dashed line indicates exome-wide significance P=1.2×10⁻⁶ after Bonferroni correction (see Methods). Top five gene sets with URV burden in epilepsy are labeled. c, Burden of damaging missense URVs in the (α1)2(β2)2(γ2) GABAA receptor complex with respect to its structural domain. Left, forest plots showing the stronger enrichment of damaging missense URVs in the transmembrane domain (TMD) than the extracellular domain (ECD), and the unique signal from DEEs in the second TMD (TMD-2) that forms the ion channel pore. The dot represents the log odds ratio and the error bars represent the 95% confidence intervals of the point estimates. For presentation purposes, error bars that exceed a log odds ratio of 5 are capped, indicated by arrows at the end of the error bars (see Supplementary Data 6 for exact values). Right, a co-crystal structure (PDB ID: 6X3Z) showing the pentameric subunits of the receptor and highlighting the two protein-truncating URVs from DEEs located in the pore-forming domain.
Fig. 3:
Fig. 3:
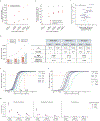
Protein structural analysis of missense URVs in ion channel genes. a, Correlation between ddG and MPC in measuring the deleteriousness of missense URVs. A higher absolute ddG value suggests a more deleterious effect on protein stability; positive (orange) and negative (blue) values suggest destabilizing and stabilizing effects, respectively. Box plots show the distribution of ddG values across different MPC ranges (blue boxes: N=232, 272, and 242 for MPC<1, 1≤MPC<2, and MPC≥2, respectively; orange boxes: N=327, 397, and 342 or MPC<1, 1≤MPC<2, and MPC≥2, respectively). The center line represents the median (50th percentile) and the bounds of the box indicate the 25th and 75th percentiles, with the whiskers extending to the minimum and maximum values within 1.5 times the interquartile range from the lower and upper quartiles, respectively. b, Burden of damaging missense URVs stratified by ddG. Stronger enrichment is observed when applying ∣ddG∣≥1 to further prioritize damaging missense URVs with MPC≥2. c, Burden and distribution of destabilizing (ddG≥1) and stabilizing (ddG≤−1) missense URVs on the (α1)2(β2)2(γ2) GABAA receptor complex with respect to its structural domain. Top, forest plots showing the stronger enrichment of destabilizing missense URVs (orange) in the extracellular domain (ECD) and stabilizing missense URVs (blue) in the transmembrane domain (TMD). Bottom, schematic plots displaying the distribution of destabilizing and stabilizing missense URVs on GABAA receptor proteins. URVs found in epilepsy cases are plotted above the protein and those from controls are plotted below the protein. The number of epilepsy and control carriers are listed in the table above. In b and c, burden analyses are performed across four epilepsy groups – 1,938 DEEs, 5,499 GGE, 9,219 NAFE, and 20,979 epilepsy-affected individuals combined – versus 33,444 controls. The dot represents the log odds ratio and the error bars represent the 95% confidence intervals of the point estimates.
Fig. 4:
Fig. 4:
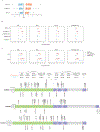
Convergence of CNV deletions and protein-truncating URVs in gene-based burden. a, Joint burden of CNV deletions and protein-truncating URVs in each protein-coding gene with at least one epilepsy or control carrier. The observed −log10-transformed P values are plotted against the expectation given a uniform distribution. Joint burden analyses are performed on the subset of samples that passed CNV calling QC (see Methods), across four epilepsy groups – 1,743 DEEs, 4,980 GGE, 8,425 NAFE, and 18,963 epilepsy-affected individuals combined – versus 29,804controls; for genes that do not have a CNV deletion called, results from the burden analysis of protein-truncating URVs on the full sample set are shown. P values are computed using a Firth logistic regression model testing the association between the case-control status and the number of URVs (two-sided); the red dashed line indicates exome-wide significance P=3.4×10⁻⁷ after Bonferroni correction (see Methods). Top ten genes with variant burden in epilepsy are labeled. b, Joint burden of CNV deletions and protein-truncating URVs in the top ten genes ranked by protein-truncating URV burden. Only genes affected by both variant types with enrichment in epilepsy (log[OR]>0) are show. For comparison, the burden of protein-truncating URVs (SNVs/indels; red), CNV deletions (gray), and the joint (purple) are analyzed on the same sample subset as described in a. The dot represents the log odds ratio and the error bars represent the 95% confidence intervals of the point estimates. For presentation purposes, error bars that exceed a log odds ratio of 5 are capped, indicated by arrows at the end of the error bars (see Supplementary Data 10 for exact values). c, Genomic location and distribution of CNV deletions and protein-truncating URVs with respect to the NPRL3 and DEPDC5 genes. Variants found in epilepsy cases (red) are plotted above the schematic gene plots and those from controls (gray) are plotted below the gene. The number of epilepsy and control carriers are listed in the table above. P values are computed using a Firth logistic regression model testing the association between the case-control status and the number of URVs (two-sided).
Fig. 5:
Fig. 5:
Epilepsy genetic architecture from large-scale genetic association studies. a, An allelic spectrum of epilepsy genetic risk loci. Significant risk loci identified by large-scale WES and GWA studies are shown. The odds ratio of each risk loci (y-axis) is plotted against the minor allele frequency in the general population (gnomAD non-neuro subset, x-axis); for individual genes, the cumulative allele frequency (CAF) is computed, and for gene sets, the CAF is averaged over gene members. The color and size of each dot represent the variant class and effect size (odds ratio) of the genetic association. Bold indicates convergent findings between different variant classes. The shaded area represents the upper and lower 95% confidence intervals of the point estimates, fitted by exponential curves. b, Burden of URVs in genes implicated by GWAS loci. Significant enrichment is observed for URVs from epilepsy-affected individuals in 29 GWAS genes (upper: 20,979 cases versus 33,444 controls), URVs from GGE in the 23 GGE-specific GWAS genes (middle: 5,499 GGE versus 33,444 controls), but not for URVs from NAFE in GGE GWAS genes (bottom: 9,219 NAFE versus 33,444 controls); and significance was only seen for protein-truncating (red) and damaging missense (orange) URVs but not for synonymous URVs (gray). The dot represents the log odds ratio and the error bars represent the 95% confidence intervals of the point estimates.
Fig. 6:
Fig. 6:
Functional analysis of candidate epilepsy genes. a,b, Spatiotemporal brain transcriptome analysis of exome/genome-wide significant genes identified in this WES study (N=13) or our recent GWA study (N=29) (a) and the top 20 genes enriched for deleterious URVs in each subtype of epilepsy (b). Candidate genes show the highest expression in the neocortex during postnatal periods. The expression values (log2[TPM+1]) are normalized to the mean for each BrainSpan sample and then averaged by each candidate gene set. Significance was evaluated by Wilcoxon signed rank test (N=162/200, 15/17, 14/19, 20/14, 13/16, and 13/21 for prenatal/postnatal neocortex, hippocampus, amygdala, striatum, thalamus, and cerebellum samples, respectively). Box plots indicate median, interquartile range (IQR) with whiskers adding IQR to the first and third quartiles. c, Gene Ontology terms enriched for candidate epilepsy genes with a prenatal- or postnatal- expression bias (N=43 and 50, respectively). Vertical dashed line indicates false discovery rate (FDR)=0.05; the full list of enriched terms is provided in Supplementary Data 12. d, A schematic diagram showing the distribution and function of 34 postnatally-biased genes on neuron structures. SV: synaptic vesicle, PSD: post-synaptic density, ER: endoplasmic reticulum.
Fig. 7:
Fig. 7:
Shared rare variant risk between epilepsy and other NDDs. a, Burden of URVs in genes implicated by WES of severe developmental disorders (DD; N=285), autism spectrum disorder (ASD; N=185), and schizophrenia (SCZ; N=32). Burden analyses are performed across four variant classes and four epilepsy groups – 1,938 DEEs, 5,499 GGE, 9,219 NAFE, and 20,979 epilepsy-affected individuals combined – versus 33,444 controls. Overall, DD/ASD-associated genes show stronger enrichment of epilepsy URVs than SCZ. The dot represents the log odds ratio and the error bars represent the 95% confidence intervals of the point estimates. b, Distribution of rare variants from GGE and other NDDs on the KDM6B protein. Top, a schematic protein plot displaying the distribution of protein-truncating (darker red) and damaging missense (lighter red) variants on KDM6B. Bottom, a schematic protein plot displaying the distribution of damaging missense variants with a likely destabilizing (ddG>0; orange) and stabilizing (ddG<0; blue) effect on KDM6B. In both plots, variants found in GGE are plotted above the protein and those from other NDDs are plotted below the protein (in the order of DD, ASD, and SCZ as labeled); the number of variant carriers are listed accordingly on the right.

Update of

  • Exome sequencing of 20,979 individuals with epilepsy reveals shared and distinct ultra-rare genetic risk across disorder subtypes.
    Chen S, Abou-Khalil BW, Afawi Z, Ali QZ, Amadori E, Anderson A, Anderson J, Andrade DM, Annesi G, Arslan M, Auce P, Bahlo M, Baker MD, Balagura G, Balestrini S, Banks E, Barba C, Barboza K, Bartolomei F, Bass N, Baum LW, Baumgartner TH, Baykan B, Bebek N, Becker F, Bennett CA, Beydoun A, Bianchini C, Bisulli F, Blackwood D, Blatt I, Borggräfe I, Bosselmann C, Braatz V, Brand H, Brockmann K, Buono RJ, Busch RM, Caglayan SH, Canafoglia L, Canavati C, Castellotti B, Cavalleri GL, Cerrato F, Chassoux F, Cherian C, Cherny SS, Cheung CL, Chou IJ, Chung SK, Churchhouse C, Ciullo V, Clark PO, Cole AJ, Cosico M, Cossette P, Cotsapas C, Cusick C, Daly MJ, Davis LK, Jonghe P, Delanty N, Dennig D, Depondt C, Derambure P, Devinsky O, Di Vito L, Dickerson F, Dlugos DJ, Doccini V, Doherty CP, El-Naggar H, Ellis CA, Epstein L, Evans M, Faucon A, Feng YA, Ferguson L, Ferraro TN, Da Silva IF, Ferri L, Feucht M, Fields MC, Fitzgerald M, Fonferko-Shadrach B, Fortunato F, Franceschetti S, French JA, Freri E, Fu JM, Gabriel S, Gagliardi M, Gambardella A, Gauthier L, Giangregorio T, Gili T, Glauser TA, Goldberg E, Goldman A, Goldstein DB, Granata T, Grant R, Greenberg DA, Guerrini R, Gundogdu-Eken A, Gu… See abstract for full author list ➔ Chen S, et al. medRxiv [Preprint]. 2024 Sep 20:2023.02.22.23286310. doi: 10.1101/2023.02.22.23286310. medRxiv. 2024. Update in: Nat Neurosci. 2024 Oct;27(10):1864-1879. doi: 10.1038/s41593-024-01747-8. PMID: 36865150 Free PMC article. Updated. Preprint.

Comment in

References

    1. Fisher RS et al. ILAE official report: a practical clinical definition of epilepsy. Epilepsia 55, 475–482, doi: 10.1111/epi.12550 (2014). - DOI - PubMed
    1. World Health Organization. Epilepsy: a public health imperative., (2022).
    1. Annegers JF, Hauser WA, Anderson VE & Kurland LT The risks of seizure disorders among relatives of patients with childhood onset epilepsy. Neurology 32, 174–179, doi: 10.1212/wnl.32.2.174 (1982). - DOI - PubMed
    1. Berkovic SF, Howell RA, Hay DA & Hopper JL Epilepsies in twins: genetics of the major epilepsy syndromes. Ann Neurol 43, 435–445, doi: 10.1002/ana.410430405 (1998). - DOI - PubMed
    1. Oliver KL et al. Genes4Epilepsy: An epilepsy gene resource. Epilepsia 64, 1368–1375, doi: 10.1111/epi.17547 (2023). - DOI - PMC - PubMed

Methods-only references

    1. Harris PA et al. Research electronic data capture (REDCap)--a metadata-driven methodology and workflow process for providing translational research informatics support. J Biomed Inform 42, 377–381, doi: 10.1016/j.jbi.2008.08.010 (2009). - DOI - PMC - PubMed
    1. EPGP Collaborative. The epilepsy phenome/genome project. Clin Trials 10, 568–586, doi: 10.1177/1740774513484392 (2013). - DOI - PMC - PubMed
    1. Van der Auwera GA et al. From FastQ data to high confidence variant calls: the Genome Analysis Toolkit best practices pipeline. Curr Protoc Bioinformatics 43, 11 10 11–11 10 33, doi: 10.1002/0471250953.bi1110s43 (2013). - DOI - PMC - PubMed
    1. McLaren W. et al. The Ensembl Variant Effect Predictor. Genome Biol 17, 122, doi: 10.1186/s13059-016-0974-4 (2016). - DOI - PMC - PubMed
    1. Karczewski KJ et al. The mutational constraint spectrum quantified from variation in 141,456 humans. Nature 581, 434–443, doi: 10.1038/s41586-020-2308-7 (2020). - DOI - PMC - PubMed