. 2024 Nov;25(11):4674-4692.
doi: 10.1038/s44319-024-00281-9. Epub 2024 Oct 3.

Bacterial RNA sensing by TLR8 requires RNase 6 processing and is inhibited by RNA 2'O-methylation

Affiliations

Bacterial RNA sensing by TLR8 requires RNase 6 processing and is inhibited by RNA 2'O-methylation

Ivanéia V Nunes et al. EMBO Rep. 2024 Nov.

Abstract

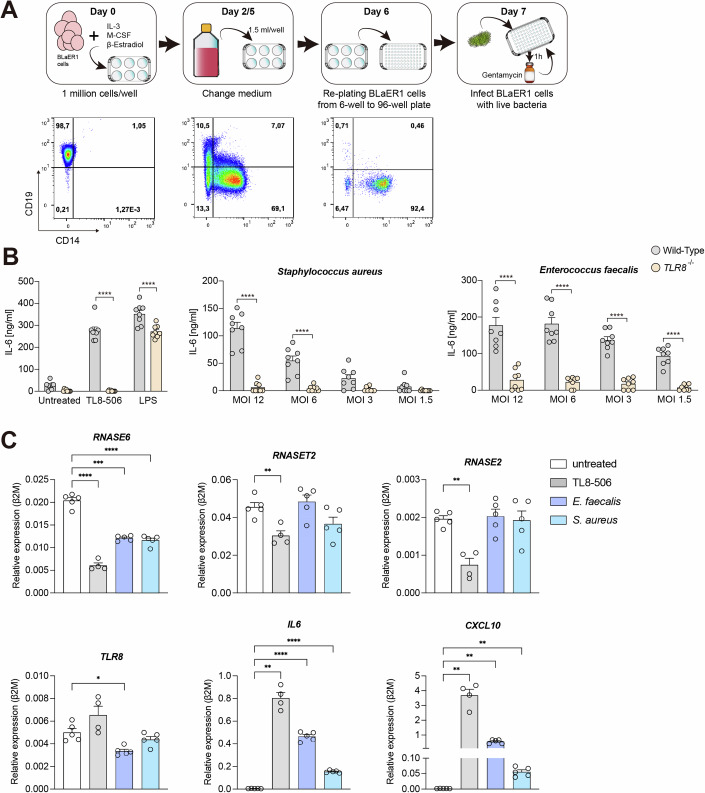
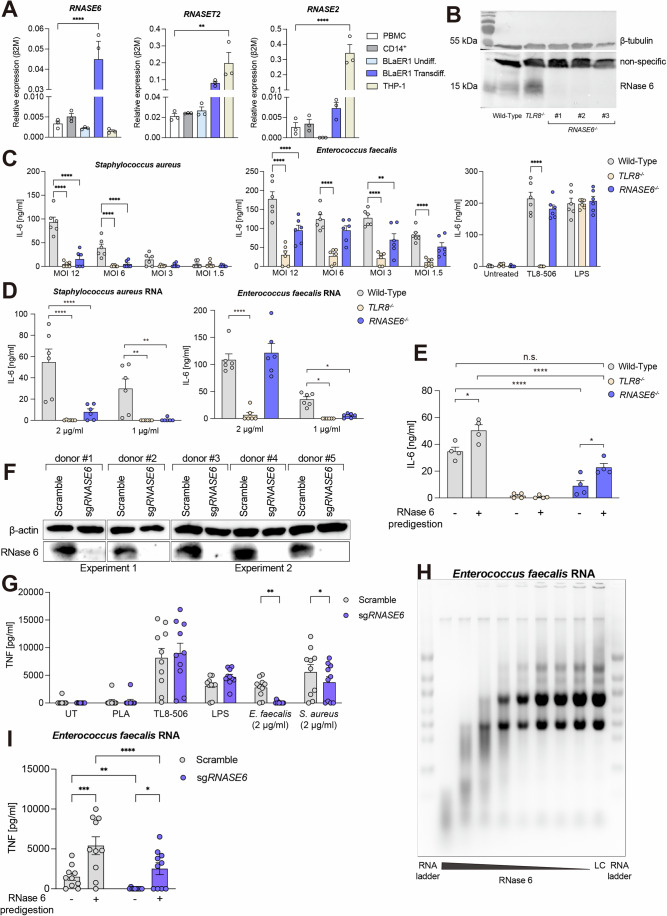
TLR8 senses single-stranded RNA (ssRNA) fragments, processed via cleavage by ribonuclease (RNase) T2 and RNase A family members. Processing by these RNases releases uridines and purine-terminated residues resulting in TLR8 activation. Monocytes show high expression of RNase 6, yet this RNase has not been analyzed for its physiological contribution to the recognition of bacterial RNA by TLR8. Here, we show a role for RNase 6 in TLR8 activation. BLaER1 cells, transdifferentiated into monocyte-like cells, as well as primary monocytes deficient for RNASE6 show a dampened TLR8-dependent response upon stimulation with isolated bacterial RNA (bRNA) and also upon infection with live bacteria. Pretreatment of bacterial RNA with recombinant RNase 6 generates fragments that induce TLR8 stimulation in RNase 6 knockout cells. 2'O-RNA methyl modification, when introduced at the first uridine in the UA dinucleotide, impairs processing by RNase 6 and dampens TLR8 stimulation. In summary, our data show that RNase 6 processes bacterial RNA and generates uridine-terminated breakdown products that activate TLR8.

Keywords: Innate Immunity; Nucleic Acid Recognition; RNA Modifications; RNase 6; Toll-Like Receptor 8.


Conflict of interest statement

The authors declare no competing interests.

Figures

Figure 1
Figure 1. RNASE6 is downregulated upon infection with TLR8-dependent bacteria.
(A) Overview of live whole bacterial infection experimental design. BLaER1 cells were stained for CD19 and CD14, and analyzed by flow cytometry at day 0, 2, and 6 post induction of transdifferentiation. On day 7, cells were infected with live bacteria. To stop the infection, gentamycin (50 µg/ml) was added to the wells; then, cells were incubated for an additional 2 or 20 h. (B) BLaER1 cells Wild-Type or deficient for TLR8 were transdifferentiated and infected at different MOIs. Cell-free supernatant was analyzed for the secretion of IL-6 after 20-h incubation (n = 4, each with technical duplicates). Data were shown as mean ± SEM and was analyzed by a two-way ANOVA test followed by Šídák’s multiple comparisons test. ****p < 0.0001. (C) BLaER1 cells were infected with MOI 20 of the respective strain or stimulated with TL8-506. Gentamycin was added to the wells, and after 2 h RNA was isolated to analyze mRNA expression. Data were normalized to β-2-microglobulin expression (β2M) (4–5 replicates). Data were shown as mean ± SEM and was analyzed by Brown–Forsythe and Welch ANOVA test followed by Dunnett’s post-test. Exact p values for individual sub-panels are reported here: RNASE6, ***p = 0.0002, ****p < 0.0001; RNASET2, **p = 0.096; RNASE2, **p = 0.087; TLR8, *p = 0.0137; IL6, **p = 0.0012, ****p < 0.0001; CXCL10, **p = 0.0067, 0.0016, or 0.0033, comparing TL8-506, E. faecalis, or S. aureus to untreated group, respectively. Source data are available online for this figure.
Figure 2
Figure 2. RNase 6 is required to generate TLR8 active RNA fragments from bacterial RNA.
(A) RNASE6, RNASET2, and RNASE2 mRNA expression were analyzed in untreated PMBC, isolated CD14+ monocytes, undifferentiated and transdifferentiated BLaER1, as well as THP-1 cells. Data were normalized to β-2-microglobulin (β2M) (n = 3 donors or three independent cell line passages). Data were shown as mean ± SEM and was analyzed by one-way ANOVA followed by Dunnett’s post-test. Exact p values are **p = 0.0047 and ****p < 0.0001. (B) Immunoblot for RNase 6 expression of wild-type or BLaER1 cells edited by CRISPR-Cas9. (C) BLaER1 cells were infected with whole live bacteria at different MOI. IL-6 was detected by ELISA upon live whole bacterial infection with S. aureus or E. faecalis at several MOIs. Controls include TL8-506 and LPS for stimulation (n = 3, each with technical duplicates). Data were shown as mean ± SEM and was analyzed by two-way ANOVA followed by Dunnett’s test. Exact p values are **p = 0.0016 and ****p < 0.0001. (D) BLaER1 cells were stimulated with isolated bRNA for 20 h and IL-6 was measured in the supernatant by ELISA (n = 3, each with technical duplicates). Data were shown as mean ± SEM and was analyzed with two-way ANOVA followed by Dunnett’s test. Exact p values for individual sub-panels are reported here: Staphylococcus aureus RNA, ****p < 0.0001, **p = 0.0046 and 0.0056; Enterococcus faecalis RNA, ****p < 0.0001, *p = 0.0156 and 0.0407, comparing TLR8−/ or RNASE6−/− to wild-type group at indicated concentration, respectively. (E) 10 µg of isolated E. faecalis was digested with 1 ng of recombinant RNase 6 (+). Breakdown fragments were transfected (1 µg/ml) into BLaER1 cells and IL-6 was measured after 20 h of incubation (n = 2, each with technical duplicates). Data is shown as mean ± SEM and was analyzed by two-way ANOVA followed by Tukey’s multicomparison test. Exact p values for comparing the effect of RNase 6 predigestion in Wild-Type or RNASE6−/− are *p = 0.0155 or *p = 0.0369, respectively; comparing genetically loss of RNASE6 are ****p < 0.0001 and not significant (n.s.) p = 0.0931. (F) Immunoblots for RNase 6 detection in lysates of primary human CD14+ monocytes from five different donors (5 µg of protein) after 6 days of cultivation post genomic edition by CRISPR-Cas9. (G) CD14+ monocytes edited by CRISPR-Cas9 shown in (F) were transfected with 2 µg/ml of undigested bRNA. TNF-α was measured after 20-hour incubation. (n = 2 in a total of 5 donors, each with technical duplicates). Data were shown as mean ± SEM and was analyzed by two-way ANOVA followed by Šídák’s multiple comparisons test. The exact p values are **p = 0.0045 or *p = 0.0174. (H) 10 µg of E. faecalis RNA was incubated with different amounts of recombinant RNase 6 (16 to 0.1 ng). Degradation products were run in 1X TAE 1.5% agarose gel to visualize the RNA fragmentation. Representative image out of two gels. (I) Fragments out of E. faecalis RNA digestion by RNase 6 (1 ng) were transfected into the cells at 1 µg/ml, and TNF-ɑ was measured after 20 h of incubation. Undigested E. faecalis RNA was also transfected into the cells at the same concentration as a control (n = 2 in a total of five donors, each with technical duplicates). Data were shown as mean ± SEM and was analyzed by two-way ANOVA followed by uncorrected Fisher’s LSD test. Exact p values are *p = 0.0176, **p = 0.0086, ***p = 0.0004, and ****p < 0.0001. pLArg poly-l-arginine, LPS lipopolysaccharide, sgRNASE6 single guide RNASE6. Source data are available online for this figure.
Figure 3
Figure 3. RNase 6 cleavage releases uridine-terminated RNA fragments.
(A) Scheme of enzymatic center of transferase-type RNases. The red arrow indicates the site of transphosphorylation. The scheme is based on Russo and colleagues (2011). (B) Table of chimeric ORNs (protected deoxynucleotide sequences with central RNA) used for ex cellulo digestion by RNase 6 and RNase T2. (C) Urea gel of (dAdC)3UUNN(dAdC)4 digested by recombinant human RNase 6 or (D) RNase T2 (5 to 0.05 ng/µl). An untreated sample was loaded as a Loading Control (LC). (E) Urea gel of (dAdC)3U(dAdC)4 digested by recombinant human RNase 6 or RNase T2 (5 to 0.05 ng/µl). An untreated sample (LC) was loaded as a control. (CE) Representative image out of two gels. N nucleotide, d deoxynucleotide, r ribonucleotide, A adenosine, G guanosine, U uridine, C cytosine). Source data are available online for this figure.
Figure 4
Figure 4. RNA 2’-O-methylation between Uridine and Adenosine impairs RNase 6 cleavage and TLR8 response.
(A) Table of un- and modified chimeric ORNs used for ex cellulo digestion by recombinant human RNase 6 (d deoxynucleotide, r ribonucleotide, A adenosine, G guanosine, U uridine, C cytosine, m 2’-O-methylation; >p, 2’3’-cyclophosphate termination). (B) Urea gel of (dAdC)3UUAA(dAdC)4 and modified variants digested by recombinant human RNase 6 (5 to 0.05 ng/µl). An untreated sample was loaded as a control (LC, loading control). Representative image out of two gels. (C) IL-6 measurements after stimulation with chimeric ORNs alone (4.8 µg/ml) or a combination of (dAdC)3UUAA(dAdC)4 or its modified variants and (dAdC)7UUG > p (4.8 µg/ml each), an RNase T2-predicted fragments (n = 2–3, each with technical duplicates). Data were shown as mean ± SEM and was analyzed with two-way ANOVA followed by Dunnett’s test. Exact p values are ****p ≤ 0.0001. Source data are available online for this figure.
Figure EV1
Figure EV1. RNASE6 is downregulated upon infection with TLR8-dependent bacteria.
(A) Isolated monocytes were pre-treated with CU-CPT9a for 1 h, thereafter, cells were infected with different MOI. After 1 h, gentamycin was added to the wells. TNF-α was measured from the supernatant collected upon 20 h of incubation (n = 2, each with technical duplicates). Data were shown as mean ± SEM and analyzed by two-way ANOVA followed by Šídák’s multiple comparisons test. Exact p values for individual sub-panels are reported here from left to right: Staphylococcus aureus, *p = 0.0343, **p = 0.0042, *p = 0.0314, and *p = 0.0309; Enterococcus faecalis, ****p < 0.0001; Controls, ***p = 0.0001. (B) Post-nuclear supernatant (PNS) of transdifferentiated BLaER1 cells was fractionated by ultracentrifugation on a sucrose gradient. From lowest to highest density, fractions 1–6 (F1–F6) were pooled from two gradients for in-gel digestion and analysis by HPLC-mass spectrometry to determine intensity-based absolute quantification (iBAQ) values. RNase 2 values were below the limit of detection. (C) The distribution of organelles over the density gradient as in (B) is shown exemplarily for mitochondria and endolysosomes. In detail, the iBAQ values of all identified proteins belonging to the gene ontology term GO:0036019 Endolysosome were used as average and normalized to the PNS. For mitochondria, the same was applied to all proteins associated with GO:0005753 mitochondrial proton-transporting ATP synthase complex. Source data are available online for this figure.
Figure EV2
Figure EV2. RNase 6 is required to generate TLR8 active RNA fragments from bacterial RNA.
(A) Immunoblot for RNase expression of the indicated cell types run with 25 µg of cell lysate. (B, C) Cellular proteomic analysis by HPLC-mass spectrometry to determine intensity-based absolute quantification (iBAQ) values comparing (B) BLaER1 and THP-1 cells or (C) Wild-type BLaER1 and RNASE6−/− cells from technical quadruplicates. The volcano plot was generated by R with the Welch t-test. The cutoff on the x-axis is for a twofold change and on the y-axis for a p value of 0.05. Measurements below the limit of detection are represented as not detected (n.d). (D) TNF-ɑ detection by ELISA upon live whole bacterial infection with S. aureus or E. faecalis at several MOIs (n = 3, each with technical duplicates). Data were shown as mean ± SEM and analyzed with two-way ANOVA followed by Dunnett’s test. Exact p values for individual sub-panels are reported here from left to right: Staphylococcus aureus, ****p < 0.0001 and ***p = 0.0006; Enterococcus faecalis, ****p < 0.0001 and ***p = 0.0002; Controls, ***p = 0.0001. (E) 1 µg of isolated bRNA was incubated with different concentrations of recombinant human RNase 6 (10 to 0.025 ng/µl) for 20 min and visualized by agarose gel. An untreated sample was loaded as a control (LC, loading control). Representative image out of two gels. (F) Controls of experiments are shown in panel 2D in main Fig. 2 (n = 6, each with technical duplicates). Data were shown as mean ± SEM and analyzed with two-way ANOVA followed by Dunnett’s test. The exact p value is ****p < 0.0001. (G) Controls of predigested bRNA stimulation experiments are shown in panel 2E in main Fig. 2 (n = 2, each with technical duplicates). Data were shown as mean ± SEM and analyzed with two-way ANOVA followed by Dunnett’s test. Exact p value are *p = 0.0117, **p = 0.0022, and ****p < 0.0001. (H) TNF-ɑ detection upon S. aureus RNA stimulation in CD14+ monocytes edited by CRISPR-Cas9 (n = 2 in a total of five donors, each with technical duplicates). Data were shown as mean ± SEM and was analyzed with two-way ANOVA followed by Šídák’s multiple comparisons test. The exact p values are **p = 0.0064 and ***p = 0.0005. pLArg poly-l-arginine, LPS lipopolysaccharide. Source data are available online for this figure.
Figure EV3
Figure EV3. RNase 6 cleavage releases uridine-terminated RNA fragments.
(A) Table of chimeric ORNs (protected deoxynucleotide sequences with central RNA) used for ex cellulo digestion by RNase 6 and RNase T2. (B) Urea gel of (dAdC)3GGNN(dAdC)4 digested by recombinant human RNase T2 or (C) RNase 6 (20 to 2.5 ng/µl). An untreated sample was loaded as a control (LC loading control). (B, C) Representative image out of two gels. N nucleotide, d deoxynucleotide, r ribonucleotide, A adenosine, G guanosine, U uridine, C cytosine). Source data are available online for this figure.

References

    1. Albanese M, Ruhle A, Mittermaier J, Mejías-Pérez E, Gapp M, Linder A, Schmacke NA, Hofmann K, Hennrich AA, Levy DN et al (2022) Rapid, efficient and activation-neutral gene editing of polyclonal primary human resting CD4+ T cells allows complex functional analyses. Nat Methods 19:81–89 - PMC - PubMed
    1. Becknell B, Eichler TE, Beceiro S, Li B, Easterling RS, Carpenter AR, James CL, McHugh KM, Hains DS, Partida-Sanchez S et al (2015) Ribonucleases 6 and 7 have antimicrobial function in the human and murine urinary tract. Kidney Int 87:151–161 - PMC - PubMed
    1. Bergstrøm B, Aune MH, Awuh JA, Kojen JF, Blix KJ, Ryan L, Flo TH, Mollnes TE, Espevik T, Stenvik J (2015) TLR8 senses Staphylococcus aureus RNA in human primary monocytes and macrophages and induces IFN-β production via a TAK1–IKKβ–IRF5 signaling pathway. J Immunol 195:1100–1111 - PubMed
    1. Boix E, Blanco JA, Nogués MV, Moussaoui M (2013) Nucleotide binding architecture for secreted cytotoxic endoribonucleases. Biochimie 95:1087–1097 - PubMed
    1. Campomenosi P, Salis S, Lindqvist C, Mariani D, Nordström T, Acquati F, Taramelli R (2006) Characterization of RNASET2, the first human member of the Rh/T2/S family of glycoproteins. Arch Biochem Biophys 449:17–26 - PubMed

LinkOut - more resources