Clinical Trial
. 2025 Jan;31(1):207-217.
doi: 10.1038/s41591-024-03274-2. Epub 2024 Oct 3.

Impact of doxycycline post-exposure prophylaxis for sexually transmitted infections on the gut microbiome and antimicrobial resistome

Affiliations
Clinical Trial

Impact of doxycycline post-exposure prophylaxis for sexually transmitted infections on the gut microbiome and antimicrobial resistome

Victoria T Chu et al. Nat Med. 2025 Jan.

Abstract

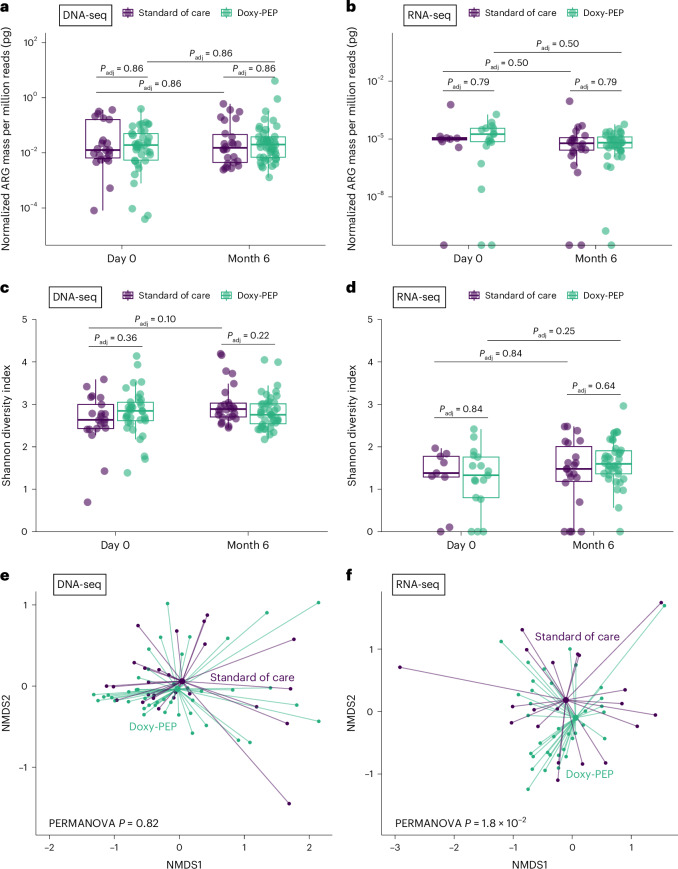
Doxycycline post-exposure prophylaxis (doxy-PEP) reduces bacterial sexually transmitted infections among men who have sex with men and transgender women. Although poised for widespread clinical implementation, the impact of doxy-PEP on antimicrobial resistance remains a primary concern as its effects on the gut microbiome and resistome, or the antimicrobial resistance genes (ARGs) present in the gut microbiome, are unknown. To investigate these effects, we studied participants from the DoxyPEP trial, a randomized clinical trial comparing doxy-PEP use, a one-time doxycycline 200-mg dose taken after condomless sex (DP arm, n = 100), to standard of care (SOC arm, n = 50) among men who have sex with men and transgender women. From self-collected rectal swabs at enrollment (day-0) and after 6 months (month-6), we performed metagenomic DNA sequencing (DNA-seq) or metatranscriptomic RNA sequencing (RNA-seq). DNA-seq data were analyzable from 127 samples derived from 89 participants, and RNA-seq data were analyzable from 86 samples derived from 70 participants. We compared the bacterial microbiome and resistome between the two study arms and over time. The median number of doxycycline doses taken since enrollment by participants with DNA-seq data was zero (interquartile range (IQR): 0-7 doses) for the SOC arm and 42 (IQR: 27-64 doses) for the DP arm. Tetracycline ARGs were detected in all day-0 DNA-seq samples and in 85% of day-0 RNA-seq samples. The proportional mass of tetracycline ARGs in the resistome increased between day-0 and month-6 in DP participants from 46% to 51% in the metagenome (P = 2.3 × 10⁻²) and from 4% to 15% in the metatranscriptome (P = 4.5 × 10⁻⁶), but no statistically significant increases in other ARG classes were observed. Exposure to a higher number of doxycycline doses correlated with proportional enrichment of tetracycline ARGs in the metagenome (Spearman's ρ = 0.23, P = 9.0 × 10⁻³) and metatranscriptome (Spearman's ρ = 0.55, P = 3.7 × 10⁻⁸). Bacterial microbiome alpha diversity, beta diversity and total bacterial mass did not differ between day-0 and month-6 samples from DP participants when assessed by either DNA-seq or RNA-seq. In an abundance-based correlation analysis, we observed an increase over time in the strength of the correlation between tetracycline ARGs and specific bacterial taxa, including some common human pathogens. In sum, doxy-PEP use over a 6-month period was associated with an increase in the proportion of tetracycline ARGs comprising the gut resistome and an increase in the expression of tetracycline ARGs. At 6 months of doxy-PEP use, no residual differences were observed in alpha and beta diversity or taxonomic composition of the gut microbiome. As doxy-PEP is implemented as a public health strategy, further studies and population-level surveillance of doxycycline-resistant pathogens are needed to understand the implications of these findings. ClinicalTrials.gov registration number: NCT03980223 .


Conflict of interest statement

Competing interests: Mayne Pharmaceuticals donated doxycycline hyclate to the study, and Cepheid and Hologic provided reagents and STI diagnostic assays. Several authors have served as scientific advisors: to Merck (C. Celum and D.D.), to Gilead Sciences (C. Celum), to GlaxoSmithKline (C. Celum) and to Vir Biotechnology (A.L.). The other authors have no conflict of interests to declare.

Figures

Fig. 1
Fig. 1. Flow diagram of the SOC and DP participant samples received, sequenced and used for analysis.
QC, quality control.
Fig. 2
Fig. 2. Impact of doxy-PEP use on the gut resistome for DNA-seq samples and RNA-seq samples.
ad, Normalized resistome mass (a,b) and resistome alpha diversity (Shannon diversity index) (c,d) for DP versus SOC participants (DNA-seq: n = 127; RNA-seq: n = 86). e,f, Resistome beta diversity (Bray–Curtis index) in DP versus SOC participants at 6 months (DNA-seq: n = 69; RNA-seq: n = 60). P values were calculated using the two-sided Wilcoxon rank-sum test and adjusted for multiple comparisons (ad). Two-sided PERMANOVA P values for beta diversity were calculated and adjusted for multiple comparisons (e,f). Box plot elements include a center line (median), box limits (upper and lower quartiles) and whiskers (1.5× IQR).
Fig. 3
Fig. 3. Impact of doxy-PEP use on tetracycline and non-tetracycline ARGs for DNA-seq samples and RNA-seq samples.
Tetracycline ARG richness (a,b) and tetracycline ARG proportion of resistome mass (c,d) were compared between SOC and DP arms at each visit and over time (DNA-seq: n = 127; RNA-seq: n = 86). e,f, The proportion of the resistome mass by ARG classes over time within the DP arm (DNA-seq: n = 80; RNA-seq: n = 55). P values were calculated using the two-sided Wilcoxon rank-sum test and adjusted for multiple comparisons. Box plot elements include a center line (median), box limits (upper and lower quartiles) and whiskers (1.5× IQR).
Fig. 4
Fig. 4. Impact of doxy-PEP use on tetracycline ARGs by number of doxycycline doses received for DNA-seq samples and RNA-seq samples.
A test of trend was used to compare tetracycline ARG richness (a,c) and proportion of tetracycline ARG mass to resistome mass by number of doxycycline doses received (b,d) (DNA-seq: n = 127; RNA-seq: n = 86). P values were calculated using the two-sided Wilcoxon rank-sum test and adjusted for multiple comparisons. The two-sided Spearman’s rank correlation test was used to calculate Spearman’s ρ and P value. Box plot elements include a center line (median), box limits (upper and lower quartiles) and whiskers (1.5× IQR).
Fig. 5
Fig. 5. Impact of doxy-PEP use on tetracycline ARGs in sets of paired DNA-seq samples and paired RNA-seq samples.
Tetracycline ARG richness (a,b) and the tetracycline ARG proportional mass within the resistome (c,d) were compared between SOC and DP arms by visit and over time (DNA-seq: n = 38 paired sample sets; RNA-seq: n = 16 paired sample sets). e, Heatmap of tetracycline ARGs detected by DNA-seq in paired samples (day-0 and month-6 samples) for the SOC and DP arms (n = 38 paired sample sets). P values were calculated using the two-sided Wilcoxon signed-rank test for paired samples and adjusted for multiple comparisons. Box plot elements include a center line (median), box limits (upper and lower quartiles) and whiskers (1.5× IQR). D0, day 0; M6, month 6.
Extended Data Fig. 1
Extended Data Fig. 1. Resistome characteristics at enrollment.
a) Heatmap of the antimicrobial resistance genes (ARGs) detected in DNA-seq samples (n = 58) and RNA-seq samples (n = 26) at enrollment by ARG class. Proportion of the resistome mass by ARG class on enrollment in (b) DNA-seq samples (n = 58) and (c) RNA-seq samples (n = 26). Boxplot elements include a center line (median), box limits (upper and lower quartiles), whiskers (1.5x interquartile range). Abbreviation: ARG, antimicrobial resistance gene; MLS, macrolide-lincosamide-streptogramin.
Extended Data Fig. 2
Extended Data Fig. 2. Heatmaps of tetracycline antimicrobial resistance genes (ARGs) detected by mechanism of action, visit (day-0 or month-6), and study arm (standard of care, SOC, or doxy-PEP) by (a) DNA-seq or (b) RNA-seq.
DNA-seq: n = 127 samples; RNA-seq: n = 86 samples.
Extended Data Fig. 3
Extended Data Fig. 3. Impact of Doxy-PEP use on abundance of tetracycline and non-tetracycline antimicrobial resistance genes (ARGs) for DNA-seq samples and RNA-seq samples.
ARG class abundance over time within the doxy-PEP arm for (a) DNA-seq samples (n = 80) and (b) RNA-seq samples (n = 55). P-values were calculated using the two-sided Wilcoxon rank-sum test and adjusted for multiple comparisons. Boxplot elements include a center line (median), box limits (upper and lower quartiles), whiskers (1.5x interquartile range). Significant p-values (<0.05) are bolded. Abbreviations: Padj, adjusted p-value.
Extended Data Fig. 4
Extended Data Fig. 4. Impact of Doxy-PEP use on tetracycline ARGs by number of doxycycline doses received for DNA-seq samples (a, b) and RNA-seq samples (c, d).
(a, c) Tetracycline ARG richness and (b, d) proportion of tetracycline ARG mass within the resistome by number of doxycycline doses received was plotted and fitted to a linear regression line for the outcome of tetracycline ARG richness and an inflated beta-regression line for the outcome of proportional tetracycline mass (DNA-seq: n = 127 samples, RNA-seq: n = 86 samples). The regression model is shown as a line, and the gray shaded areas surrounding the regression lines show the 95% confidence intervals. P-values from the regression models are obtained by two-sided Wald tests. Significant p-values (<0.05) are bolded. Significant p-values (<0.05) are bolded. Abbreviations: ARG, antimicrobial resistance gene; p.adj, adjusted p-value.
Extended Data Fig. 5
Extended Data Fig. 5. Bacterial taxonomic metrics for DNA-seq samples (a, c, e) and RNA-seq samples (b, d, f).
(a, b) Normalized bacterial microbiome mass and (c, d) alpha diversity (Shannon Diversity Index) for doxy-PEP versus standard of care (SOC) participants (DNA-seq: n = 127 samples, RNA-seq: n = 86 samples). (e, f) Bacterial microbiome beta diversity (Bray-Curtis Index) in doxy-PEP versus SOC participants at six months (DNA-seq: n = 69 samples, RNA-seq: n = 60 samples). For figures a-d, p-values for bacterial microbiome mass and alpha diversity were calculated using the two-sided Wilcoxon rank-sum test and adjusted for multiple comparisons; boxplot elements include a center line (median), box limits (upper and lower quartiles), whiskers (1.5x interquartile range). For figures e and f, p-values for beta diversity were calculated using the two-sided PERMANOVA test and adjusted for multiple comparisons. Significant p-values (<0.05) are bolded. Abbreviations: Padj, adjusted p-value; NMDS, non-metric multidimensional scaling.
Extended Data Fig. 6
Extended Data Fig. 6. Differential abundance comparison of specific pathogens of interest between time points in the in DNA-seq samples of the doxy-PEP arm (n = 80).
Bacterial abundance of several pathogens of interest (Chlamydia trachomatis, Neisseria gonorrhoeae, Mycoplasma genitalium, and Clostroidioides difficile) were compared between day-0 and month-6 samples in the doxy-PEP arm. P-values were calculated using the Wilcoxon rank-sum test and adjusted for multiple comparisons. Boxplot elements include a center line (median), box limits (upper and lower quartiles), whiskers (1.5x interquartile range). Abbreviation: NT RPM, nucleotide reads per million.
Extended Data Fig. 7
Extended Data Fig. 7. Correlation plots between the tetracycline antimicrobial resistance genes (ARGs) detected in the bacterial microbiome and the 50 most abundant bacterial genera detected in the doxy-PEP DNA-seq samples at (a) day-0 and (b) month-6.
Day-0: n = 58; month-6: n = 69. Color and size of the points represent the strength of correlation between the tetracycline ARG abundance and the bacterial genera abundance as calculated with the two-sided Spearman’s correlation test. Correlations with significant p-values, adjusted for multiple comparisons, are denoted with asterisks (p < 0.05*, p < 0.01**). Tetracycline ARGs with an empty row represented cases where there was not enough data to evaluate for correlation.
Extended Data Fig. 8
Extended Data Fig. 8. The change in Spearman’s correlation coefficient (SCC) from day-0 to month-6 between the tetracycline antimicrobial resistance genes (ARGs) detected in the bacterial microbiome and the 50 most abundant bacterial genera detected in the doxy-PEP DNA-seq samples.
Day-0: n = 58; month-6: n = 69. Color and size of the square filling represent the degree of change in the correlation coefficient. Blank squares represent cases where there was not a significant correlation between the tetracycline ARG and the bacterial taxa at month 6, or there was not enough data to evaluate for correlation.

Update of

References

    1. Molina, J.-M. et al. Post-exposure prophylaxis with doxycycline to prevent sexually transmitted infections in men who have sex with men: an open-label randomised substudy of the ANRS IPERGAY trial. Lancet Infect. Dis.18, 308–317 (2018). - PubMed
    1. Luetkemeyer, A. F. et al. Postexposure doxycycline to prevent bacterial sexually transmitted infections. N. Engl. J. Med.388, 1296–1306 (2023). - PMC - PubMed
    1. Bolan, R. K. et al. Doxycycline prophylaxis to reduce incident syphilis among HIV-infected men who have sex with men who continue to engage in high-risk sex: a randomized, controlled pilot study. Sex. Transm. Dis.42, 98–103 (2015). - PMC - PubMed
    1. Centers for Disease Control and Prevention. Guidelines for the Use of Doxycycline Post-Exposure Prophylaxis for Bacterial STI Prevention.https://www.cdc.gov/std/treatment/guidelines-for-doxycycline.htm#print (2023).
    1. World Health Organization. WHO announces the development of the Consolidated Guidelines on STI prevention and care (2022–2023). https://www.who.int/news/item/18-05-2023-who-announces-the-development-o... (2023).

Publication types

MeSH terms

Associated data