. 2024 Nov;9(11):2985-2996.
doi: 10.1038/s41564-024-01806-7. Epub 2024 Oct 3.

Host cell glycosylation selects for infection with CCR5- versus CXCR4-tropic HIV-1

Affiliations

Host cell glycosylation selects for infection with CCR5- versus CXCR4-tropic HIV-1

Hannah L Itell et al. Nat Microbiol. 2024 Nov.

Abstract

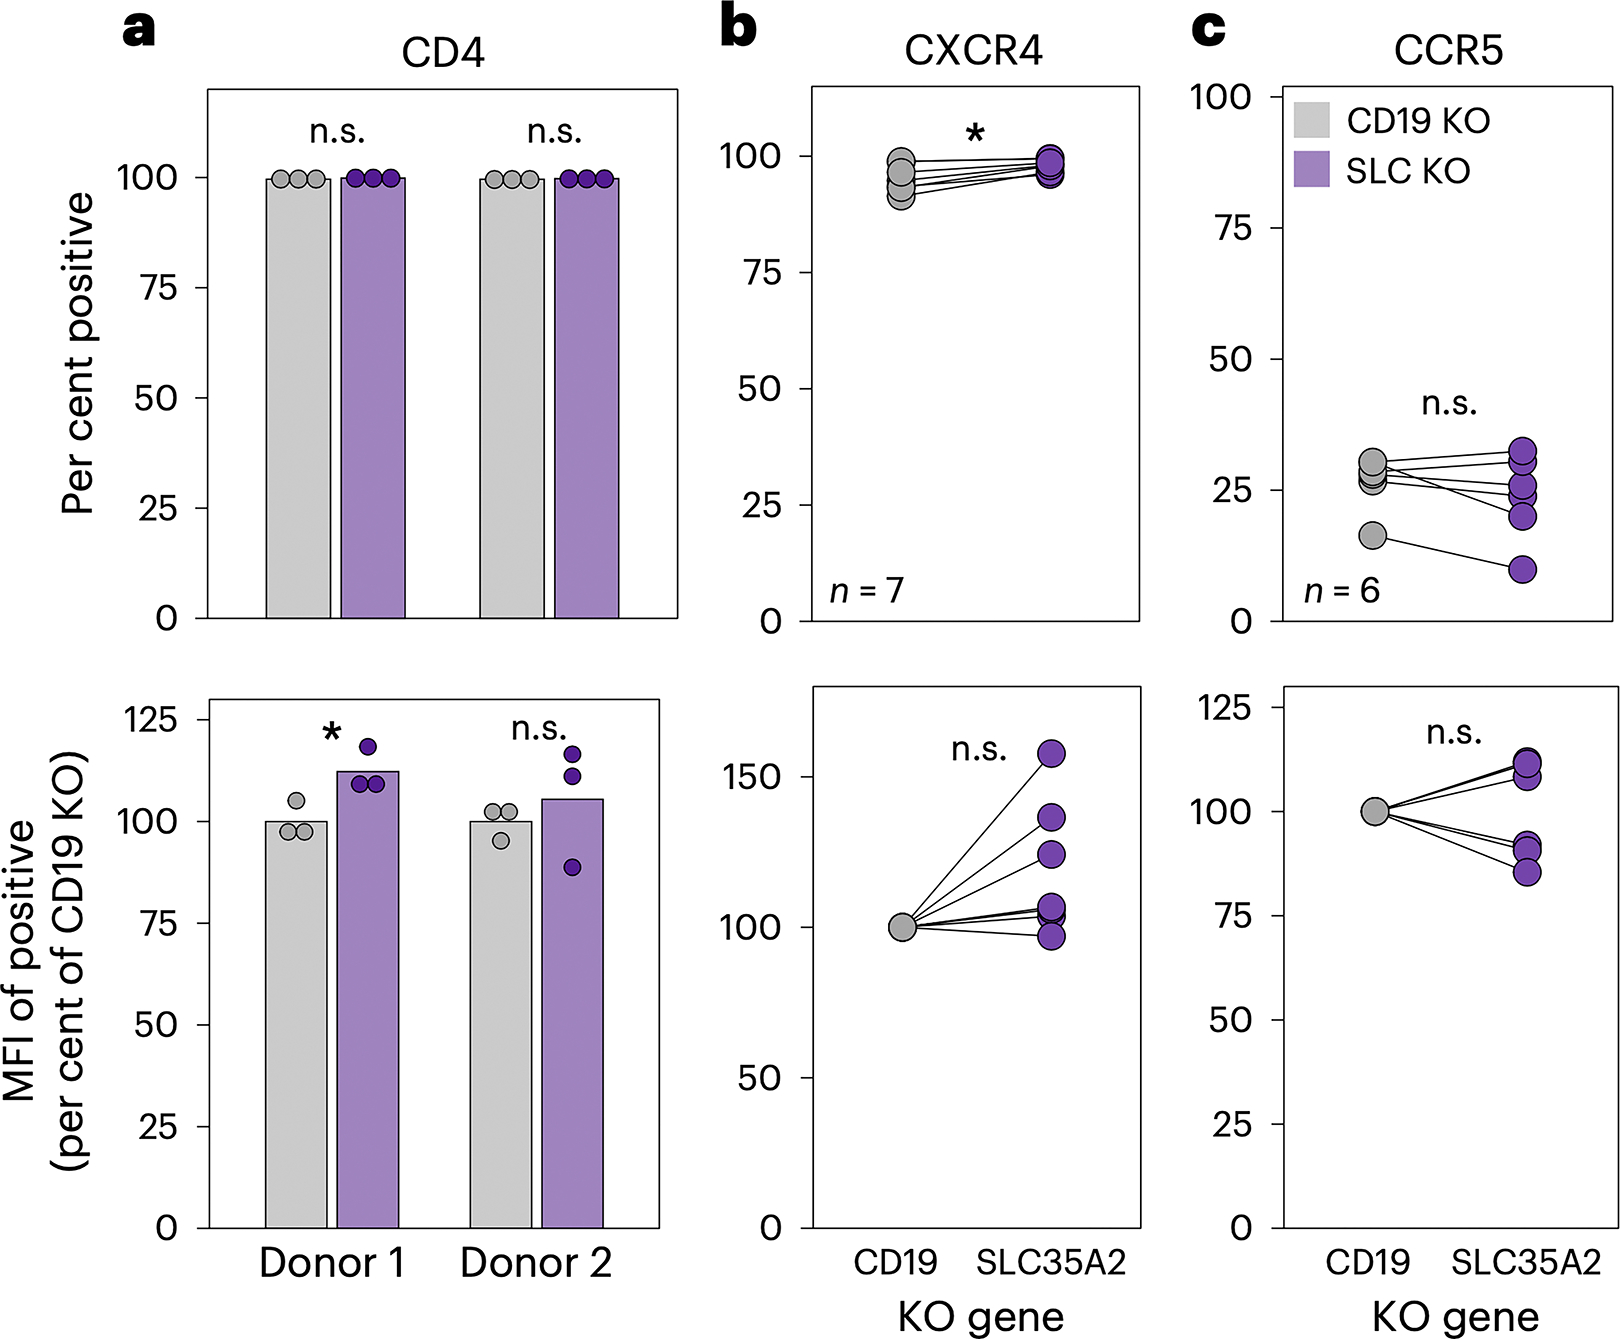
Human immunodeficiency virus type 1 (HIV-1) infection involves a selection bottleneck that leads to transmission of one or a few variants. C-C motif chemokine receptor 5 (CCR5) or C-X-C motif chemokine receptor 4 (CXCR4) can act as coreceptors for HIV-1 viral entry. However, initial infection mostly occurs via CCR5, despite abundant expression of CXCR4 on target cells. The host factors that influence HIV-1 susceptibility and selection during transmission are unclear. Here we conduct CRISPR-Cas9 screens and identify SLC35A2 (a transporter of UDP-galactose expressed in target cells in blood and mucosa) as a potent and specific CXCR4-tropic restriction factor in primary target CD4+ T cells. SLC35A2 inactivation, which resulted in truncated glycans, not only increased CXCR4-tropic infection levels but also decreased those of CCR5-tropic strains consistently. Single-cycle infections demonstrated that the effect is cell-intrinsic. These data support a role for a host protein that influences glycan structure in regulating HIV-1 infection. Host cell glycosylation may, therefore, affect HIV-1 selection during transmission in vivo.


Conflict of interest statement

COMPETING INTERESTS

The authors declare no competing interests.

Figures

Extended Data Fig. 1.
Extended Data Fig. 1.. SLC35A2 KO has opposite effects on two HIV-1 strains that utilize different coreceptors, related to Figures 2b, 2c, and 3e.
a. Independent experimental replicates for data depicted in Fig. 2b. Reverse transcriptase (RT) activity, relative (rel) to CD19 KO for each independent primary CD4+ T cell experiment, at 2 dpi (MOI=0.02). Knockouts were performed in five donors across independent knockout and infection experiments as indicated. b. Independent experimental replicates for data depicted in Fig. 2c. Percentage of CD4+ T cells staining positive for HIV-Gag at 3 dpi (MOI=1). Donor letters correspond with those in Panel A. c. Independent experimental replicates for data depicted in Fig. 3e. Percentage of GFP+ CD4+ T cells, relative to CD19 KO, after 2 days of infection with GFP-expressing HIV-1 pseudoviruses (MOI=1). Infection data from all panels are shown as the mean of 2–3 technical replicates, as indicated by individual data points.
Extended Data Fig. 2.
Extended Data Fig. 2.. SLC35A2 KO differentially impacts CXCR4-tropic and CCR5-tropic HIV-1, related to Figure 2e.
a. Percentage of CD4+ T cells staining positive for HIV-Gag, relative (rel) to CD19 KO, at 6 dpi (MOI=0.02, same infections as depicted in Fig. 2e, different measurement of HIV-1 infection). b. RT activity over time from spreading infections (MOI=0.02) in primary CD4+ T cells from two donors to determine coreceptor tropism. Results are separated by expected coreceptor tropism. Donor numbering is consistent within this figure and with Fig. 2e. Additional information on the strains used for infections is presented in Extended Data Table 1.
Extended Data Fig. 3.
Extended Data Fig. 3.. Expression of SLC35A2 and the HIV-1 coreceptors in CD4+ T cells from the blood and common HIV-1 transmission sites.
RNA expression levels for (a) SLC35A2, (b) CXCR4, and (c) CCR5 in CD4+ T cells isolated from different anatomical compartments from four donors. Shapes denote donors.
Fig. 1.
Fig. 1.. SLC35A2 is an X4-specific hit in a CRISPR-KO screen for HIV-1 restriction factors in primary CD4+ T cells.
a. A schematic of the HIV-CRISPR screening approach in primary CD4+ T cells. The lightning bolt represents nucleofection. After transduction and editing, cells are colored based on the unique single-guide RNA (sgRNA)-delivering lentivirus that they were transduced with. Solid bars represent sgRNA sequences, colored by sequence identity. This figure was created with BioRender.com. b. The correlation of positive MAGeCK scores between CD4+ T cell donors in Q23.BG505 (left) and LAI (right) screens. Two-sided pearson correlation results are included within each plot (P < 2.2 × 10⁻¹⁶ for both). The dotted lines denote the background for each screen based on non-targeting control (NTC) results (background = average NTC + 3 standard deviations). c. Left: Euler diagram comparing hits between Q23.BG505 and LAI screens. Screen hits are defined as gene targets that scored above background for both donors (top right quadrants from b). Right: top ten scoring LAI-specific hits, ordered by their average MAGeCK score in LAI screens. The dotted line reflects the average background from LAI screens. d. MAGeCK scores for SLC35A2 in each HIV-CRISPR screen. The dotted line indicates the average background for all screens. e. A heat map of the average IFN-induced fold changes in RNA expression for SLC35A2, housekeeping genes (GAPDH and ACTB) and canonical ISGs (MX2, ISG15, OAS1 and IFITM1) in primary CD4+ T cells at 6, 12 and 24 h post IFN treatment (n = 3 donors).
Fig. 2.
Fig. 2.. SLC35A2 KO differentially impacts X4 and CCR5-tropic HIV-1.
a. The percentage of SLC35A2 knockout based on evaluating genomic DNA editing by Synthego ICE. Editing experiments were performed in CD4+ T cells from five unique donors. A total of eight independent knockout experiments are depicted here, as cells were isolated from some donors multiple times for independent editing and infection experiments. The boxplot depicts the median (center line), first and third quartiles (hinges) and upper and lower limits (whiskers). All eight data points are shown. b. RT activity relative (rel) to CD19 KO at 2 dpi (MOI of 0.02) for the eight independent experiments depicted in a. Each point depicts the mean of two to three technical replicates. Two-tailed paired t-test (Q23.BG505, P < 0.0001; LAI, P = 0.0039); the asterisk indicates P < 0.05. c. Top: the percentage of CD4+ T cells staining positive for HIV-Gag at 3 dpi (MOI of 1) (n = 4 donors). Each point depicts the mean of two to three technical replicates. Two-tailed paired t-test (Q23.BG505, P = 0.0275; LAI, P = 0.0013); the asterisk indicates P < 0.05. Bottom: representative flow plots from one donor. SSC, side scatter. d. Percentage of CD4+ T cells staining positive for HIV-Gag at 3 dpi (MOI of 1), relative (rel) to CD19 KO (n = 3 unique donors, as indicated across x axis). The bars indicate the mean of two to three technical replicates, depicted by individual points. e. RT activity over time from spreading infections (MOI of 0.02) in primary CD4+ T cells from two donors, as indicated in vertical figure panels. The results are separated based on coreceptor tropism. Each point depicts the mean of two technical replicates. Additional information on the strains used for infections is presented in Extended Data Table 1.
Fig. 3.
Fig. 3.. SLC35A2 inactivation causes truncated glycans on host cells and impacts HIV-1 entry in a cell-intrinsic manner.
a. General schematic of glycans, including the truncations expected with SLC35A2 inactivation. GSL-II and VVL lectin terminal residue binding sites are indicated with arrows. The figure was created with BioRender.com. b. The percentage of cells staining positive for GSL-II and VVL lectins in CD4+ T cells (n = 4 donors). Each point depicts the mean of two to three technical replicates. c. The percentage of cells staining positive for GSL-II and VVL lectins in CD4+ T cells in SLC35A2-KO cells delivered exogenous SLC35A2 cDNA (SLC Rescue) (n = 2 donors, as indicated across the x-axis). The bars indicate the mean of three technical replicates, depicted by individual points. d. The relative (rel) viral infectivity, as a percentage of CD19 KO, of supernatants collected 6 days after low MOI infection (MOI of 0.02) from three donors. The relative infectivity was calculated by dividing the viral infectivity (infectious particles (IP) per microliter) by the RT activity (mU RT per microliter). Each point depicts the mean of three technical replicates. e. The percentage of GFP+ CD4+ T cells, relative (rel) to CD19 KO, 2 days after infection with GFP-expressing HIV-1 pseudoviruses (MOI of 1) (n = 4 donors). Each point depicts the mean of two to three technical replicates. Two-tailed paired t-test (Q23.BG505, P < 0.0001; LAI, P = 0.0489); the asterisk indicates P < 0.05. f. The percentage of GFP+ CD4+ T cells, relative (rel) to CD19 KO, after 2 days of infection with GFP-expressing HIV-1 or VSV-G pseudotyped virus (MOI of 1) (n = 3 donors). Infections with the different pseudoviruses were performed in parallel to allow for direct comparisons between viruses. Each point depicts the mean of three technical replicates. g. The fold change in the level of RT intermediate products 18 h after infection with replication-competent HIV-1 (MOI of 2), compared with CD19 KO. For CD19 and SLC35A2 KO, three donors were tested, indicated by individual points. A heat-inactivated (heat inact.) virus was used in parallel as a control for one donor. Each point depicts the mean of three technical replicates. h. The percentage of CD4+ T cells staining positive for HIV-Gag 3 days after infection (MOI of 1) with or without the use of spinoculation and polybrene, which were tested in parallel to allow for direct comparisons between infection conditions (n = 2 donors, as indicated in figure panels). The bars indicate the mean of three technical replicates, depicted by individual points.
Fig. 4.
Fig. 4.. SLC35A2 does not impact HIV-1 receptor or coreceptor expression.
a. Surface protein expression of CD4, CXCR4 and CCR5 on CD4+ T cells analyzed by flow cytometry. Top: the percentage of cells staining positive for each surface protein. Bottom: the MFI of the positive population, relative to CD19 KO. CD4 expression was evaluated in CD4+ T cells from two donors, as denoted on the x axis. The bars indicate the mean of three technical replicates, depicted by individual points. Two-tailed unpaired t-tests (donor 1, P = 0.041). b,c. CXCR4 (b) and CCR5 (c) levels were measured in four donors for a total of seven and six independent experiments, respectively, as cells were isolated from some donors multiple times for independent editing experiments. Each point depicts the mean of two or three technical replicates. Two-tailed paired t-tests were applied for b (top, P = 0.007) and the bottom of c. A two-tailed Wilcoxon rank test was used to evaluate the top of c. The asterisk indicates P < 0.05. n.s., not significant (P > 0.05).
Fig. 5.
Fig. 5.. Working model of the impact of CD4+ T cell glycosylation on HIV-1 infection.
Created with BioRender.com.

Update of

References

    1. Ronen K, Sharma A & Overbaugh J HIV transmission biology: translation for HIV prevention. AIDS 29, 2219–2227, doi: 10.1097/QAD.0000000000000845 (2015). - DOI - PMC - PubMed
    1. Wolinsky SM et al. Selective transmission of human immunodeficiency virus type-1 variants from mothers to infants. Science 255, 1134–1137, doi: 10.1126/science.1546316 (1992). - DOI - PubMed
    1. Wolfs TF, Zwart G, Bakker M & Goudsmit J HIV-1 genomic RNA diversification following sexual and parenteral virus transmission. Virology 189, 103–110, doi: 10.1016/0042-6822(92)90685-i (1992). - DOI - PubMed
    1. Zhu T et al. Genotypic and phenotypic characterization of HIV-1 patients with primary infection. Science 261, 1179–1181, doi: 10.1126/science.8356453 (1993). - DOI - PubMed
    1. Zhang LQ et al. Selection for specific sequences in the external envelope protein of human immunodeficiency virus type 1 upon primary infection. J Virol 67, 3345–3356, doi: 10.1128/JVI.67.6.3345-3356.1993 (1993). - DOI - PMC - PubMed