Review
. 2024 Oct 3;12(1):157.
doi: 10.1186/s40478-024-01868-y.

Hyperspectral retinal imaging in Alzheimer's disease and age-related macular degeneration: a review

Affiliations
Review

Hyperspectral retinal imaging in Alzheimer's disease and age-related macular degeneration: a review

Xiaoxi Du et al. Acta Neuropathol Commun. .

Abstract

While Alzheimer's disease and other neurodegenerative diseases have traditionally been viewed as brain disorders, there is growing evidence indicating their manifestation in the eyes as well. The retina, being a developmental extension of the brain, represents the only part of the central nervous system that can be noninvasively imaged at a high spatial resolution. The discovery of the specific pathological hallmarks of Alzheimer's disease in the retina of patients holds great promise for disease diagnosis and monitoring, particularly in the early stages where disease progression can potentially be slowed. Among various retinal imaging methods, hyperspectral imaging has garnered significant attention in this field. It offers a label-free approach to detect disease biomarkers, making it especially valuable for large-scale population screening efforts. In this review, we discuss recent advances in the field and outline the current bottlenecks and enabling technologies that could propel this field toward clinical translation.

Keywords: Age-related macular degeneration; Alzheimer’s disease; Hyperspectral imaging; Neurodegenerative disease; Retinal imaging.


Conflict of interest statement

Y.K. and M.K.-H. are co-founding members and consultants of NeuroVision Imaging, Inc. L.G. has a financial interest in Lift Photonics. However, neither company was involved in the research presented in this paper. Other authors declare no competing interests.

Figures

Fig. 1
Fig. 1
Schematic illustration of Alzheimer’s pathology across retinal cell layers in AD patients. CTRL, control. Illustration was adapted from Mirzaei et al., Frontiers in Neuroscience 2020 with permission [55]
Fig. 2
Fig. 2
Hyperspectral imaging data acquisition strategies. Hyperspectral imaging systems generate a 3D hyperspectral datacube (x, y, λ). The point-scanning method uses a linear detector to collect spectral information (λ) from a single point in space. The line-scanning method captures a spatial-spectral slice (y, λ) of the datacube using a 2D detector. In the wavelength-scanning method, a 2D image (x, y) is captured at a specific wavelength. The snapshot method captures the entire 3D datacube (x, y, λ) in a single camera exposure
Fig. 3
Fig. 3
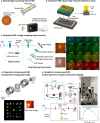
in vivo hyperspectral retinal imaging implementations for a Wavelength-scanning-based HSI. Retina is sequentially illuminated by monochromatic light with different wavelengths Desjardins et al. [70]. b Spectrally-resolved detector array. A thin-film Fabry–Perot cavity spectral filter is fabricated directly on each camera pixel. A total of 16 wavelength bands are achieved Li et al. [71]. c Image mapping spectrometry (IMS). (left panel) An image mapper consisting of multiple angled mirror facets slices and redirects the image to various regions of a detector. A prism array spectrally disperses the sliced images. (middle panel) IMS is combined with a fundus camera. (right panel) Snapshot hyperspectral imaging of human retina in vivo Gao et al. [72]. d Computed tomography imaging spectrometry (CTIS). A holographic grating diffracts the image in various directions Johnson et al. [73]. The hyperspectral datacube is reconstructed by using a tomographic image reconstruction algorithm. (right panel) Reconstructed hyperspectral images of macula with 75 spectral bands Fawzi et al. [74]. e Coded aperture snapshot spectral imaging (CASSI). (left panel) Optical system. The image is encoded with a random binary mask and dispersed by a prism Zhao et al. [75]. The image is reconstructed by solving the linear inverse problem associated with the image formation model. (right panel) Hyperspectral autofluorescence imaging of drusen in vivo. The spectrum is obtained by averaging the spectra over a drusen area (unpublished data). All panels are used with permission
Fig. 4
Fig. 4
Hyperspectral imaging of Aβ42 and pS396-Tau deposits on postmortem retinal cross-sections of AD patients guided by a-c peroxidase-based immunostaining (DAB) and d-g immunofluorescence staining. a, b From left to right, unstained hyperspectral intensity images, spectra at arrow-pointed locations (green, red, and black arrows), and DAB-labeled images. The purple arrow (b, right) indicates a neurofibrillary tangle (NFT) structure in the OPL. Scale bar, 50 µm. c Tile image of a large portion of retinal cross-section strip from a confirmed AD patient immunolabeled for pS396-Tau DAB substrate. d42 immunofluorescence channel (green pseudocolored). e pS396-Tau immunofluorescence channel (red pseudocolored). f Unstained hyperspectral intensity images. g Spectra at arrow-pointed locations (green, red, and black arrows). Scale bar, 50 µm. Source: Du et al. with permission [34]
Fig. 5
Fig. 5
Machine learning prediction of Aβ42 and pS396-Tau based on HSI. a42 fluorescence model. b pS396-Tau fluorescence model. c pS396-Tau DAB model, with a focus on a retinal NFT structure. d42 DAB model. From left to right: HSI intensity image, transformed HSI images, zoomed prediction images of specific feature, ground truth images, and zoomed ground truth images of specific feature. Scale bar, 50 µm for large FOV images, 10 µm for bordered inserts. Microscope images adapted from Du et al. with permission [34]
Fig. 6
Fig. 6
Hyperspectral Imaging of AMD Drusen The broad emission spectrum of RPE lipofuscin from a flatmount of RPE/BRM when excited by 436 nm light, captured by the Nuance camera, shows a peak around 570 nm, in the yellow range (left panel). The full-color autofluorescence (AF) of the sample with drusen, marked in RGB, highlights the predominantly yellow AF from the lipofuscin surrounding the nuclei in the RPE cells, while the AF from the soft drusen is greenish. After mathematical “unmixing” of the AF from the sample, three distinct spectra (S1, S2, S3) are found in the RPE, presented in green, blue, and red, with a new spectrum specific for drusen/drusen precursors (SDr) in azure, showing a short wavelength emission around 510 nm (right panel). The color-coded tissue localizations of the fluorophore sources of the spectra S1, S2, and SDr are shown (S3 not shown) (middle panel). Abbreviations: AF, autofluorescence; BRM, Bruch’s membrane; RGB, composite red–green–blue autofluorescence image; LF, lipofuscin; RPE, retinal pigment epithelium; SDr, spectrum for drusen. Source Orellana-Rios et al. with permission [92]

References

    1. Hickman RA, Faustin A, Wisniewski T (2016) Alzheimer disease and its growing epidemic: risk factors, biomarkers, and the urgent need for therapeutics. Neurol Clin 34:941–953 - PMC - PubMed
    1. Patterson C (2018) World alzheimer report 2018
    1. Klunk WE, Engler H, Nordberg A, Bacskai BJ, Wang Y, Price JC, Bergström M, Hyman BT, Långström B, Mathis CA (2003) Imaging the pathology of Alzheimer’s disease: amyloid-imaging with positron emission tomography. Neuroimaging Clin 13:781–789 - PubMed
    1. Blennow K, Dubois B, Fagan AM, Lewczuk P, De Leon MJ, Hampel H (2015) Clinical utility of cerebrospinal fluid biomarkers in the diagnosis of early Alzheimer’s disease. Alzheimer’s Dement 11:58–69 - PMC - PubMed
    1. Jia J, Ning Y, Chen M, Wang S, Yang H, Li F, Ding J, Li Y, Zhao B, Lyu J, Yang S, Yan X, Wang Y, Qin W, Wang Q, Li Y, Zhang J, Liang F, Liao Z, Wang S (2024) Biomarker changes during 20 years preceding Alzheimer’s disease. N Engl J Med 390:712–722. 10.1056/NEJMOA2310168/SUPPL_FILE/NEJMOA2310168_DISCLOSURES.PDF - PubMed

Publication types

MeSH terms