. 2024 Oct 3;20(1):447.
doi: 10.1186/s12917-024-04014-x.

Impact of a teat disinfectant based on Lactococcus cremoris on the cow milk proteome

Affiliations

Impact of a teat disinfectant based on Lactococcus cremoris on the cow milk proteome

Maria Filippa Addis et al. BMC Vet Res. .

Abstract

Background: Dairy cow milking practices require cleaning and disinfection of the teat skin before and after milking to ensure the safety and quality of milk and prevent intramammary infections. Antimicrobial proteins of natural origin can be valuable alternatives to traditional disinfectants. In a recent field trial, we demonstrated that a teat dip based on a nisin A-producing Lactococcus cremoris (L) had comparable efficacy to conventional iodophor dip (C) in preventing dairy cow mastitis. Here, we present the differential shotgun proteomics investigation of the milk collected during the trial.

Methods: Four groups of quarter milk samples with low (LSCC) and high somatic cell count (HSCC) collected at the beginning (T0) and end (TF) of the trial were analyzed for a total of 28 LSCC (14 LSCC T0 and 14 LSCC TF) and 12 HSCC (6 HSCC T0 and 6 HSCC TF) samples. Milk proteins were digested into peptides, separated by nanoHPLC, and analyzed by tandem mass spectrometry (LC-MS/MS) on an Orbitrap Fusion Tribrid mass spectrometer. The proteins were identified with MaxQuant and interaction networks of the differential proteins were investigated with STRING. The proteomics data have been deposited to the ProteomeXchange Consortium via the PRIDE partner repository with the dataset identifier PXD045030.

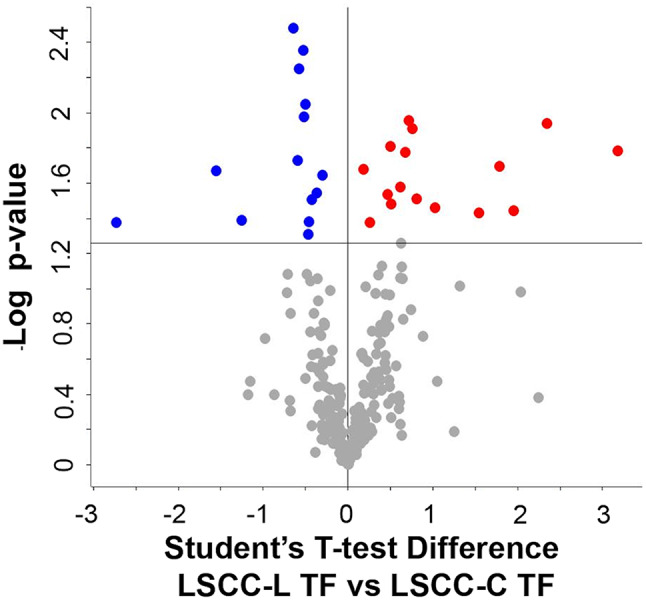
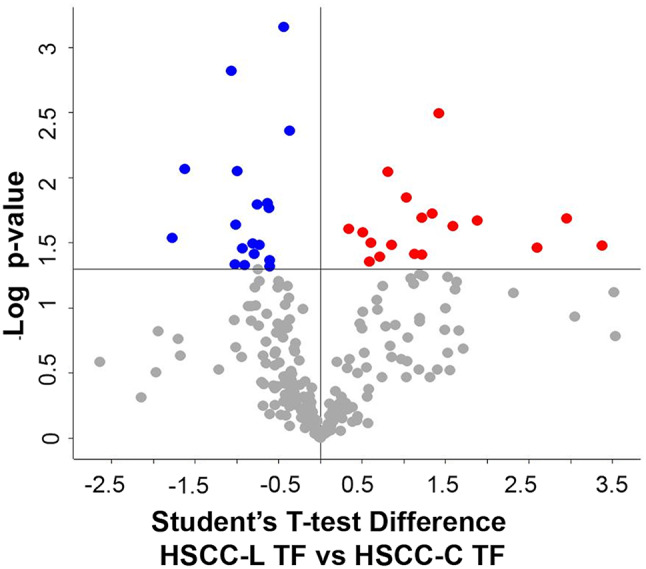
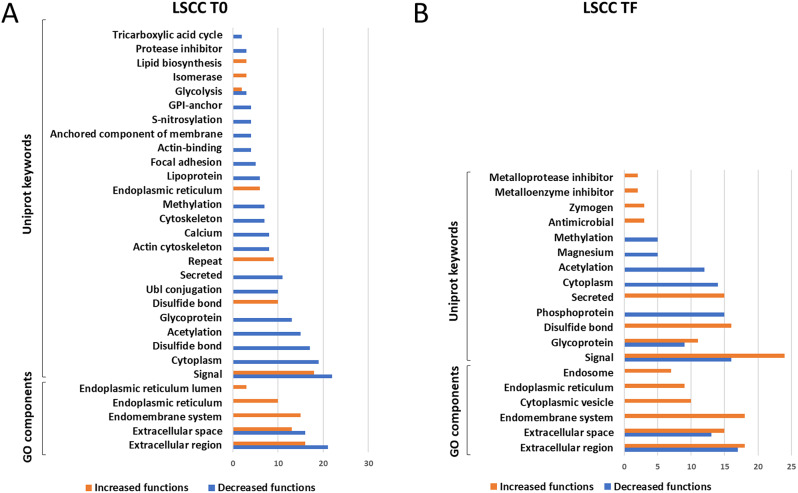
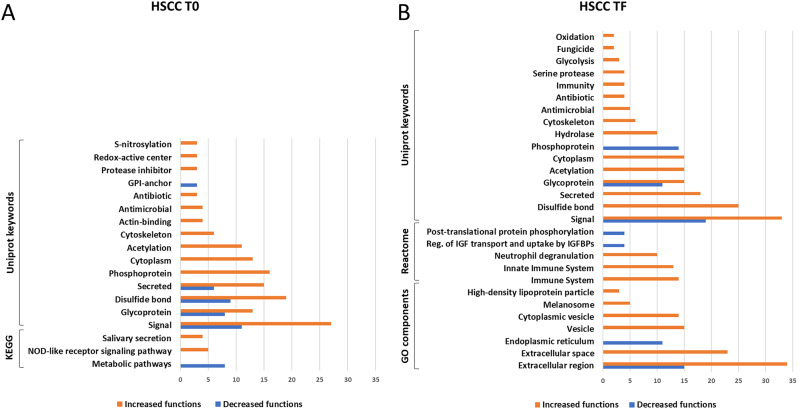
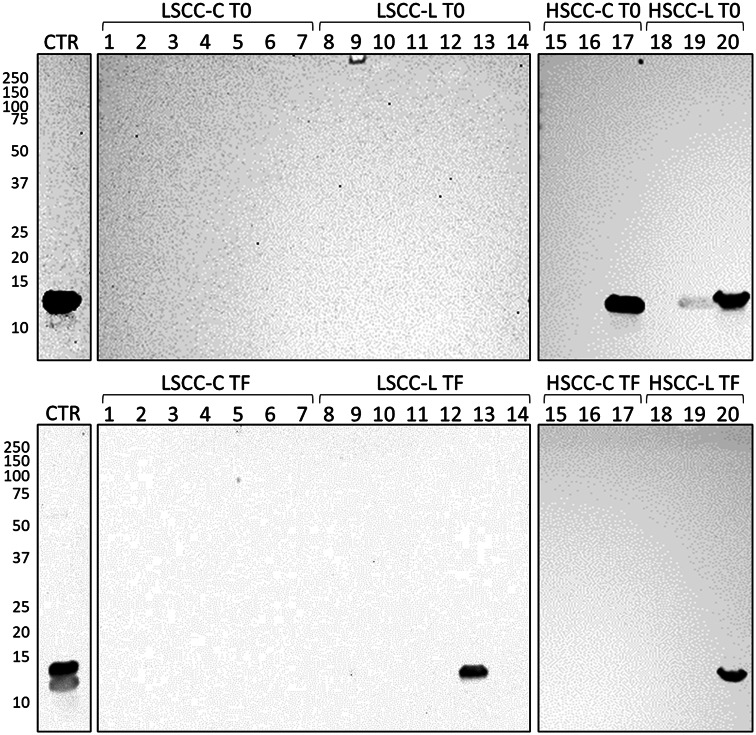
Results: In healthy milk (LSCC), we detected 90 and 80 differential proteins at T0 and TF, respectively. At TF, the Lactococcus group showed higher levels of antimicrobial proteins. In mastitis milk (HSCC), we detected 88 and 106 differential proteins at T0 and TF, respectively. In the Lactococcus group, 14 proteins with antimicrobial and immune defense functions were enriched at TF vs. 4 proteins at T0. Cathelicidins were among the most relevant enriched proteins. Western immunoblotting validation confirmed the differential abundance.

Conclusions: At T0, the proteomic differences observed in healthy milk of the two groups were most likely dependent on physiological variation. On the other hand, antimicrobial and immune defense functions were higher in the milk of cows with mammary gland inflammation of the Lactococcus-treated group. Among other factors, the immunostimulatory action of nisin A might be considered as a contributor.

Keywords: Antimicrobial; Cathelicidin; Immunostimulation; Milk proteomics; Milking routine; Shotgun proteomics; Teat dipping.


Conflict of interest statement

The authors declare no competing interests.

Figures

Fig. 1
Fig. 1
Differential proteins observed in low-SCC milk at the beginning of the trial. The volcano plot illustrates the differential proteins determined using the Student’s T-test (p-value ≤ 0.05). Each protein is represented as a dot and is mapped according to its fold change on the ordinate axis (Y), with the p-value by the T-test on the abscissa (X). The red and blue dots indicate proteins that were higher or lower in L versus C, respectively. Grey dots do not meet the FDR criteria
Fig. 2
Fig. 2
Differential proteins observed in low-SCC milk at the end of the trial. The volcano plot illustrates the differential proteins determined using the Student’s T-test (p-value ≤ 0.05). Each protein is represented as a dot and is mapped according to its fold change on the ordinate axis (Y), with the p-value by the T-test on the abscissa (X). The red and blue dots indicate proteins that were higher or lower in L versus C, respectively. Grey dots do not meet the FDR criteria
Fig. 3
Fig. 3
Differential proteins observed in high-SCC milk at the beginning of the trial. The volcano plot illustrates the differential proteins determined using the Student’s T-test (p-value ≤ 0.05). Each protein is represented as a dot and is mapped according to its fold change on the ordinate axis (Y), with the p-value by the T-test on the abscissa (X). The red and blue dots indicate proteins that were higher or lower in L versus C, respectively. Grey dots do not meet the FDR criteria
Fig. 4
Fig. 4
Differential proteins observed in high-SCC milk at the end of the trial. The volcano plot illustrates the differential proteins determined using the Student’s T-test (p-value ≤ 0.05). Each protein is represented as a dot and is mapped according to its fold change on the ordinate axis (Y), with the p-value by the T-test on the abscissa (X). The red and blue dots indicate proteins that were higher or lower in L versus C, respectively. Grey dots do not meet the FDR criteria
Fig. 5
Fig. 5
Significant shared categories in low somatic cell count milk. The graph illustrates the proteins increased (orange) or decreased (blue) in the Lactococcus disinfectant group compared to the conventional iodophor group at the beginning (a, LSCC T0) and at the end (b, LSCC TF) of the trial. The bars indicate the number of significantly enriched terms in the respective categories for each disinfectant group. Detailed GO terms, protein IDs, and statistical information can be found in the Supplementary Dataset
Fig. 6
Fig. 6
Significant shared categories in high somatic cell count milk. The graph illustrates the proteins increased (orange) or decreased (blue) in the Lactococcus disinfectant group compared to the conventional iodophor group at the beginning (A, HSCC T0) and at the end (B, HSCC TF) of the trial. The bars indicate the number of significantly enriched terms in the respective categories for each disinfectant group. Detailed GO terms, protein IDs, and statistical information can be found in the Supplementary Dataset
Fig. 7
Fig. 7
Western immunoblotting of all milk samples with anti-cathelicidin antibodies. CTR, positive control. Molecular weight markers in kDa are indicated on the left. Top images: samples at the beginning of the study (T0); bottom images, samples at the end of the study (TF). LSCC-C, low somatic cell count, conventional iodophor disinfectant group. LSCC-L, low somatic cell count, Lactococcus disinfectant group. HSCC-C, high somatic cell count, conventional iodophor disinfectant group. HSCC-L, high somatic cell count, Lactococcus disinfectant group. The numbers indicate the lanes in the SDS-PAGE gels; each number corresponds to a different sample. The original Western Immunoblotting images are reported in Supplementary File 2

References

    1. Gleeson D, Flynn J, Brien BO. Effect of pre-milking teat disinfection on new mastitis infection rates of dairy cows. Ir Vet J. 2018;71:11. - PMC - PubMed
    1. Ózsvári L, Ivanyos D. The use of teat disinfectants and milking machine cleaning products in commercial holstein-friesian farms. Front Vet Sci. 2022;9. - PMC - PubMed
    1. van Dijk HFG, Verbrugh HA. Resisting disinfectants. Commun Med. 2022;2:1–5. - PMC - PubMed
    1. Murray CJL, Ikuta KS, Sharara F, Swetschinski L, Aguilar GR, Gray A, et al. Global burden of bacterial antimicrobial resistance in 2019: a systematic analysis. Lancet. 2022;399:629–55. - PMC - PubMed
    1. Dore S, Ferrini AM, Appicciafuoco B, Massaro MR, Sotgiu G, Liciardi M, et al. Efficacy of a terpinen-4-ol based dipping for post-milking teat disinfection in the prevention of mastitis in dairy sheep. J Essent Oil Res. 2019;31:19–26.

LinkOut - more resources