. 2024 Oct 3:28:0081.
doi: 10.34133/bmr.0081. eCollection 2024.

Pericytes Enrich the Basement Membrane and Reduce Neutrophil Transmigration in an In Vitro Model of Peripheral Inflammation at the Blood-Brain Barrier

Affiliations

Pericytes Enrich the Basement Membrane and Reduce Neutrophil Transmigration in an In Vitro Model of Peripheral Inflammation at the Blood-Brain Barrier

Molly C McCloskey et al. Biomater Res. .

Abstract

Sepsis is the most lethal and expensive condition treated in intensive care units. Sepsis survivors frequently suffer long-term cognitive impairment, which has been linked to the breakdown of the blood-brain barrier (BBB) during a sepsis-associated "cytokine storm". Because animal models poorly recapitulate sepsis pathophysiology, human models are needed to understand sepsis-associated brain injury and to develop novel therapeutic strategies. With the concurrent emergence of tissue chip technologies and the maturation of protocols for human induced pluripotent stem cell (hiPSC), we can now develop advanced in vitro models of the human BBB and immune system to understand the relationship between systemic inflammation and brain injury. Here, we present a BBB model of the primary barrier developed on the μSiM (microphysiological system enabled by an ultrathin silicon nanomembrane) tissue chip platform. The model features isogenically matched hiPSC-derived extended endothelial culture method brain microvascular endothelial cell-like cells (EECM-BMEC-like cells) and brain pericyte-like cells (BPLCs) in a back-to-back coculture separated by the ultrathin (100 nm) membrane. Both endothelial monocultures and cocultures with pericytes responded to sepsis-like stimuli, with increased small-molecule permeability, although no differences were detected between culture conditions. Conversely, BPLC coculture reduced the number of neutrophils that crossed the EECM-BMEC-like cell monolayer under sepsis-like stimulation. Interestingly, this barrier protection was not seen when the stimulus originated from the tissue side. Our studies are consistent with the reported role for pericytes in regulating leukocyte trafficking during sepsis but indicate that EECM-BMEC-like cells alone are sufficient to maintain the restrictive small-molecule permeability of the BBB.


Conflict of interest statement

Competing interests: J.L.M. and T.R.G. are cofounders of SiMPore and hold equity interests in the company. SiMPore is commercializing ultrathin silicon-based technologies including the membranes used in this study. B.D.G., E.V.S., S.P.P., and B.E. are inventors on patent application PCT/US2021/052421 related to EECM-BMEC-like cells. S.P.P. and E.V.S. are inventors on patent US11643636B2 related to BPLCs.

Figures

Fig. 1.
Fig. 1.
Characterization of EECM-BMEC-like cell monoculture responses to sepsis-like stimuli. EECM-BMEC-like cells were cultured in μSiMs for 6 d and either not stimulated (Non-Stim) or treated for 16 to 20 h with cytomix (equimolar TNF-α + IFN-𝛾 + IL-1β at 10 or 25 pg/ml each cytokine). (A) EECM-BMEC-like cell permeability was measured and plotted as mean ± SD. Orange data points indicate devices with small gap(s) (approximately the size of a single cell), and red data points indicate devices with large gap(s) (larger than the size of a single cell). N = 11 per group. Brown–Forsythe and Welch ANOVA tests were used. (B) Phase images of EECM-BMEC-like cells acquired prior to performing the permeability assay. Circled are small gaps (orange) and large gaps (red). Scale bar = 100 μm. (C) Endothelial permeability was categorized into “Tight” (PeLY ≤ 0.6 × 10⁻³ cm/min), “Leaky” (0.6 × 10⁻³ cm/min < PeLY ≤ 1.5 × 10⁻³ cm/min) and “Disrupted” (PeLY > 1.5 × 10⁻³ cm/min), and a contingency plot was made to highlight the differences in barrier categories between treatment groups. (D) Cells were stained for ICAM-1 (representative images, right), and mean fluorescence intensity over the membrane window was measured and normalized to nonstimulated devices from the respective experiment (plot, left). Scale bar = 100 μm. N = 11 to 13 per group. Brown–Forsythe and Welch ANOVA tests were used. Statistics: * = P ≤ 0.05, ** = P ≤ 0.01, *** = P ≤ 0.001, **** = P ≤ 0.0001, ns = not significant.
Fig. 2.
Fig. 2.
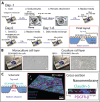
Establishment of μSiM coculture model, the μSiM-BPB. (A) Schematic of cell seeding protocol for EECM-BMEC-like cell and BPLC coculture in μSiMs. Red inset = side view of the final cell layout across the membrane region of the nanoporous chip. The blue region is the nontransparent silicon support, and the brown dash represents the nanoporous membrane (not drawn to scale). (B) Phase images of EECM-BMEC-like cell monolayers and coculture with BPLCs. Scale bar = 100 μm. (C) EECM-BMEC-like cells were cocultured with BPLCs and stained for brain endothelial cell tight junction marker Claudin-5 (teal), pericyte marker PDGFRβ (magenta), and nuclear stain Hoechst (blue). Confocal microscopy was used to acquire images across the nanoporous membrane region of the chip (red box). The 3D view (scale bar = 50 μm) and Cross-section (width = 70.7 μm) images demonstrate the close proximity of the 2 cell types, with the nanomembrane too thin to resolve in the stacks. Further, the Cross-section image shows the brain endothelial cell marker is restricted to the upper compartment and the pericyte marker is restricted to the bottom compartment.
Fig. 3.
Fig. 3.
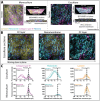
Evaluation of basement membrane deposition in the μSiM-BPB. EECM-BMEC-like cells (Monoculture) and EECM-BMEC-like cells and BPLCs (Coculture) were grown in μSiMs and stained for BM components collagen type IV (magenta), fibronectin (teal), and laminin (yellow), along with nuclear stain Hoechst (blue). Confocal microscopy was used to acquire images across the nanoporous membrane region. (A) Representative monoculture and coculture x-y “Section” (scale bar = 20 μm), “3D views” (scale bar = 30 μm), and “x-z” slices of confocal images. The 3D views show the entire confocal stack, focused below the nanomembrane, with the “Bottom side” indicating the pericyte layer and the “Top side” indicating the endothelial cell layer. The x-z slices are zoomed to show the location of the basement membrane components relative to each cell type. The approximate location of the nanomembrane is indicated. Endothelial cells sit above the BM deposited on the nanomembrane. Pericytes embed themselves within the BM. (B) Representative “Coculture sections” images moving down the z-axis. The leftmost image is focused along the z-axis within the top chamber (EC layer), the middle image is focused at the nanomembrane, and the rightmost image is focused within the bottom chamber (PC layer). Scale bar = 20 μm. (C) Mean fluorescence intensity across the z-axis was measured and plotted for each BM protein in coculture and endothelial cell monoculture, along with coated control devices (black). N = 2 to 3 devices for monoculture and coculture, and 1 to 2 devices for coated controls, with 1 to 3 images acquired per device.
Fig. 4.
Fig. 4.
Evaluation of μSiM-BPB small-molecule permeability responses to sepsis-like stimuli. Endothelial permeability to LY was measured across EECM-BMEC-like cells without BPLCs (−BPLC) or cocultured with BPLCs (+BPLC) that were either not stimulated (Non-Stim, black) or treated for 16 to 20 h with cytomix at 10 pg/ml (pink) or 25 pg/ml (teal). Plotted are mean ± SD, N = 8 to 12 per group. A 2-way ANOVA was used with Tukey post hoc. Statistics: P ≤ 0.05 was considered significant, ns = not significant.
Fig. 5.
Fig. 5.
Apical cytomix stimulation of EECM-BMEC-like cell monolayers results in greater PMN transmigration. EECM-BMEC-like cells were cultured in μSiM-MVM devices for 6 d and exposed to cytomix (1 or 10 pg/ml) for 20 h prior to PMN introduction. Cytomix stimulation was performed in a sided manner to mimic sepsis-like or tissue-sided inflammation. (A) PMNs deposited upon apically stimulated endothelium engaged in significantly more transmigration compared to basally stimulated endothelium at both dosages. Notably, apically sided cytomix stimulation at 10 pg/ml facilitated a greater PMN transmigratory response than an fMLP gradient (~58% versus ~24% respectively). (B) Phase-contrast images (scale bar = 50 μm) of experimental conditions at t = 0 min and t = 30 min demonstrate robust differences in PMN response to cytomix. Large portions of the PMN population present in the apical cytomix (10 pg/ml) condition are transmigrated by 30 min, whereas PMNs in both basal and fMLP experiments appear to be primarily located on the luminal EECM-BMEC-like cell surface. Magenta arrows highlight transmigrated PMN examples. (C) Using an fMLP gradient or stimulating EECM-BMEC-like cells, regardless of dosage amount or direction, increases PMN crawling speed from a baseline of ~9 to ~15 μm/min. Persistence is found to be similar at low (1 pg/ml) cytomix levels regardless of stimulation direction, albeit with high variability between experimental replicates. Upon increasing cytomix to 10 pg/ml, PMNs crawling on apically stimulated endothelium remain significantly less persistent (~17 s) than those crawling on basally stimulated endothelium (~36 s). (D) Spider plots (scale bar = 50 μm) showing PMN trajectories with a universal origin help visualize motility differences across all experiments, where PMN activity depends on the direction and dosage of cytomix stimulation. All results are plotted as mean ± SD and analyzed with a 1-way ANOVA. Statistics: * = P ≤ 0.05, ** = P ≤ 0.01, ns = not significant.
Fig. 6.
Fig. 6.
Establishment of the μSiM-BPB on 3-μm DS nanomembranes. (A) Scanning electron microscopy image of a membrane chip with a 3-μm DS nanomembrane (scale bar = 1 μm) and overlaid transmission electron microscopy images highlighting the structure of the nanoporous region (scale bar = 50 nm) and edge of the micropore (scale bar = 100 nm). Transmission electron microscopy image adapted from Salminen et al. [38] with permission; copyright WILEY. EECM-BMEC-like cells were cultured on the DS membrane and a phase image was acquired. The green dashed line is the outline of a single cell, and the red circles highlight micropores located underneath said cell. Scale bar = 100 μm. (B) EECM-BMEC-like cells were cocultured with BPLCs on nanoporous (NPN) or DS membranes and either not stimulated (Non-Stim, black) or treated for 16 to 20 h with cytomix at 10 pg/ml (pink) or 25 pg/ml (teal), and system permeability was measured. Plotted are mean ± SD, N = 7 to 10 per group. A 2-way ANOVA was used with Tukey post hoc comparing column means. Statistics: * = P ≤ 0.05, ** = P ≤ 0.01, *** = P ≤ 0.001, ns = not significant.
Fig. 7.
Fig. 7.
EECM-BMEC-like cell with BPLC coculture dampens PMN migration activity on apically stimulated devices. (A) The incorporation of DS membranes required retooling of the analytical protocol used for assessing PMN transmigratory behavior. Namely, manual analysis was used instead of computer vision protocols to account for the presence of both microscale pores and pericytes. To make coculture transmigration analysis comparable to monoculture transmigration studies, PMNs were considered “transmigrated” if they were spatially located below the EECM-BMEC-like cell layer (red and blue bounding boxes) and not luminally located (green bounding box). (B) The presence of DS micropores enables full PMN extravasation into the tissue compartment of μSiM devices. To ensure analytical compatibility with monoculture studies, where micropores were not present, population counts present in a recording FOV, across all experiments, were manually tabulated to see if population loss occurred over time (inset). When normalizing and averaging all results, we find that PMN population viewable in a FOV does not decline significantly over a 30-min period, thus making the transmigration ratio comparable to monoculture studies. (C) When calculating transmigration ratio and trajectory statistics, we find that the presence of BPLCs dampens PMN transmigratory behavior. For both sided EECM-BMEC-like cell stimulation conditions (10 pg/ml cytomix), transmigration levels, crawling speed, and persistence are found to be statistically similar. Notably, sided stimulation of EECM-BMEC-like cell resulted in similar PMN crawling speed and persistence when compared to results from negative control studies. In contrast, the presence of an fMLP gradient resulted in significantly faster PMN crawling speed (~22 μm/min). All results are plotted as mean ± SD and are analyzed with a 1-way ANOVA. Statistics: * = P ≤ 0.05, ** = P ≤ 0.01, *** = P ≤ 0.001, ns = not significant.
Fig. 8.
Fig. 8.
The addition of a BPLC culture elicits less PMN transmigration in response to sepsis-like stimulation. (A and B) EECM-BMEC-like cell and BPLC cocultures exhibited minimal differences in PMN trafficking behavior in both positive and negative controls, except for a small but statistically significant increase in crawling speed (by ~5 μm/min in cocultures) was observed. (C) In contrast, the addition of a BPLC culture resulted in significantly dampened PMN transmigratory response under sepsis-like, or apical, inflammatory stimulus (~19%) when compared to EECM-BMEC-like cell monoculture results under the same stimulatory condition (~58%). No significant changes to crawling speed or persistence were seen. (D) Under neuroinflammatory-like, or basal, cytomix stimulation, BPLC culture had no effect on PMN transmigratory behavior or crawling speed. The addition of BPLCs did result in a significant decrease in persistence, however. All results are plotted as mean ± SD and are analyzed with a 1-way ANOVA. Statistics: * = P ≤ 0.05, ** = P ≤ 0.01, *** = P ≤ 0.001, **** = P ≤ 0.0001, ns = not significant.

References

    1. Seymour CW, Liu VX, Iwashyna TJ, Brunkhorst FM, Rea TD, Scherag A, Rubenfeld G, Kahn JM, Shankar-Hari M, Singer M, et al. . Assessment of clinical criteria for sepsis: For the third international consensus definitions for sepsis and septic shock (Sepsis-3). JAMA. 2016;315(8):762–774. - PMC - PubMed
    1. Hajj J, Blaine N, Salavaci J, Jacoby D, Jacoby D. The “centrality of sepsis”: A review on incidence, mortality, and cost of care. Healthcare (Basel). 2018;6(3):90. - PMC - PubMed
    1. Sonneville R, Verdonk F, Rauturier C, Klein IF, Wolff M, Annane D, Chretien F, Sharshar T. Understanding brain dysfunction in sepsis. Ann Intensive Care. 2013;3(1):15. - PMC - PubMed
    1. Seok J, Warren HS, Cuenca AG, Mindrinos MN, Baker HV, Xu W, Richards DR, McDonald-Smith GP, Gao H, Hennessy L, et al. . Genomic responses in mouse models poorly mimic human inflammatory diseases. Proc Natl Acad Sci USA. 2013;110(9):3507–3512. - PMC - PubMed
    1. Fink MP. Animal models of sepsis. Virulence. 2014;5(1):143–153. - PMC - PubMed