

Understanding species limits through the formation of phylogeographic lineages
- PMID: 39364037
- PMCID: PMC11446989
- DOI: 10.1002/ece3.70263
Understanding species limits through the formation of phylogeographic lineages
Abstract
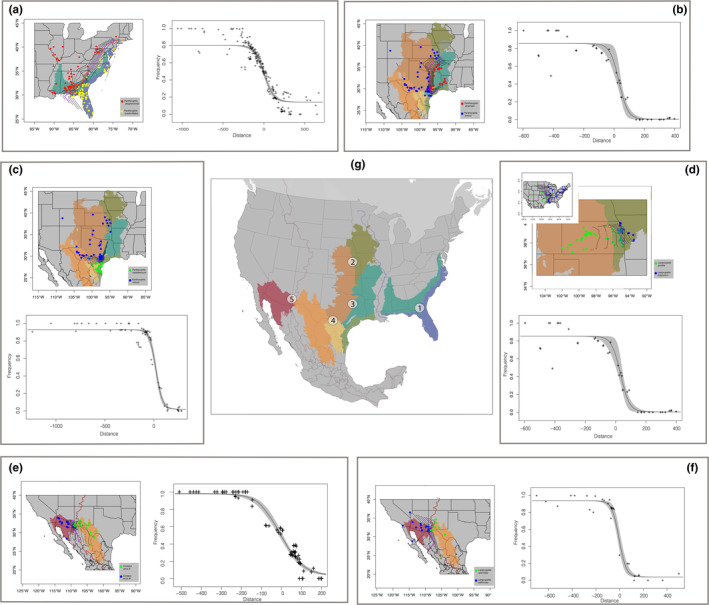
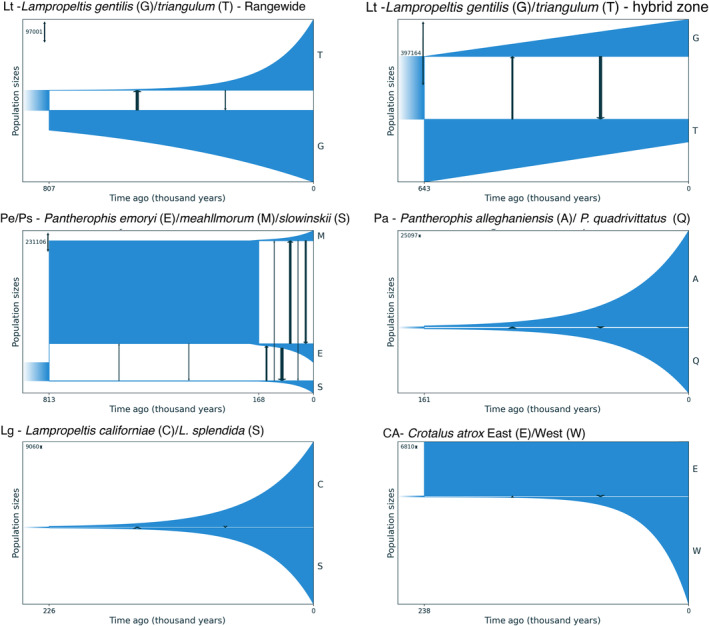
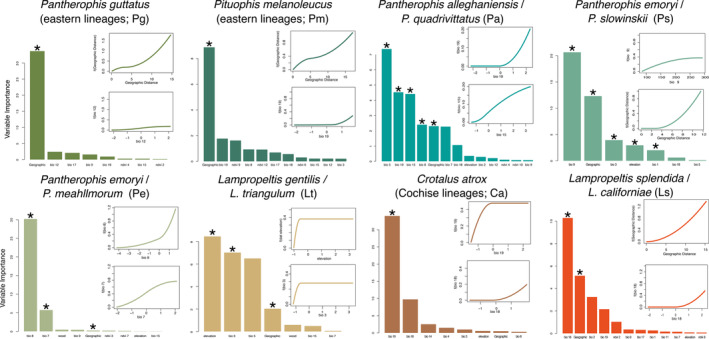
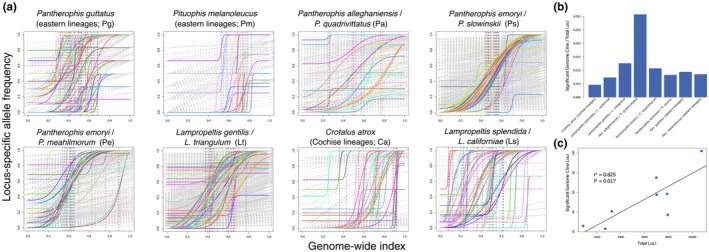
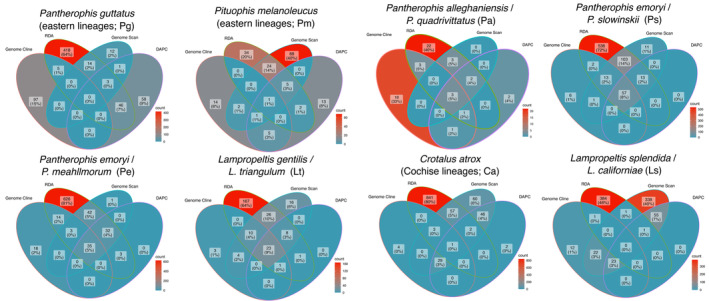
The outcomes of speciation across organismal dimensions (e.g., ecological, genetic, phenotypic) are often assessed using phylogeographic methods. At one extreme, reproductively isolated lineages represent easily delimitable species differing in many or all dimensions, and at the other, geographically distinct genetic segments introgress across broad environmental gradients with limited phenotypic disparity. In the ambiguous gray zone of speciation, where lineages are genetically delimitable but still interacting ecologically, it is expected that these lineages represent species in the context of ontology and the evolutionary species concept when they are maintained over time with geographically well-defined hybrid zones, particularly at the intersection of distinct environments. As a result, genetic structure is correlated with environmental differences and not space alone, and a subset of genes fail to introgress across these zones as underlying genomic differences accumulate. We present a set of tests that synthesize species delimitation with the speciation process. We can thereby assess historical demographics and diversification processes while understanding how lineages are maintained through space and time by exploring spatial and genome clines, genotype-environment interactions, and genome scans for selected loci. Employing these tests in eight lineage-pairs of snakes in North America, we show that six pairs represent 12 "good" species and that two pairs represent local adaptation and regional population structure. The distinct species pairs all have the signature of divergence before or near the mid-Pleistocene, often with low migration, stable hybrid zones of varying size, and a subset of loci showing selection on alleles at the hybrid zone corresponding to transitions between distinct ecoregions. Locally adapted populations are younger, exhibit higher migration, and less ecological differentiation. Our results demonstrate that interacting lineages can be delimited using phylogeographic and population genetic methods that properly integrate spatial, temporal, and environmental data.
Keywords: genome cline; genome selection; hybrid zone; spatial cline; speciation.
© 2024 The Author(s). Ecology and Evolution published by John Wiley & Sons Ltd.
Conflict of interest statement
We declare that there are no competing interests.
Figures
Similar articles
-
Resolving spatial complexities of hybridization in the context of the gray zone of speciation in North American ratsnakes (Pantherophis obsoletus complex).Evolution. 2021 Feb;75(2):260-277. doi: 10.1111/evo.14141. Epub 2021 Jan 5. Evolution. 2021. PMID: 33346918
-
Discerning structure versus speciation in phylogeographic analysis of Seepage Salamanders (Desmognathus aeneus) using demography, environment, geography, and phenotype.Mol Ecol. 2024 Jan;33(2):e17219. doi: 10.1111/mec.17219. Epub 2023 Nov 28. Mol Ecol. 2024. PMID: 38015012
-
Ecological Divergence and the History of Gene Flow in the Nearctic Milksnakes (Lampropeltis triangulum Complex).Syst Biol. 2022 Jun 16;71(4):839-858. doi: 10.1093/sysbio/syab093. Syst Biol. 2022. PMID: 35043210
-
Hybrid zone or hybrid lineage: a genomic reevaluation of Sibley's classic species conundrum in Pipilo towhees.Evolution. 2023 Mar 1;77(3):852-869. doi: 10.1093/evolut/qpac068. Evolution. 2023. PMID: 36626801
-
The coupling hypothesis: why genome scans may fail to map local adaptation genes.Mol Ecol. 2011 May;20(10):2044-72. doi: 10.1111/j.1365-294X.2011.05080.x. Epub 2011 Apr 7. Mol Ecol. 2011. PMID: 21476991 Review.
References
-
- Akima, H. , Gebhard, A. , Petzoldt, T. , & Maechler, M. (2016). Interpolation of irregularly and regularly spaced data [R package akima version 0.6‐2.1]. https://cran.r‐project.org/package=akima. Comprehensive R Archive Network (CRAN).
-
- Amador, L. , Leaché, A. D. , Victoriano, P. F. , Hickerson, M. J. , & D'Elía, G. (2022). Genomic scale data shows that Parastacus nicoleti encompasses more than one species of burrowing continental crayfishes and that lineage divergence occurred with and without gene flow. Molecular Phylogenetics and Evolution, 169, 107443. - PubMed
-
- Ashburner, M. , Ball, C. A. , Blake, J. A. , Botstein, D. , Butler, H. , Cherry, J. M. , Davis, A. P. , Dolinski, K. , Dwight, S. S. , Eppig, J. T. , Harris, M. A. , Hill, D. P. , Issel‐Tarver, L. , Kasarskis, A. , Lewis, S. , Matese, J. C. , Richardson, J. E. , Ringwald, M. , Rubin, G. M. , & Sherlock, G. (2000). Gene ontology: Tool for the unification of biology. The Gene Ontology Consortium. Nature Genetics, 25, 25–29. - PMC - PubMed
LinkOut - more resources
Full Text Sources
Research Materials
