. 2024 Sep 19:15:1422363.
doi: 10.3389/fphar.2024.1422363. eCollection 2024.

Senolytic effect of triterpenoid complex from Ganoderma lucidum on adriamycin-induced senescent human hepatocellular carcinoma cells model in vitro and in vivo

Affiliations

Senolytic effect of triterpenoid complex from Ganoderma lucidum on adriamycin-induced senescent human hepatocellular carcinoma cells model in vitro and in vivo

Ahmed Attia Ahmed Abdelmoaty et al. Front Pharmacol. .

Abstract

Background: Ganoderma lucidum (G. lucidum) is a famous medicinal mushroom that has been reported to prevent and treat a variety of diseases. Different extractions from G. lucidum have been used to manage age-related diseases, including cancer. Nevertheless, the senolytic activity of G. lucidum against senescent cancer cells has not been investigated. Although cellular senescence causes tumor growth inhibition, senescent cells promote the growth of the neighboring tumor cells through paracrine effects. Therefore, the elimination of senescent cells is a new strategy for cancer treatment.

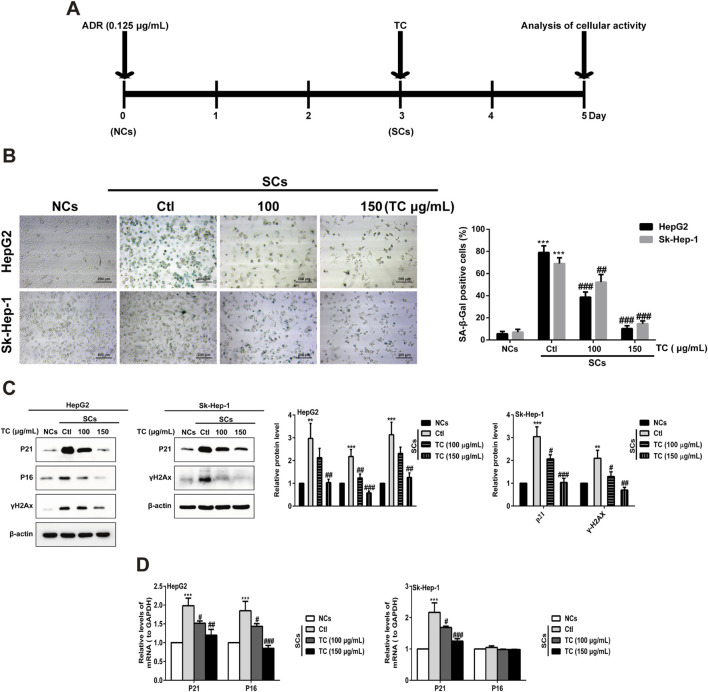
Methods: In this study, senescence was triggered in HCC cells by the chemotherapeutic agent Adriamycin (ADR), and subsequently, cells were treated with TC to assess its senolytic activity.

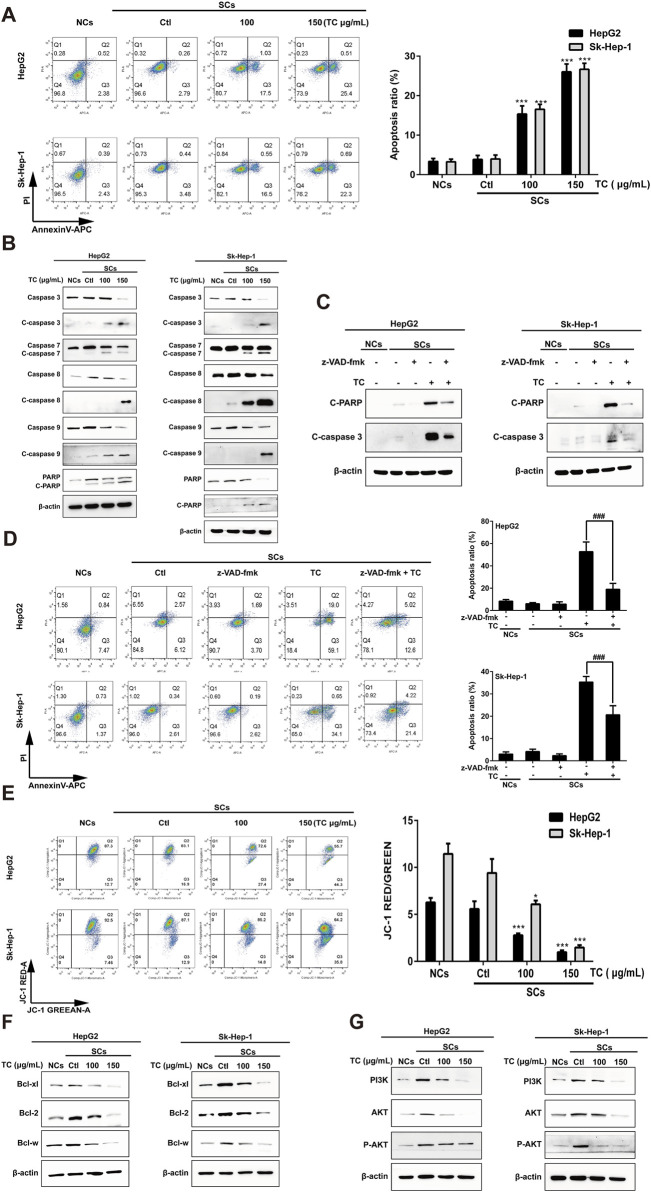
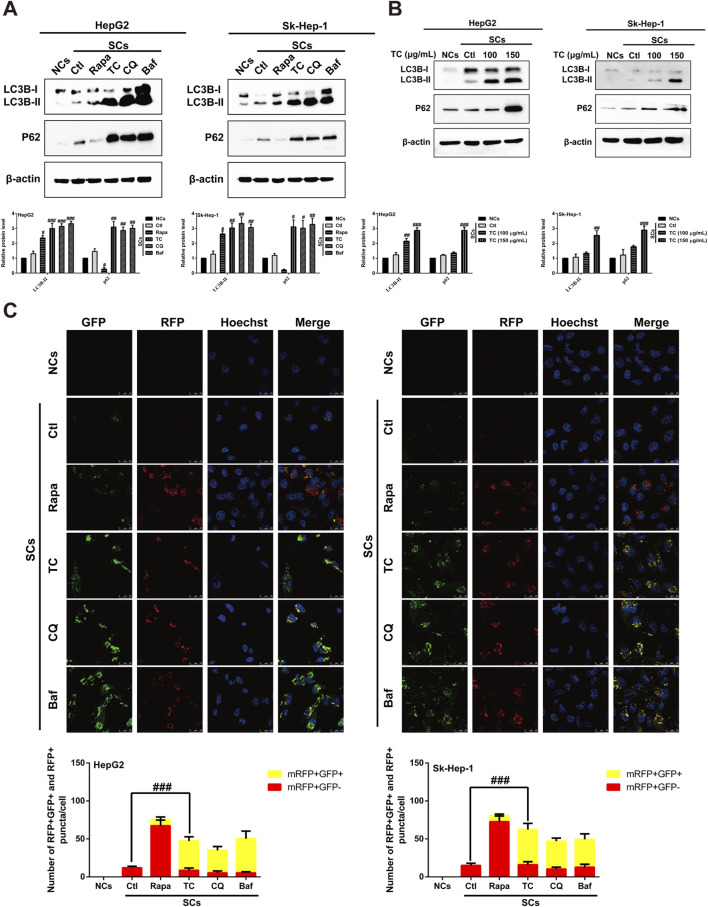
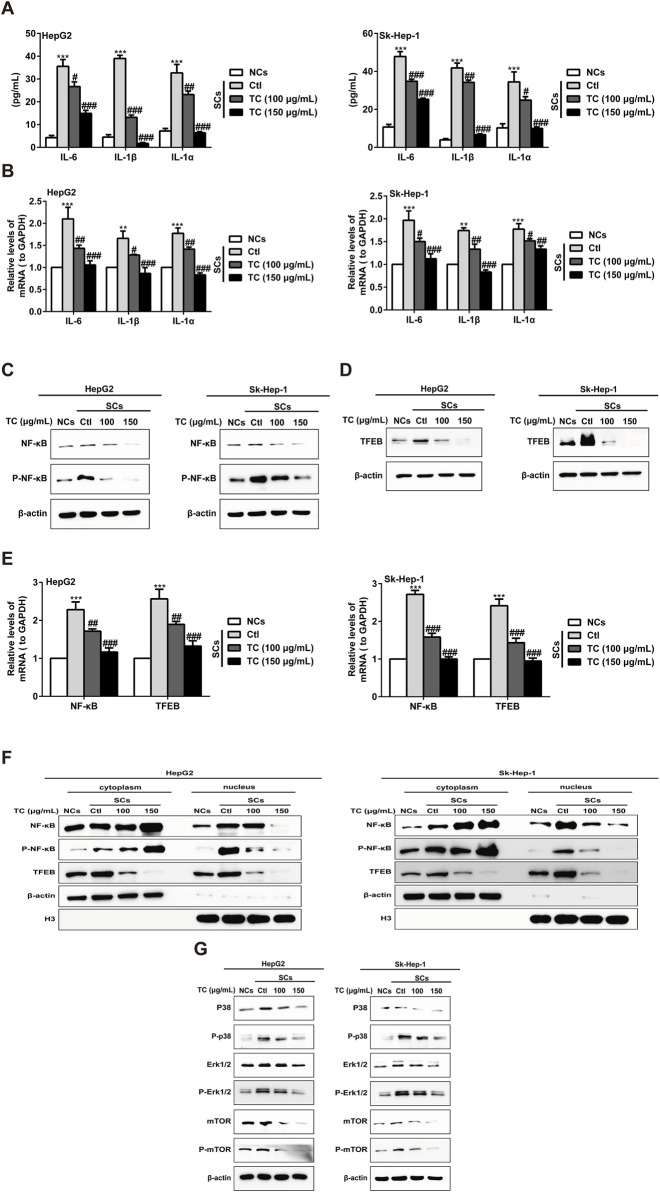
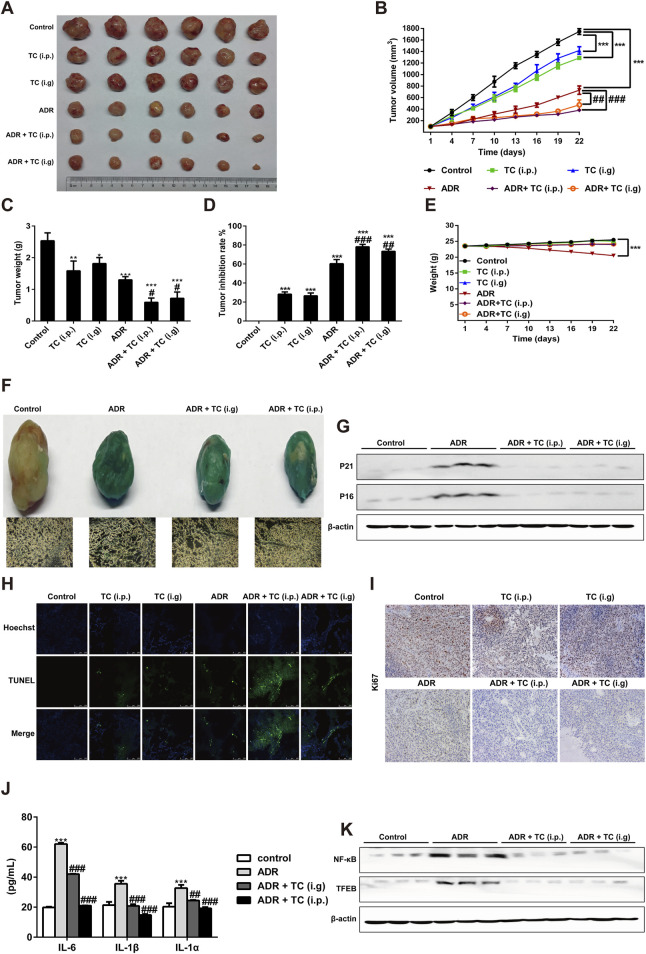
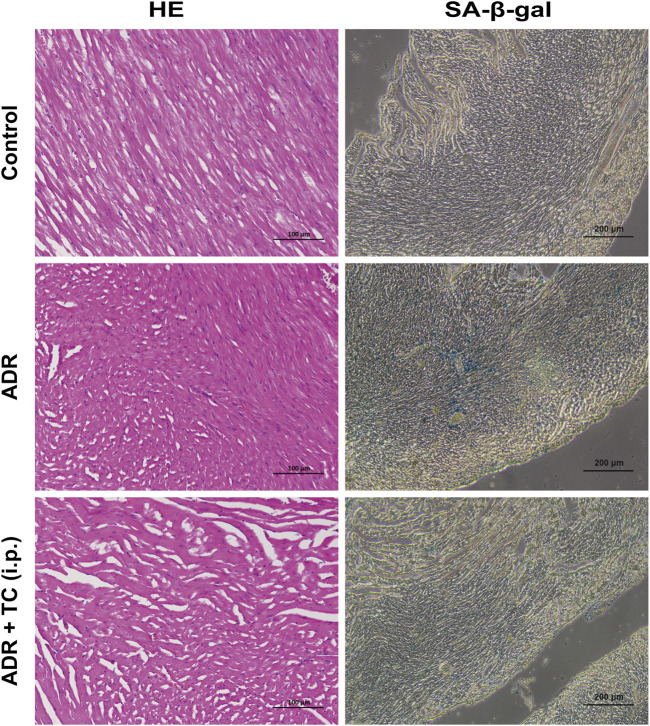
Results: We found for the first time that the triterpenoid complex (TC) from G. lucidum had senolytic effect, which could selectively eliminate adriamycin (ADR)-induced senescent cells (SCs) of hepatocellular carcinoma (HCC) cells via caspase-dependent and mitochondrial pathways-mediated apoptosis and reduce the levels of senescence markers, thereby inhibiting the progression of cancers caused by SCs. TC could block autophagy at the late stage in SCs, resulting in a significant activation of TC-induced apoptosis. Furthermore, TC inhibited the senescence-associated secretory phenotype (SASP) in SCs through the inhibition of NF-κB, TFEB, P38, ERK, and mTOR signaling pathways and reducing the number of SCs. Sequential administration of ADR and TC in vivo significantly reduced tumor growth and reversed the toxicity of ADR.

Conclusion: A triterpenoid complex isolated from G. lucidum may serve as a novel senolytic agent against SCs, and its combination with chemotherapeutic agents may enhance their antitumor efficacy.

Keywords: Ganoderma lucidum; hepatocellular carcinoma; senescence; senolytic agent; triterpenoid complex.


Conflict of interest statement

Authors AA, KZ, CW, and YL were employed by Fujian Xianzhilou Biological Science and Technology Co., Ltd. The remaining authors declare that the research was conducted in the absence of any commercial or financial relationships that could be construed as a potential conflict of interest.

Figures

FIGURE 1
FIGURE 1
The characterization of TC. (A) The total triterpenes content of GLE and TC. Data were shown as mean ± SD (n = 3), *p < 0.05 versus GLE. (B) HPLC chromatograms of GLE, TC, and ganoderic acid A. (C) HPLC chromatograms of TC and reference substances. 1) ganodermanontriol, 2) ganodermanondiol, 3) ganoderiol B, 4) ganoderiol A, 5) ganoderal A.
FIGURE 2
FIGURE 2
TC reduced SCs and downregulated senescence markers. (A) HCC cells were treated with ADR for 3 days and then TC for 2 days. (B) NCs, SCs and TC-treated SCs were stained with SA-β-Gal. (C) The levels of P21Cip1/Waf1, p16Ink4a, and γ-H2AX were determined by Western blotting in NCs, SCs, and TC-treated SCs. (D) P21Cip1/Waf1 and p16Ink4a mRNA levels were determined by quantitative real-time PCR in NCs, SCs, and TC-treated SCs. Data were presented as mean ± SD (n = 3), **P < 0.01 and ***P < 0.001 versus NCs, #P < 0.05, ##P < 0.01 and ###P < 0.001 versus Ctl.
FIGURE 3
FIGURE 3
TC-induced apoptosis in SCs. (A) The percentage of apoptotic cells was analyzed by flow cytometry in NCs, SCs, and TC-treated SCs. (B) The expression levels of apoptosis-related proteins were determined by Western blotting in NCs, SCs, and TC-treated SCs. (C) The expressions of cleaved PARP and cleaved caspase-3 in SCs pre-treated with z-VAD-fmk were detected by Western blotting. (D) Quantification of the apoptotic ratio (annexin V/PI staining) in SCs pre-treated with z-VAD-fmk by flow cytometry. (E) The mitochondrial membrane potential was determined by flow cytometry in NCs, SCs, and TC-treated SCs. (F) The expression levels of Bcl-xl, Bcl-2, and Bcl-w proteins were determined by Western blotting in NCs, SCs, and TC-treated SCs. (G) The expression levels of PI3K, Akt, and P-Akt were determined by Western blotting in NCs, SCs, and TC-treated SCs. Data were presented as the mean ± SD (n = 3), *P < 0.05 and ***P < 0.001 versus Ctl, ###P < 0.001 versus TC treatment.
FIGURE 4
FIGURE 4
TC inhibited autophagy flux in SCs. (A) Western blotting was used to determine the expression levels of LC3BI/II and P62 in NCs, SCs, and Rapa, TC, CQ, and Baf-treated SCs. (B) Western blotting was used to measure the expression levels of autophagy-related proteins in NCs, SCs, and TC-treated SCs. (C) Confocal microscopic analysis of red and yellow puncta in NCs, SCs, and Rapa, TC, CQ and Baf-treated SCs. The bar charts show the quantification of red and yellow puncta per cell. Data were presented as the mean ± SD (n = 3), # p < 0.05, ## p < 0.01 and ### p < 0.001 versus Ctl.
FIGURE 5
FIGURE 5
TC inhibited the SASP in SCs. (A) IL-6, IL-1β, and IL-1α were analyzed by ELISA in NCs, SCs, and TC-treated SCs. (B) IL-6, IL-1β, and IL-1α mRNA levels were measured by quantitative real-time PCR in NCs, SCs, and TC-treated SCs. (C, D) The levels of NF-κB, P-NF-κB, and TFEB were measured by Western blotting in NCs, SCs, and TC-treated SCs. (E) NF-κB and TFEB mRNA levels were measured by quantitative real-time PCR in NCs, SCs, and TC-treated SCs. (F) Western blotting was used to measure the cytoplasmic and nuclear fraction of NF-κB, P-NF-κB, and TFEB in NCs, SCs, and TC-treated SCs. (G) The levels of P38, P-p38, ERK, P-ERK, mTOR, and P-mTOR were measured by Western blotting in NCs, SCs, and TC-treated SCs. Data were presented as the mean ± SD (n = 3), **P < 0.01 and ***P < 0.001 versus NCs, # P < 0.05, ## P < 0.01 and ### P < 0.001 versus Ctl.
FIGURE 6
FIGURE 6
TC enhanced the antitumor effect of ADR in vivo. (A) Tumor sizes in treatment groups. (B) Tumor volumes in treatment groups were measured. (C, D) The tumor weights and tumor inhibition rate were calculated in treatment groups. (E) The body weights of animals in treatment groups were measured. (F) SA-β-Gal staining in tumors and frozen sections from HepG2 xenograft treated with vehicle, ADR and TC. (G) Western blotting was used to measure the expression levels of P21Cip1/Waf1 and p16Ink4a in tumors treated with vehicle, ADR, and TC. (H) The TUNEL assay was performed on frozen sections of tumors from treatment groups. (I) Frozen sections of tumors from treatment groups were stained for Ki67. (J) The levels of IL-6, IL-1β, and IL-1α were measured by ELISA in tumors treated with vehicle, ADR, and TC. (K) Western blotting was used to measure the expression levels of NF-κB and TFEB in tumors treated with vehicle, ADR, and TC. Data were presented as the mean ± SD, *p < 0.05, **P < 0.01 and ***P < 0.001 versus the control, # P < 0.05, ## P < 0.01 and ### P < 0.001 versus ADR treatment.
FIGURE 7
FIGURE 7
Representative images of HE and SA-β-gal staining in different treatment groups.

Similar articles

Cited by

References

    1. Acosta J. C., Banito A., Wuestefeld T., Georgilis A., Janich P., Morton J. P., et al. (2013). A complex secretory program orchestrated by the inflammasome controls paracrine senescence. Nat. Cell. Biol. 15 (8), 978–990. 10.1038/ncb2784 - DOI - PMC - PubMed
    1. Amaravadi R. K., Lippincott-Schwartz J., Yin X.-M., Weiss W. A., Takebe N., Timmer W., et al. (2011). Principles and current strategies for targeting autophagy for cancer treatment. Clin. Cancer Res. 17 (4), 654–666. 10.1158/1078-0432.CCR-10-2634 - DOI - PMC - PubMed
    1. Baar M. P., Brandt R. M., Putavet D. A., Klein J. D., Derks K. W., Bourgeois B. R., et al. (2017). Targeted apoptosis of senescent cells restores tissue homeostasis in response to chemotoxicity and aging. Cell. 169 (1), 132–147. 10.1016/j.cell.2017.02.031 - DOI - PMC - PubMed
    1. Bartlett A., Heaton N. (2008). Hepatocellular carcinoma: defining the place of surgery in an era of organ shortage. World J. Gastroenterol. 14 (28), 4445–4453. 10.3748/wjg.14.4445 - DOI - PMC - PubMed
    1. Bhardwaj A., Srivastava M., Pal M., Sharma Y. K., Bhattacharya S., Tulsawani R., et al. (2016). Screening of Indian lingzhi or reishi medicinal mushroom, Ganoderma lucidum (agaricomycetes): a upc 2-sqd-ms approach. Int. J. Med. Mushrooms 18 (2), 177–189. 10.1615/IntJMedMushrooms.v18.i2.80 - DOI - PubMed

LinkOut - more resources