

Nitrogen-doped carbon quantum dot regulates cell proliferation and differentiation by endoplasmic reticulum stress
- PMID: 39364144
- PMCID: PMC11448352
- DOI: 10.1080/19768354.2024.2409452
Nitrogen-doped carbon quantum dot regulates cell proliferation and differentiation by endoplasmic reticulum stress
Abstract
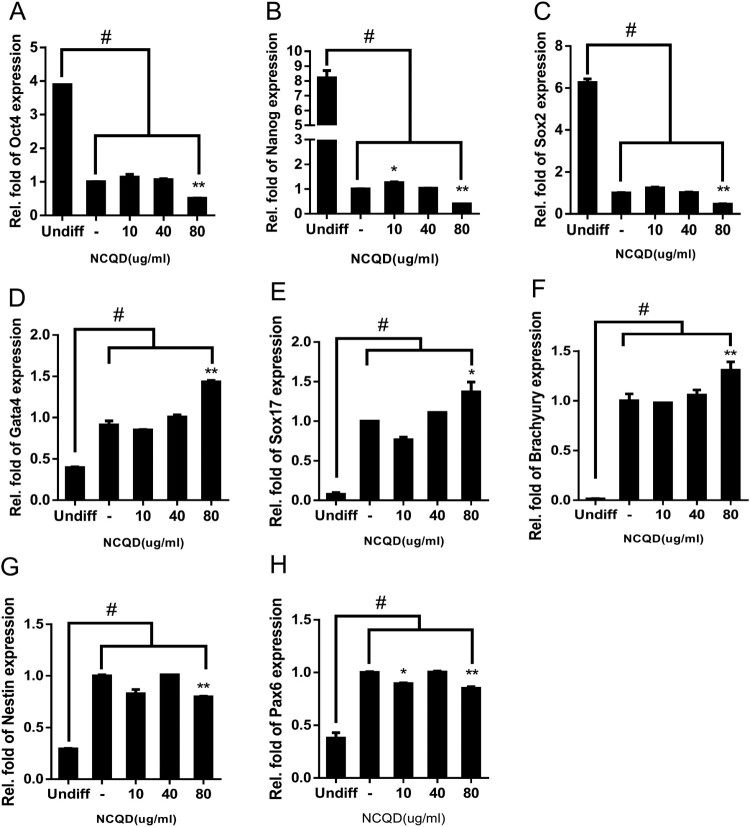
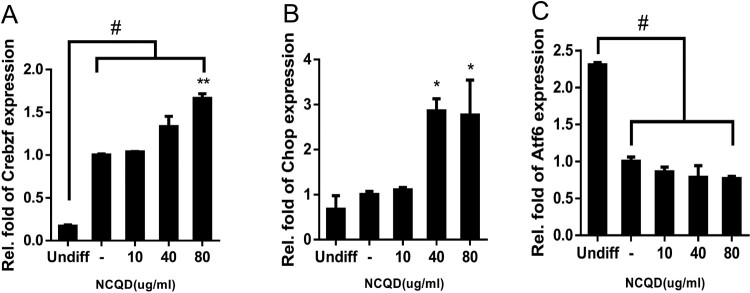
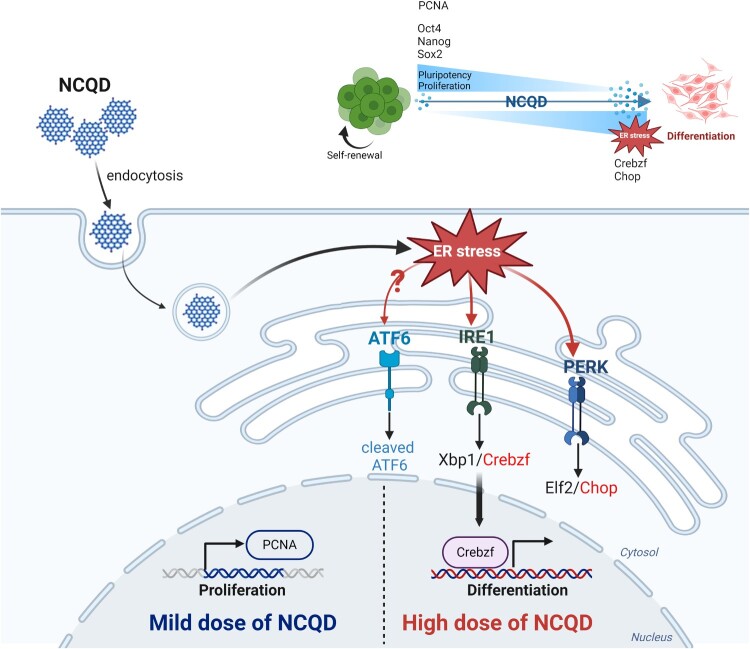
Quantum dots have diverse biomedical applications, from constructing biological infrastructures like medical imaging to advancing pharmaceutical research. However, concerns about human health arise due to the toxic potential of quantum dots based on heavy metals. Therefore, research on quantum dots has predominantly focused on oxidative stress, cell death, and other broader bodily toxicities. This study investigated the toxicity and cellular responses of mouse embryonic stem cells (mESCs) and mouse adult stem cells (mASCs) to nitrogen-doped carbon quantum dots (NCQDs) made of non-metallic materials. Cells were exposed to NCQDs, and we utilized a fluorescent ubiquitination-based cell system to verify whether NCQDs induce cytotoxicity. Furthermore, we validated the differentiation-inducing impact of NCQDs by utilizing embryonic stem cells equipped with the Oct4 enhancer-GFP reporter system. By analyzing gene expression including Crebzf, Chop, and ATF6, we also observed that NCQDs robustly elicited endoplasmic reticulum (ER) stress. We confirmed that NCQDs induced cytotoxicity and abnormal differentiation. Interestingly, we also confirmed that low concentrations of NCQDs stimulated cell proliferation in both mESCs and mASCs. In conclusion, NCQDs modulate cell death, proliferation, and differentiation in a concentration-dependent manner. Indiscriminate biological applications of NCQDs have the potential to cause cancer development by affecting normal cell division or to fail to induce normal differentiation by affecting embryonic development during pregnancy. Therefore, we propose that future biomedical applications of NCQDs necessitate comprehensive and diverse biological studies.
Keywords: ER stress; Nitrogen-doped carbon quantum dot; cell proliferation; differentiation.
© 2024 The Author(s). Published by Informa UK Limited, trading as Taylor & Francis Group.
Conflict of interest statement
No potential conflict of interest was reported by the author(s).
Figures
Similar articles
-
Highly luminescent N-doped carbon quantum dots as an effective multifunctional fluorescence sensing platform.Chemistry. 2014 Feb 17;20(8):2254-63. doi: 10.1002/chem.201304374. Epub 2014 Jan 21. Chemistry. 2014. PMID: 24449509
-
Nitrogen-doped carbon quantum dots as an antimicrobial agent against Staphylococcus for the treatment of infected wounds.Colloids Surf B Biointerfaces. 2019 Jul 1;179:17-27. doi: 10.1016/j.colsurfb.2019.03.042. Epub 2019 Mar 19. Colloids Surf B Biointerfaces. 2019. PMID: 30928801
-
Highly Luminescent Nitrogen Doped Carbon Quantum Dots for Mercury Ion Sensing with Antibacterial Activity.J Fluoresc. 2025 Jan 11. doi: 10.1007/s10895-024-04119-4. Online ahead of print. J Fluoresc. 2025. PMID: 39798020
-
Shaddock peel-derived N-doped carbon quantum dots coupled with ultrathin BiOBr square nanosheets with boosted visible light response for high-efficiency photodegradation of RhB.Environ Pollut. 2023 May 15;325:121424. doi: 10.1016/j.envpol.2023.121424. Epub 2023 Mar 9. Environ Pollut. 2023. PMID: 36906054 Review.
-
A brief review on the synthesis, characterisation and analytical applications of nitrogen doped carbon dots.Anal Methods. 2022 Mar 3;14(9):877-891. doi: 10.1039/d1ay02105b. Anal Methods. 2022. PMID: 35174374 Review.
Cited by
-
Brief guide to assays for measuring health parameters using Caenorhabditis elegans.Mol Cells. 2025 Aug;48(8):100233. doi: 10.1016/j.mocell.2025.100233. Epub 2025 May 26. Mol Cells. 2025. PMID: 40436147 Free PMC article. Review.
References
-
- Blanco-Gelaz MA, Suarez-Alvarez B, Ligero G, Sanchez L, Vidal-Castiñeira JR, Coto E, Moore H, Menendez P, Lopez-Larrea C.. 2010. Endoplasmic reticulum stress signals in defined human embryonic stem cell lines and culture conditions. Stem Cell Rev Rep. 6:462–472. doi:10.1007/s12015-010-9135-4. - DOI - PubMed
LinkOut - more resources
Full Text Sources
Research Materials