

A data science pipeline applied to Australia's 2022 COVID-19 Omicron waves
- PMID: 39364337
- PMCID: PMC11447346
- DOI: 10.1016/j.idm.2024.08.005
A data science pipeline applied to Australia's 2022 COVID-19 Omicron waves
Abstract
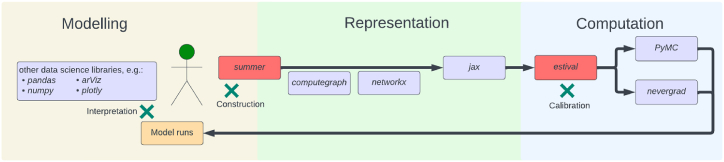
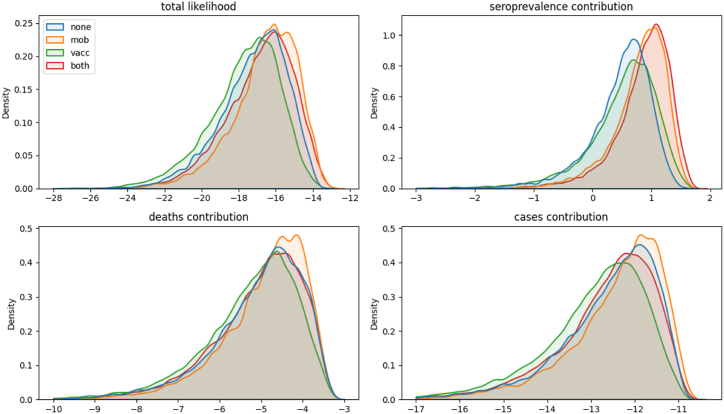
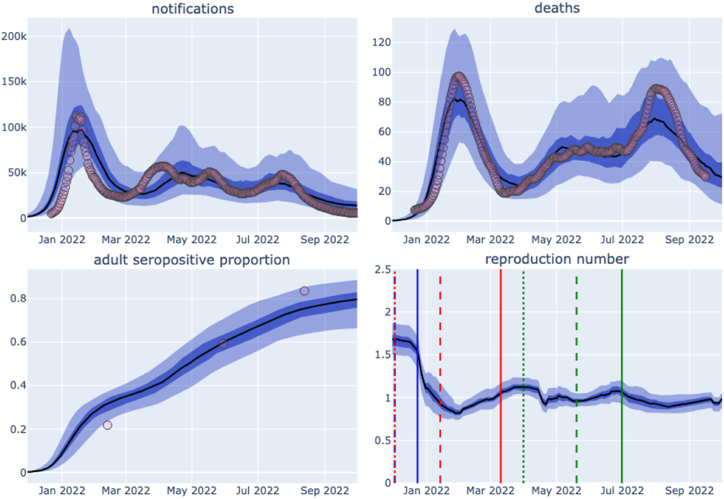
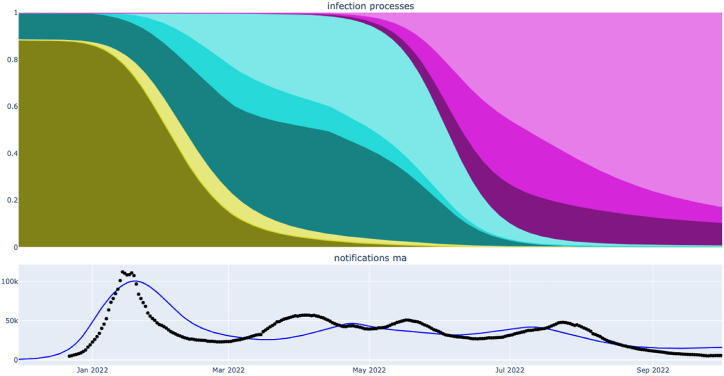
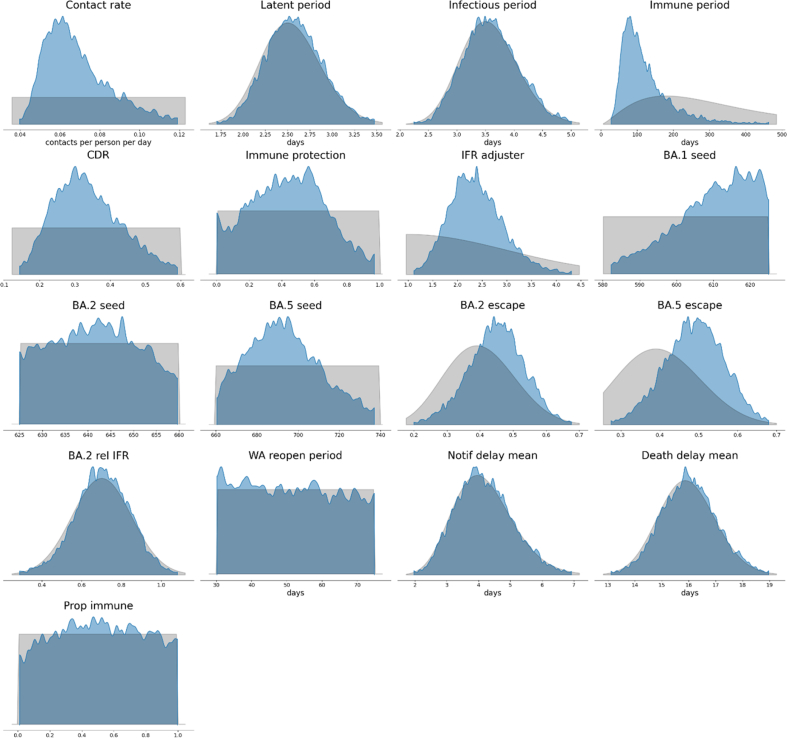
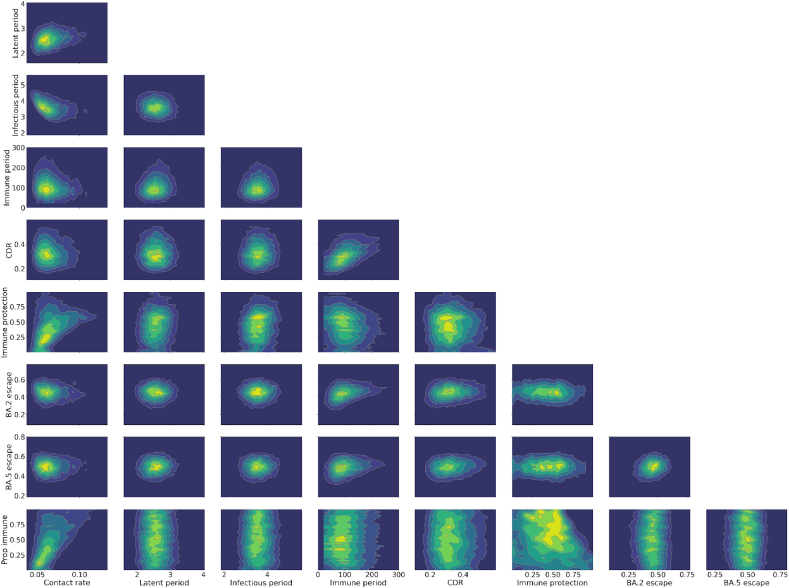
The field of software engineering is advancing at astonishing speed, with packages now available to support many stages of data science pipelines. These packages can support infectious disease modelling to be more robust, efficient and transparent, which has been particularly important during the COVID-19 pandemic. We developed a package for the construction of infectious disease models, integrated it with several open-source libraries and applied this composite pipeline to multiple data sources that provided insights into Australia's 2022 COVID-19 epidemic. We aimed to identify the key processes relevant to COVID-19 transmission dynamics and thereby develop a model that could quantify relevant epidemiological parameters. The pipeline's advantages include markedly increased speed, an expressive application programming interface, the transparency of open-source development, easy access to a broad range of calibration and optimisation tools and consideration of the full workflow from input manipulation through to algorithmic generation of the publication materials. Extending the base model to include mobility effects slightly improved model fit to data, with this approach selected as the model configuration for further epidemiological inference. Under our assumption of widespread immunity against severe outcomes from recent vaccination, incorporating an additional effect of the main vaccination programs rolled out during 2022 on transmission did not further improve model fit. Our simulations suggested that one in every two to six COVID-19 episodes were detected, subsequently emerging Omicron subvariants escaped 30-60% of recently acquired natural immunity and that natural immunity lasted only one to eight months on average. We documented our analyses algorithmically and present our methods in conjunction with interactive online code notebooks and plots. We demonstrate the feasibility of integrating a flexible domain-specific syntax library with state-of-the-art packages in high performance computing, calibration, optimisation and visualisation to create an end-to-end pipeline for infectious disease modelling. We used the resulting platform to demonstrate key epidemiological characteristics of the transition from the emergency to the endemic phase of the COVID-19 pandemic.
Keywords: COVID-19; Computational simulation; Epidemiology; Software design.
© 2024 The Authors.
Conflict of interest statement
The authors declare no competing interests.
Figures
References
-
- Altarawneh H.N., Chemaitelly H., Ayoub H.H., Hasan M.R., Coyle P., Yassine H.M., Al-Khatib H.A., Smatti M.K., Al-Kanaani Z., Al-Kuwari E., Jeremijenko A., Kaleeckal A.H., Latif A.N., Shaik R.M., Abdul-Rahim H.F., Nasrallah G.K., Al-Kuwari M.G., Butt A.A., Al-Romaihi H.E.…Abu-Raddad L.J. Protective effect of previous SARS-CoV-2 infection against omicron BA.4 and BA.5 subvariants. New England Journal of Medicine. 2022;387(17):1620–1622. doi: 10.1056/NEJMc2209306. - DOI - PMC - PubMed
-
- Braeye T., Catteau L., Brondeel R., van Loenhout J.A.F., Proesmans K., Cornelissen L., Van Oyen H., Stouten V., Hubin P., Billuart M., Djiena A., Mahieu R., Hammami N., Van Cauteren D., Wyndham-Thomas C. Vaccine effectiveness against transmission of alpha, delta and omicron SARS-COV-2-infection, Belgian contact tracing, 2021-2022. Vaccine. 2023;41(20):3292–3300. doi: 10.1016/j.vaccine.2023.03.069. - DOI - PMC - PubMed
-
- Caldwell J.M., de Lara-Tuprio E., Teng T.R., Estuar M.R.J.E., Sarmiento R.F.R., Abayawardana M., Leong R.N.F., Gray R.T., Wood J.G., Le L.-V., McBryde E.S., Ragonnet R., Trauer J.M. Understanding COVID-19 dynamics and the effects of interventions in the Philippines: A mathematical modelling study. The Lancet Regional Health – Western Pacific. 2021;14 doi: 10.1016/j.lanwpc.2021.100211. - DOI - PMC - PubMed
-
- Carazo S., Skowronski D.M., Brisson M., Barkati S., Sauvageau C., Brousseau N., Gilca R., Fafard J., Talbot D., Ouakki M., Gilca V., Carignan A., Deceuninck G., De Wals P., De Serres G. Protection against omicron (B.1.1.529) BA.2 reinfection conferred by primary omicron BA.1 or pre-omicron SARS-CoV-2 infection among health-care workers with and without mRNA vaccination: A test-negative case-control study. The Lancet Infectious Diseases. 2023;23(1):45–55. doi: 10.1016/S1473-3099(22)00578-3. - DOI - PMC - PubMed
LinkOut - more resources
Full Text Sources
